Downloaded 231 times
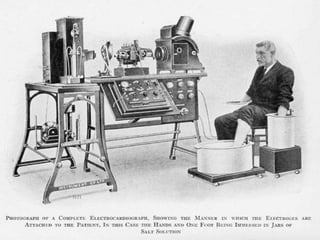
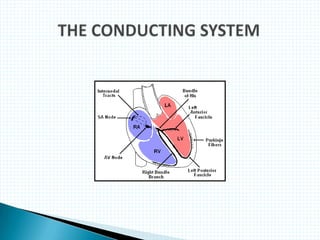

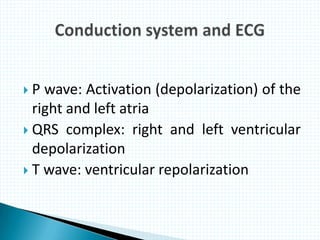
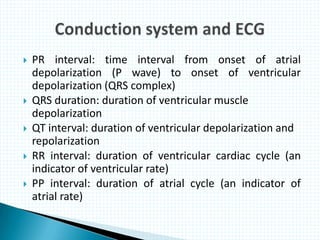
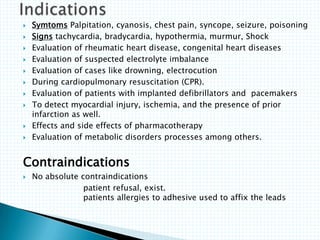
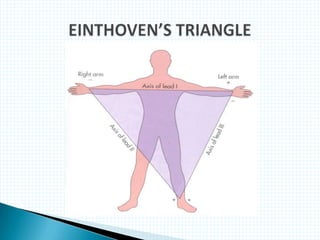
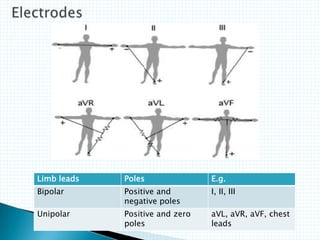
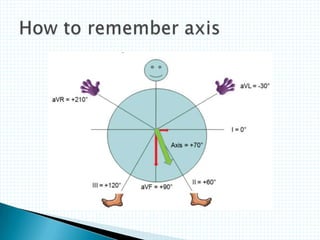
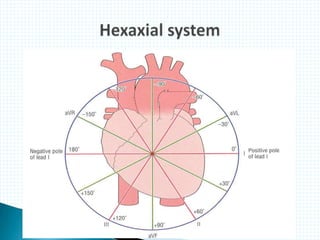
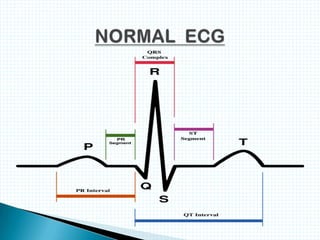
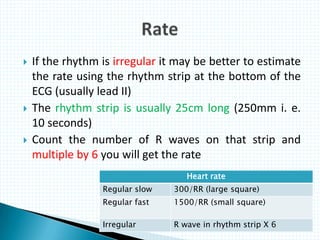
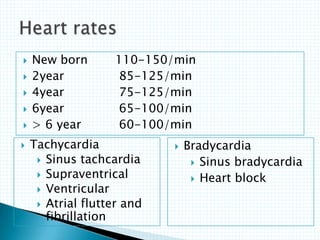
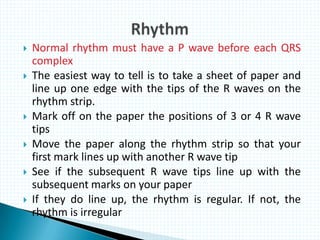
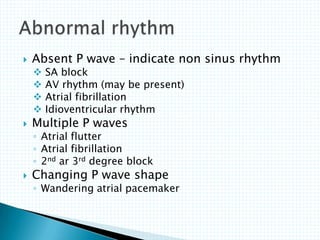
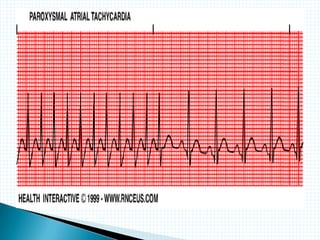
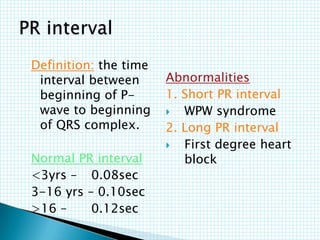
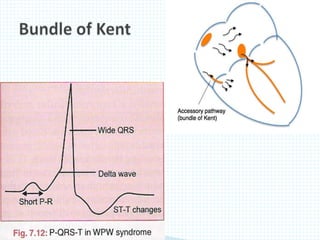
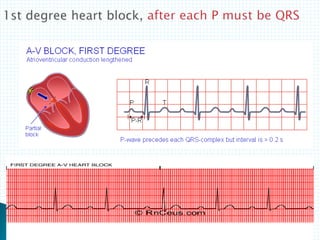


The document provides information about electrocardiography (EKG/ECG). It describes the conduction system of the heart and how electrical signals are conducted to trigger heart contractions. It explains how an EKG works, including electrode placement and what different parts of the EKG waveform represent. It also covers how to interpret an EKG, such as measuring heart rate and identifying abnormalities. Common abnormalities, their causes, and clinical significance are discussed.