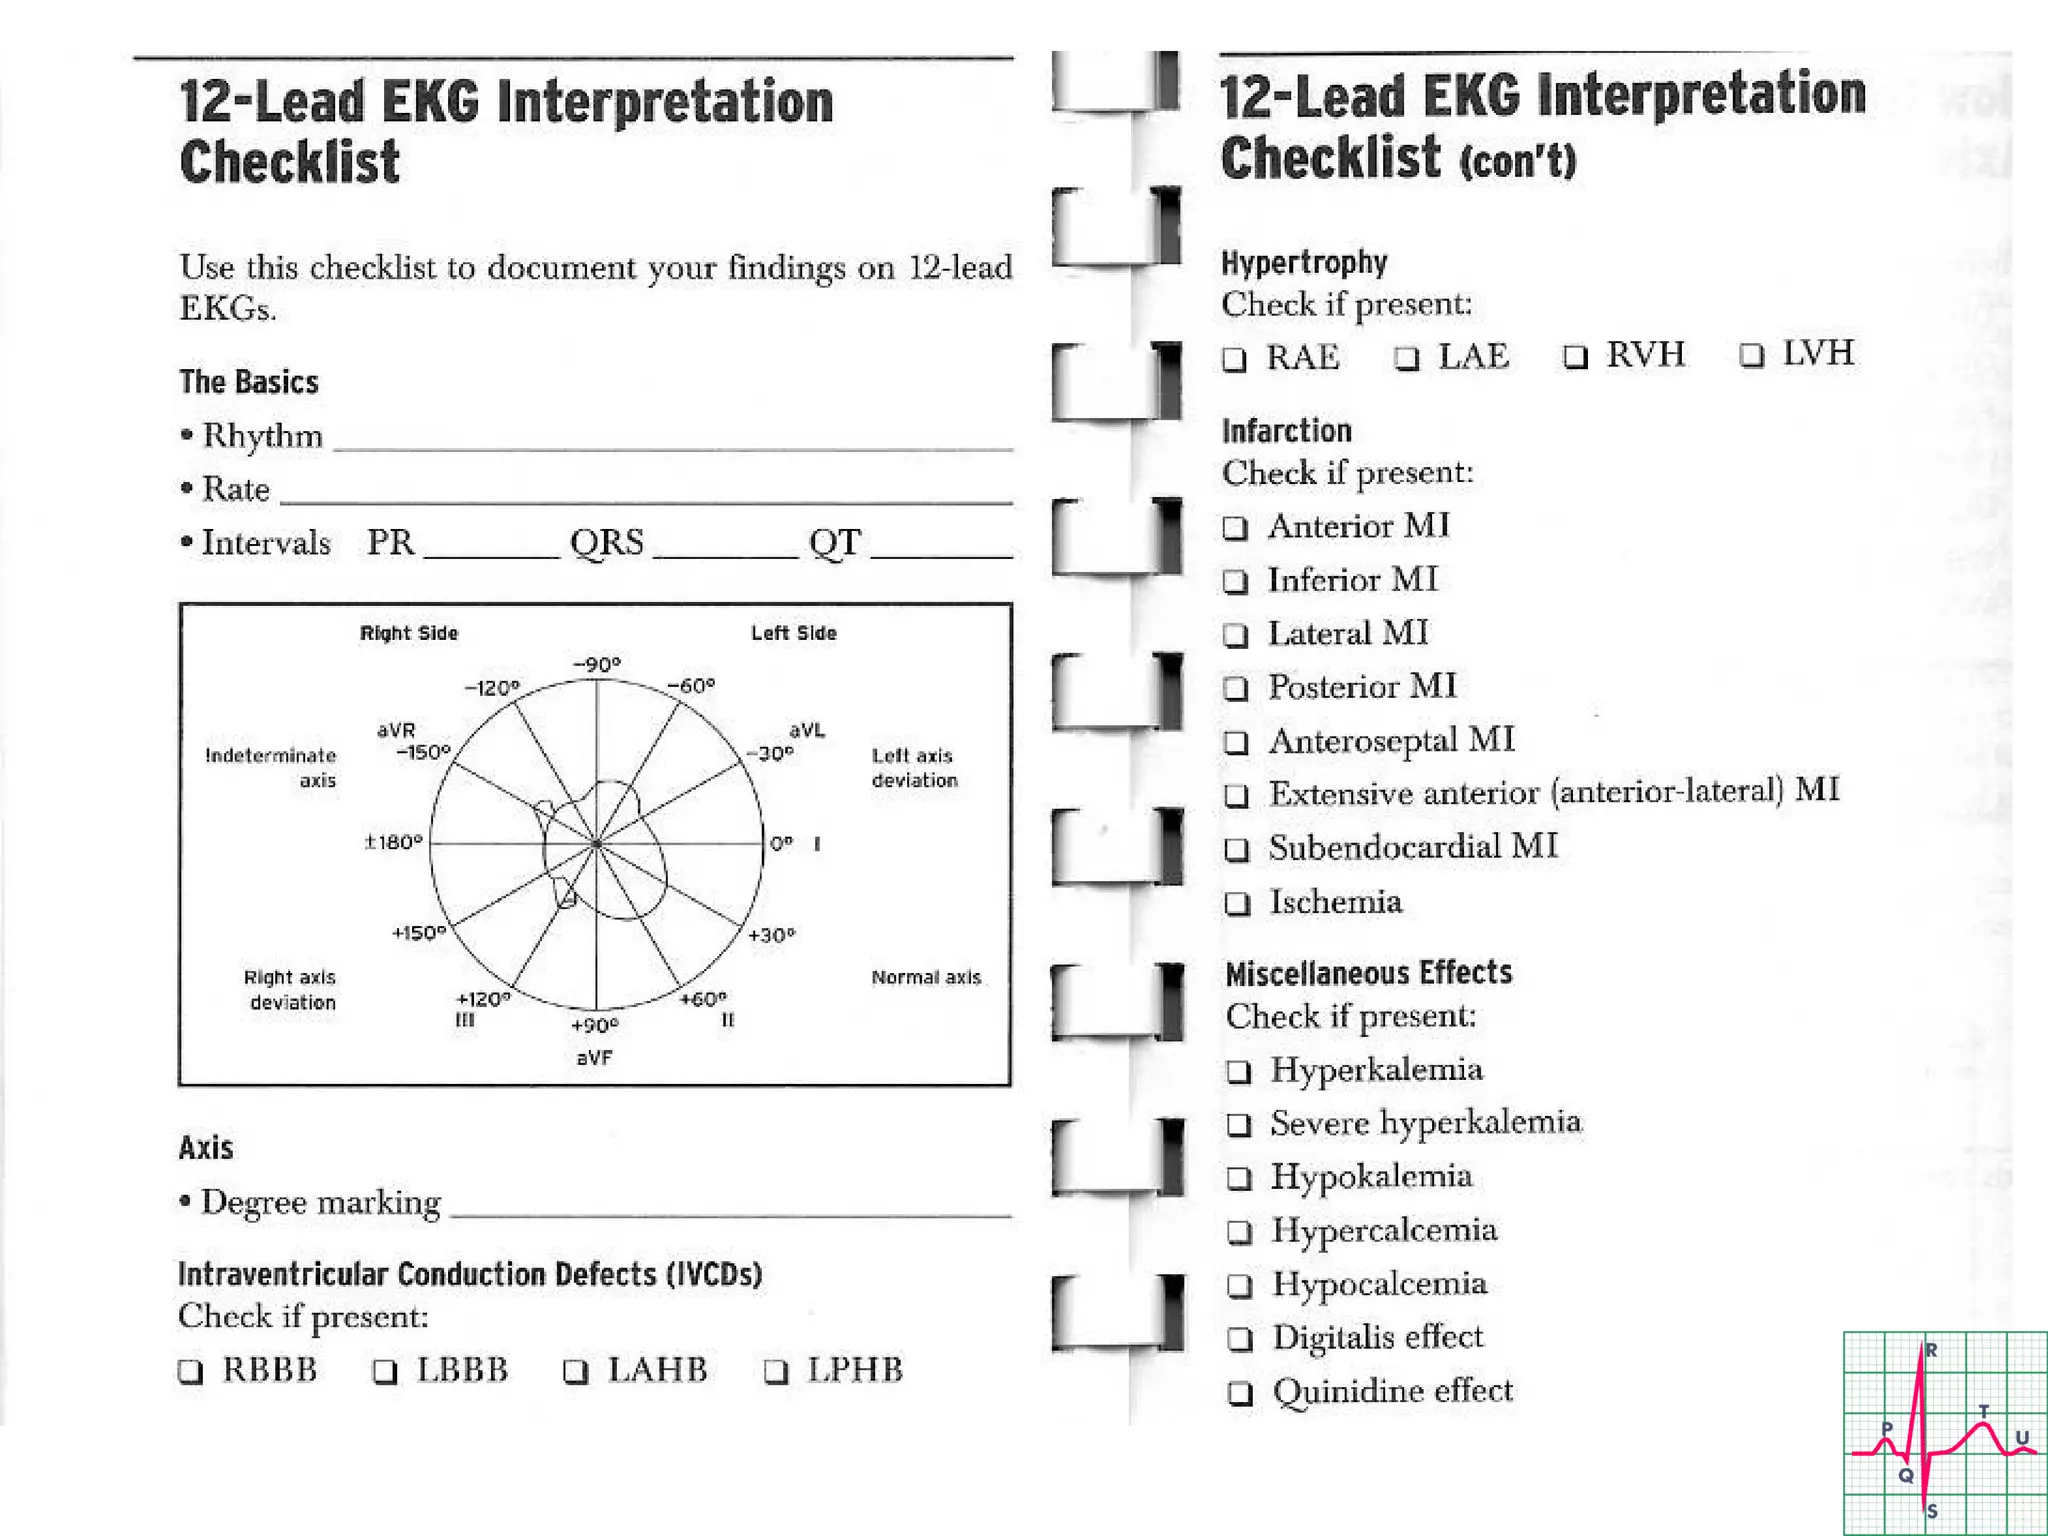
A lecture on the echocardiographic evaluation of hypertrophic cardiomyopathy. Starts with an overview of the topic then a systematic approach to diagnosis and then a differential diagnosis followed by take-home messages and conclusion.
Repolarization ST wave Abnormalities
Precise guide for Allied Health Science Students especially cardiac specialty students, DGNM, B.Sc Nursing & M.Sc Nursing Students regarding Repolarization ST wave Abnormalities.
Biatrial enlargement is diagnosed when criteria for both right and left atrial enlargement are present on the same ECG.
The diagnosis of biatrial enlargement requires criteria for LAE and RAE to be met in either lead II, lead V1 or a combination of leads.
How to read ECG systematically with practice strips Khaled AlKhodari
This lecture simplifies the steps of reading ECG systematically. It starts with a simple heart anatomy and the logical steps that should be followed to perfect ECG reading without missing any abnormality. Finally, there are some practice ECG strips that include but not only MI, STEMI, Wellens syndrome, Pulmonary embolism, LVH, arrhythmias... and others
Power Point Presentation on Chest X-Ray by Dr Md Main Uddin (MBBS, FCPS), Assistant Professor (Medicine), Cox’s Bazar Medical College, Bangladesh
email -- jawadaug2006@gmail.com
Synthetic Fiber Construction in lab .pptxPavel ( NSTU)
Synthetic fiber production is a fascinating and complex field that blends chemistry, engineering, and environmental science. By understanding these aspects, students can gain a comprehensive view of synthetic fiber production, its impact on society and the environment, and the potential for future innovations. Synthetic fibers play a crucial role in modern society, impacting various aspects of daily life, industry, and the environment. ynthetic fibers are integral to modern life, offering a range of benefits from cost-effectiveness and versatility to innovative applications and performance characteristics. While they pose environmental challenges, ongoing research and development aim to create more sustainable and eco-friendly alternatives. Understanding the importance of synthetic fibers helps in appreciating their role in the economy, industry, and daily life, while also emphasizing the need for sustainable practices and innovation.
Introduction to AI for Nonprofits with Tapp NetworkTechSoup
Dive into the world of AI! Experts Jon Hill and Tareq Monaur will guide you through AI's role in enhancing nonprofit websites and basic marketing strategies, making it easy to understand and apply.
Instructions for Submissions thorugh G- Classroom.pptxJheel Barad
This presentation provides a briefing on how to upload submissions and documents in Google Classroom. It was prepared as part of an orientation for new Sainik School in-service teacher trainees. As a training officer, my goal is to ensure that you are comfortable and proficient with this essential tool for managing assignments and fostering student engagement.
Welcome to TechSoup New Member Orientation and Q&A (May 2024).pdfTechSoup
In this webinar you will learn how your organization can access TechSoup's wide variety of product discount and donation programs. From hardware to software, we'll give you a tour of the tools available to help your nonprofit with productivity, collaboration, financial management, donor tracking, security, and more.
Acetabularia Information For Class 9 .docxvaibhavrinwa19
Acetabularia acetabulum is a single-celled green alga that in its vegetative state is morphologically differentiated into a basal rhizoid and an axially elongated stalk, which bears whorls of branching hairs. The single diploid nucleus resides in the rhizoid.
10. EKG Distributions
Anteroseptal: V1, V2, V3, V4
Anterior: V1–V6
Anterolateral: V4–V6, I, aVL
Lateral: I and aVL
Inferior: II, III, and aVF
Inferolateral: II, III, aVF, and
V5 and V6
11. ECG conventions
Depolarisation towards electrode: positive deflection
Depolarisation away from electrode: negative
deflection
Sensitivity: 10 mm = 1 mV
Paper speed: 25 mm per second
Each large (5 mm) square = 0.2 s
Each small (1 mm) square = 0.04 s
Heart rate = 1500/RR interval (mm) (i.e. 300 ÷
number of large squares between beats)
14. Check quality of ECG
Patient’s name, age, sex
Date of ECG
12 leads
Rhythm strip (II or V1) at bottom
Scale:
◦ 25mm/s horizontal
◦ 10mm/mV vertical
◦ Little square=0.04s; big square=0.2s
15. Interpretation
Quality of ECG?
Rate
Rhythm
Axis
P wave
PR interval
QRS duration
morphology
abnormal Q waves
ST segment
T wave
QT interval
16. Rate
Rule of 300- Divide 300 by the number
of boxes between each QRS = rate
Number of
big boxes
Rate
1 300
2 150
3 100
4 75
5 60
6 50
17. Rate
HR of 60-100 per minute is normal
HR > 100 = tachycardia
HR < 60 = bradycardia
When rate is irregular, count the
number of R in 30 large square and
multiply by 10 to get HR.
18. What is the heart rate?
(300 / 6) = 50 bpm
www.uptodate.com
24. Differential Diagnosis of Tachycardia
Tachycardia Narrow Complex Wide Complex
Regular ST
SVT
Atrial flutter
Sinus arrythmia
ST with
aberrancy
SVT with
aberrancy
VT
Irregular AF
Atrial flutter with
variable conduction
AF with aberrancy
AF with VT
25. The QRS Axis
Represents the overall direction of the heart’s activity
Axis of –30 to +90 degrees is normal
31. Axis deviation
LAD
Normal
LVH
LAHB
LBBB
Inferior MI
RAD
Normal
RVH
High lateral MI
LPHB
Dextrocardia
32. P wave
2.5 X 2.5 ssq
Better seen in lead II
and V1
Upright in all leads
except aVR
Absent in AF, A Fl,
SA block, nodal
rythme, SVT, VT
Tall in RAE
Wide in LAE
Inverted in
incorrectly placed
leads, dextrocardia
33. PR intervel
Normal (0.12 to 0.20
sec)
Short (<0.12 sec)
Nodal rythme, nodal
ectopics, WPW
syndrome
Prolonged (>0.20
sec) (1o
HB)
IHD, myocarditis
Variable
2o
or 3o
heart block
34. Blocks
AV blocks
First degree block
PR interval fixed and > 0.2 sec
Second degree block, Mobitz type 1
PR gradually lengthened, then drop QRS
Second degree block, Mobitz type 2
PR fixed, but drop QRS randomly
Type 3 block
PR and QRS dissociated
36. What is this rhythm?
Type 1 second degree block
(Wenckebach)
37. What is this rhythm?
Type 2 second degree AV block
Dropped QRS
38. What is this rhythm?
3rd
degree heart block (complete)
39. QRS complex
Q wave
<25% of R wave, depth <2
mm, wide 1 smm
Pathological Q
Mentioned 3 plus
Loss of height of R wave
Present in >1 lead
Causes
MI, VH, Cardiomyopathy,
LBBB
R wave
Normal height
aVL <13mm, aVF <20mm,
V5 or V6 <25mm
Causes of tall R wave
LVH
Tall R in V1 - Normal
RVH, RBBB, dextrocardia,
true posterior MI, WPW
syndrome type A
40. QRS complex
Causes of small R
wave
Incorrect
standardization,
emphysema,
obesity, pericardial
effusion,
hypothyroidism
Causes of poor R
wave progression
MI (A/S), LBBB,
COPD, dextrocardia
41. QRS complex
QRS may be high
voltage, low voltage,
wide, abnormal
shape
Wide QRS
BBB, VES,VT,WPW,
pacemaker
Abnormal shape
BBB, VT, VF
42. BBB
W I LL ia M = LBBB
M a RR o W = RBBB
Look at V1 and V6
43. T wave
Upright in all leads
except aVR
Usually >2mm height
(<5mm in limb leads
and <10 mm in chest
leads)
Tip smooth or rounded
Inverted
ischaemia, previous
infarct, VH, BBB,
pericarditis,
cardiomyopathy
Peaked
hyperkalaemia
normal young man
hyperacute MI
Small
Hypokalaemia
Hypothyroidism
Pericaddial effusion
46. QT interval
Start of QRS to end of T wave
Needs to be corrected for HR
Various formulae
Computer calculated often wrong
Long QT can be genetic (long QT sy.) or
secondary eg. drugs (amiodarone, sotalol)
Associated with risk of sudden death due to
Torsades de Pointes
47. Prolonged QT
Normal
Normal < 0.42 secs
Causes prolonged QT
Drugs (Na channel blockers)
Hypocalcemia, hypomagnesemia, hypokalemia
Hypothermia
AMI
Congenital
Increased ICP
49. Hypertrophy
Add the larger S wave of V1 or V2 in
mm, to the larger R wave of V5 or V6.
Sum is > 35mm = LVH
50. Ischemia
Usually indicated by ST changes
Elevation = Acute infarction
Depression = Ischemia
Can manifest as T wave changes
Remote ischemia shown by q waves
51. ST segment
ST depression
◦ Downsloping or horizontal = abnormal
◦ Ischaemia (coronary stenosis)
◦ If lateral (V4-V6), consider LVH with ‘strain’ or digoxin
(reverse tick sign)
ST elevation
◦ Infarction (coronary occlusion)
◦ Pericarditis (widespread)
These are usually in ‘territories’ eg. anterior/lateral/inferior
etc. and will be present in contiguous leads
53. What do you see in this EKG?
ST depression II, III, aVF, V3-V6 = ischemia
54. How to read a 12-lead ECG:
examination sequence
Rhythm strip (lead II) - To determine heart rate and rhythm
Cardiac axis - Normal if QRS complexes +ve in leads I and II
P-wave shape - Tall P waves denote right atrial enlargement
(P pulmonale) and notched P waves denote left atrial
enlargement (P mitrale)
PR interval - Normal = 0.12-0.20 secs. Prolongation denotes
impaired AV nodal conduction. A short PR interval occurs in
Wolff-Parkinson-White syndrome
QRS duration - If > 0.12 secs then ventricular conduction is
abnormal (left or right bundle branch block)
55. QRS amplitude - Large QRS complexes occur in slim
young patients and in patients with left ventricular
hypertrophy
Q waves - May signify previous myocardial infarction (MI)
ST segment - ST elevation may signify MI, pericarditis or
left ventricular aneurysm; ST depression may signify
myocardial ischaemia or infarction)
T waves - T-wave inversion has many causes, including
myocardial ischaemia or infarction, and electrolyte
disturbances
QT interval - Normal < 0.42 secs. QT prolongation may
occur with congenital long QT syndrome, low K+
, Mg2+
or
Ca2+
, and some drugs
67. Left Bundle Branch Block
Monophasic R wave in I and V6, QRS > 0.12 sec
Loss of R wave in precordial leads
QRS T wave discordance I, V1, V6
Consider cardiac ischemia if a new finding
68. Right Bundle Branch Block
V1: RSR prime pattern with inverted T wave
V6: Wide deep slurred S wave
69. First Degree Heart Block, Mobitz Type I (Wenckebach)
PR progressively lengthens until QRS drops
71. Right Ventricular Myocardial Infarction
Found in 1/3 of patients with inferior MI
Increased morbidity and mortality
ST elevation in V4-V6 of Right-sided EKG