Downloaded 212 times


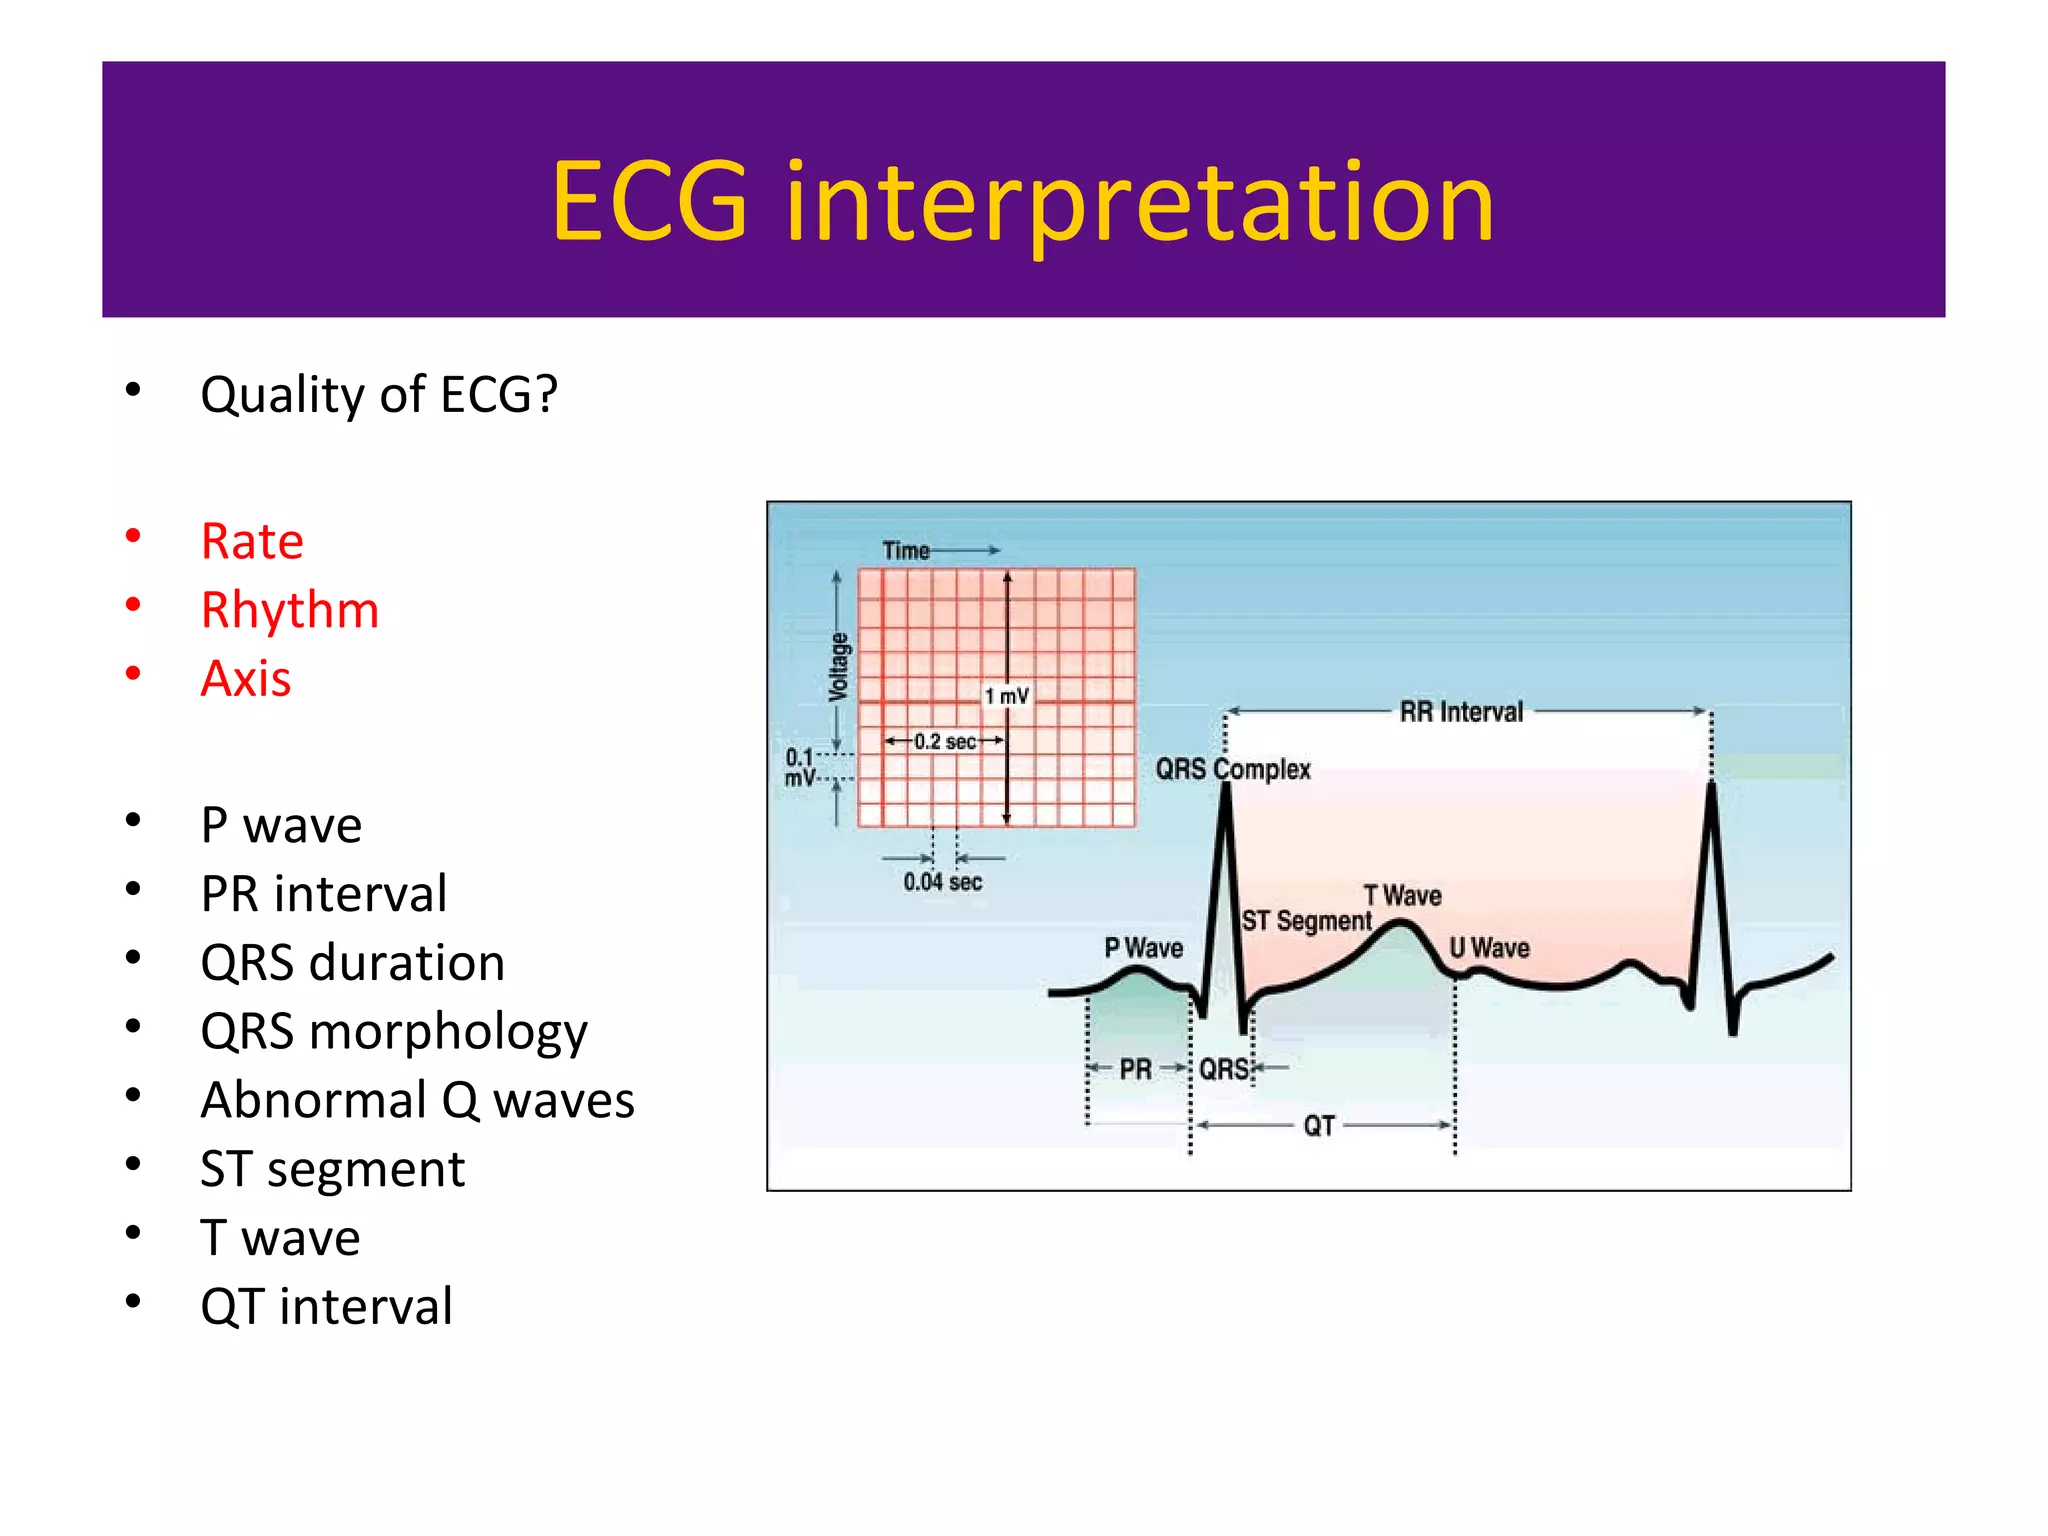
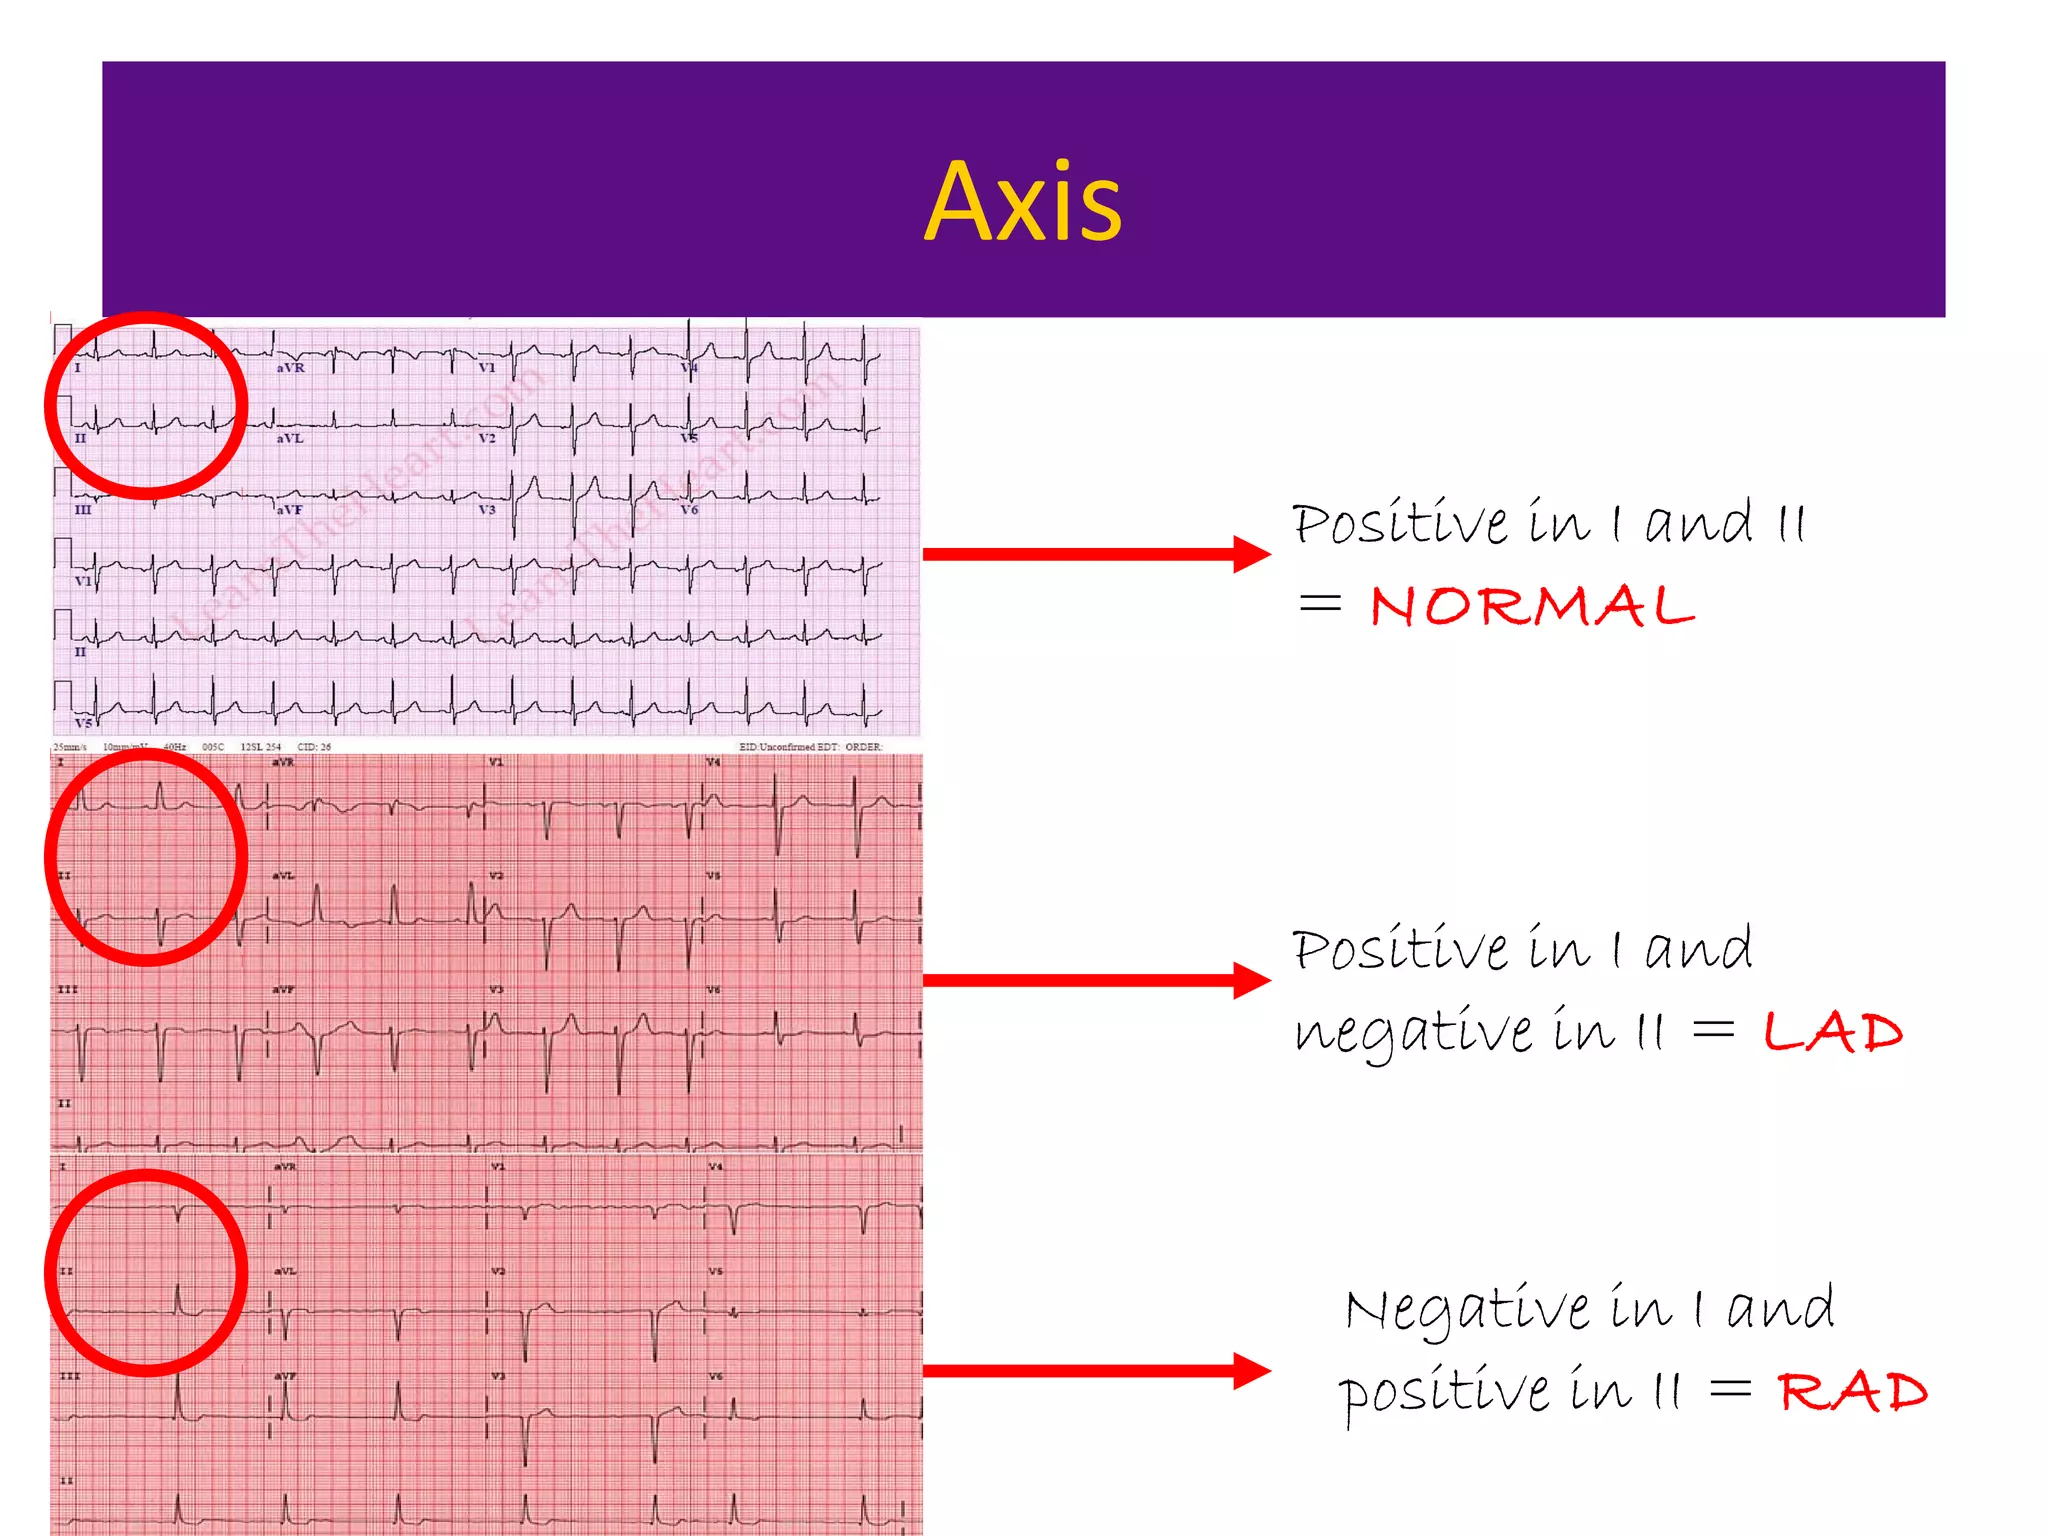
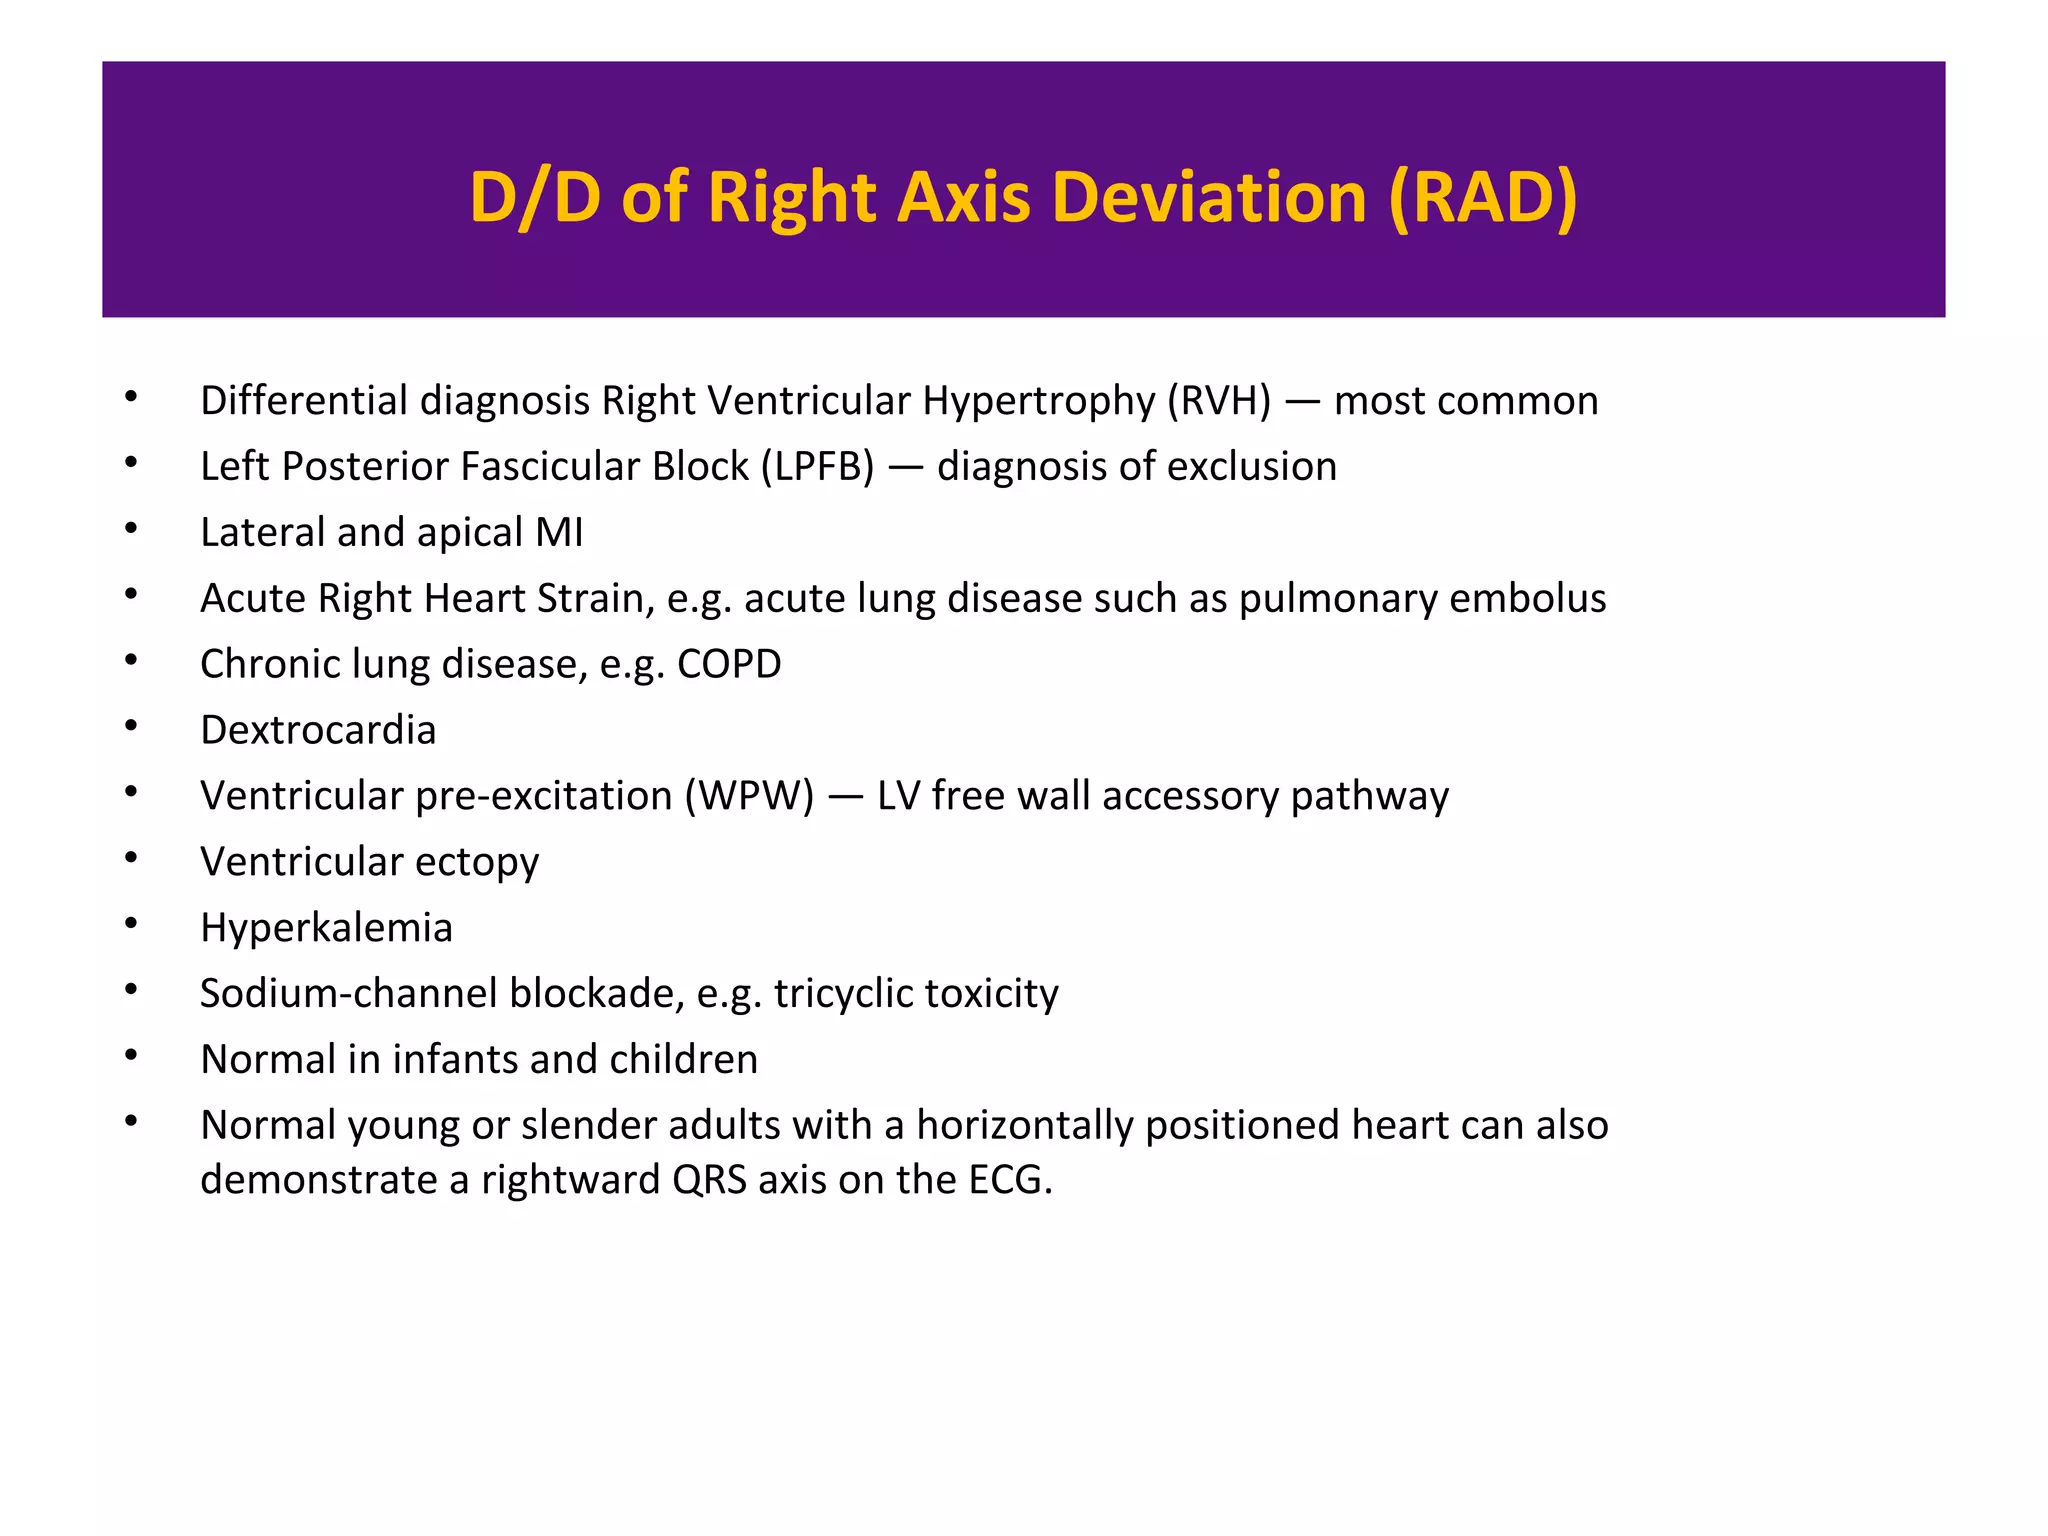
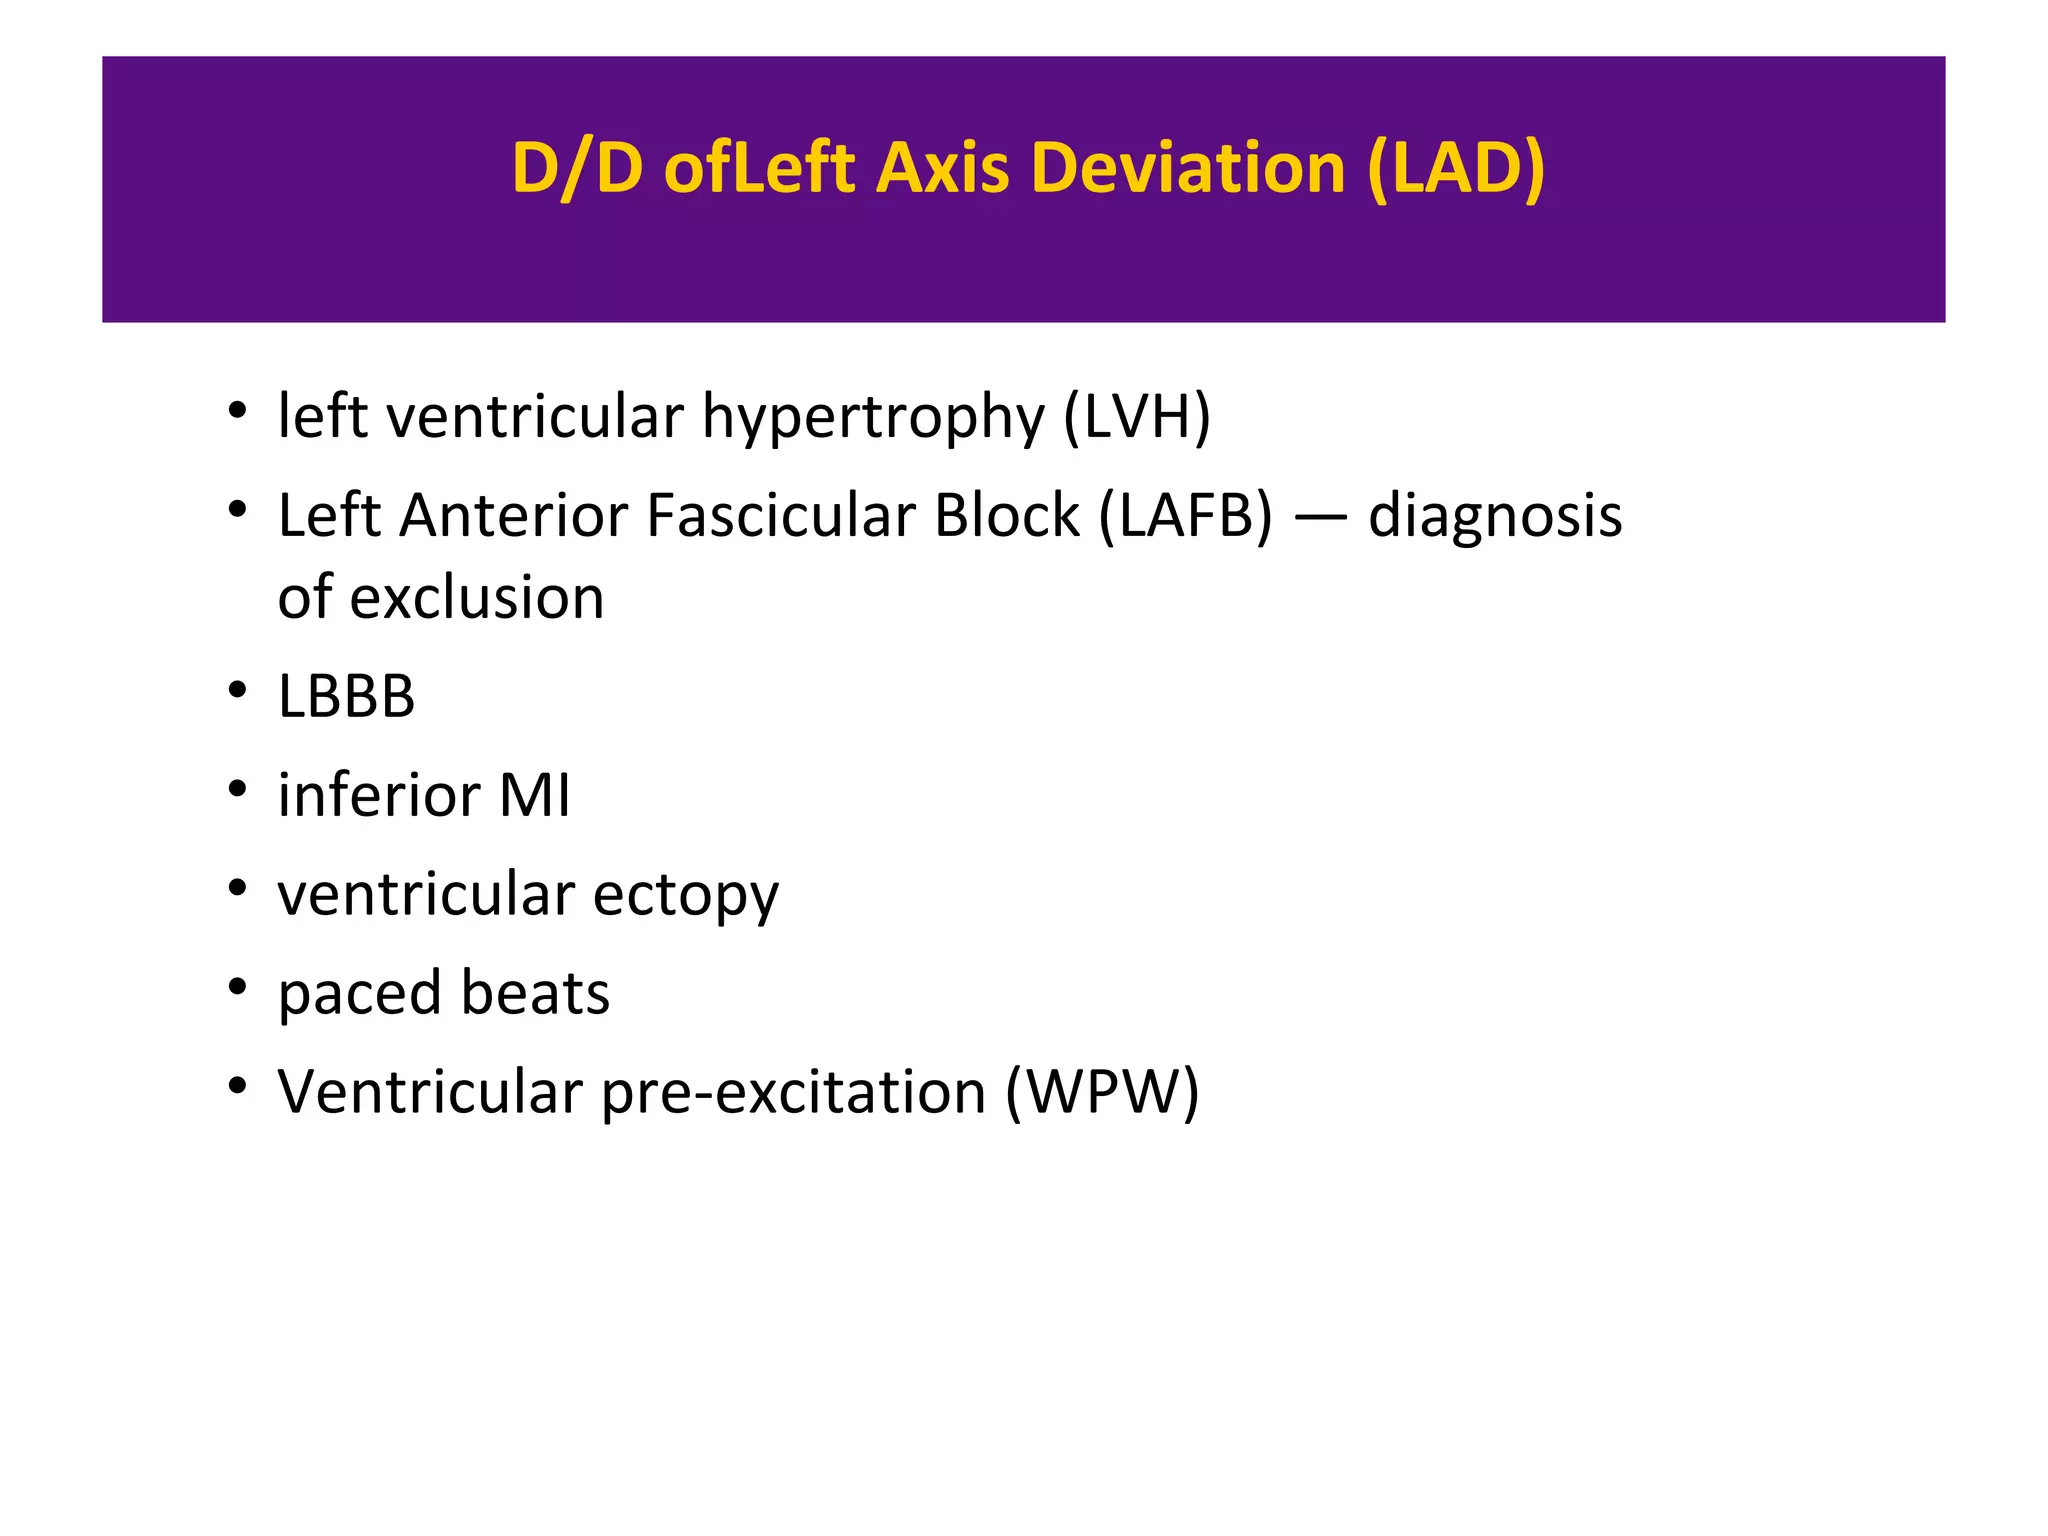
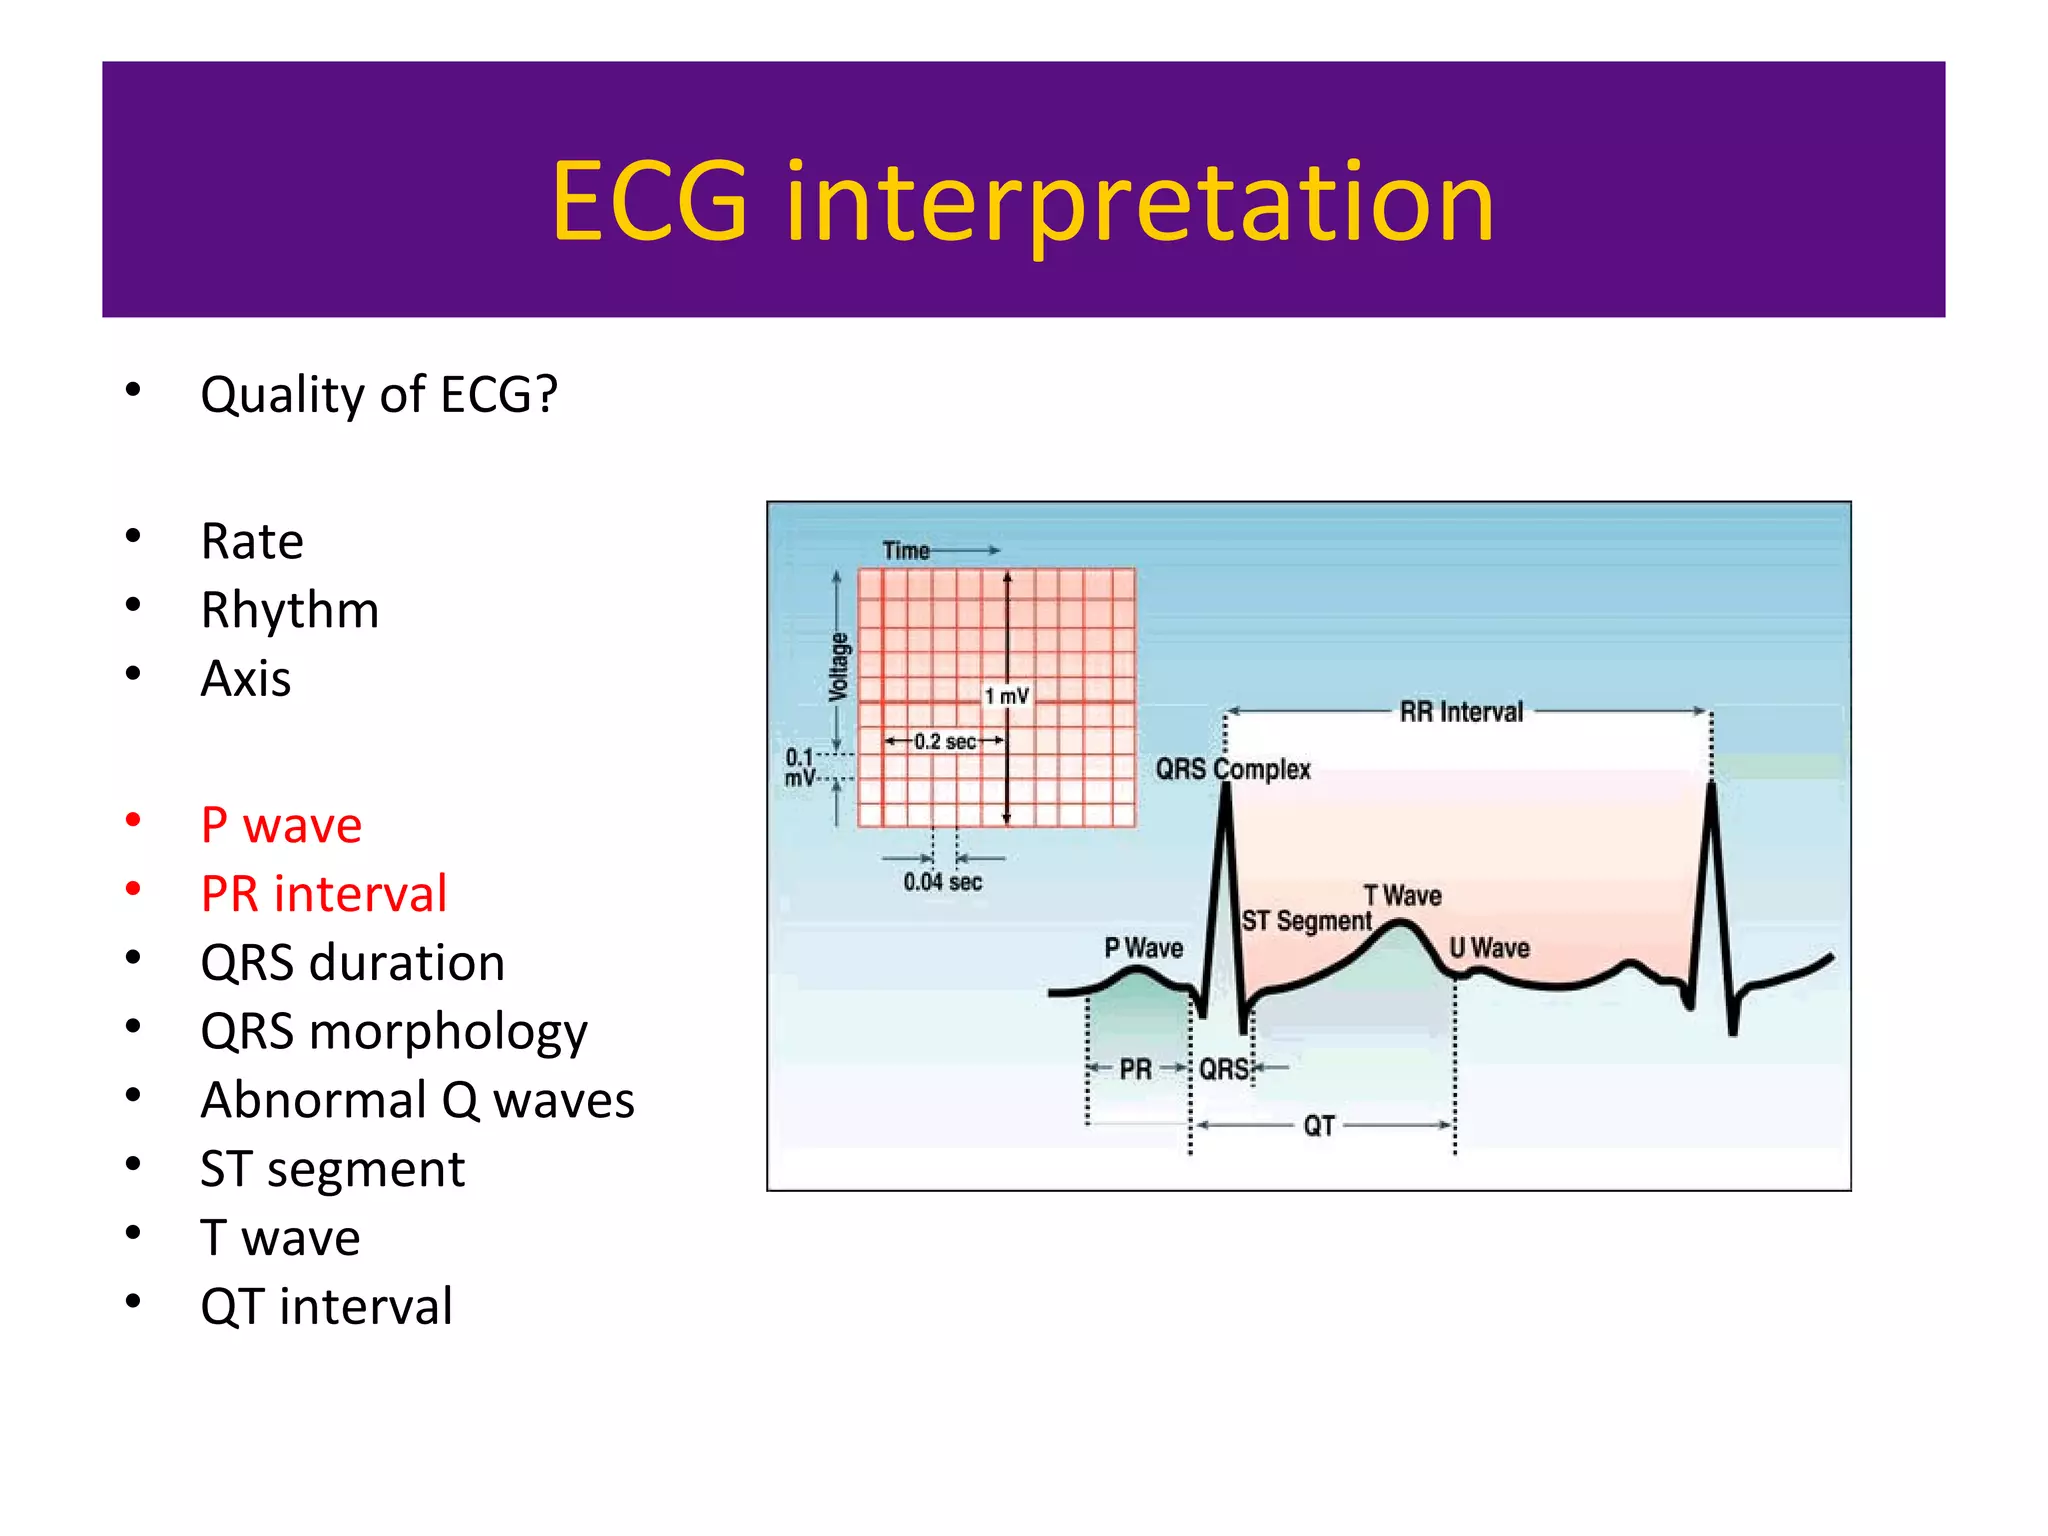
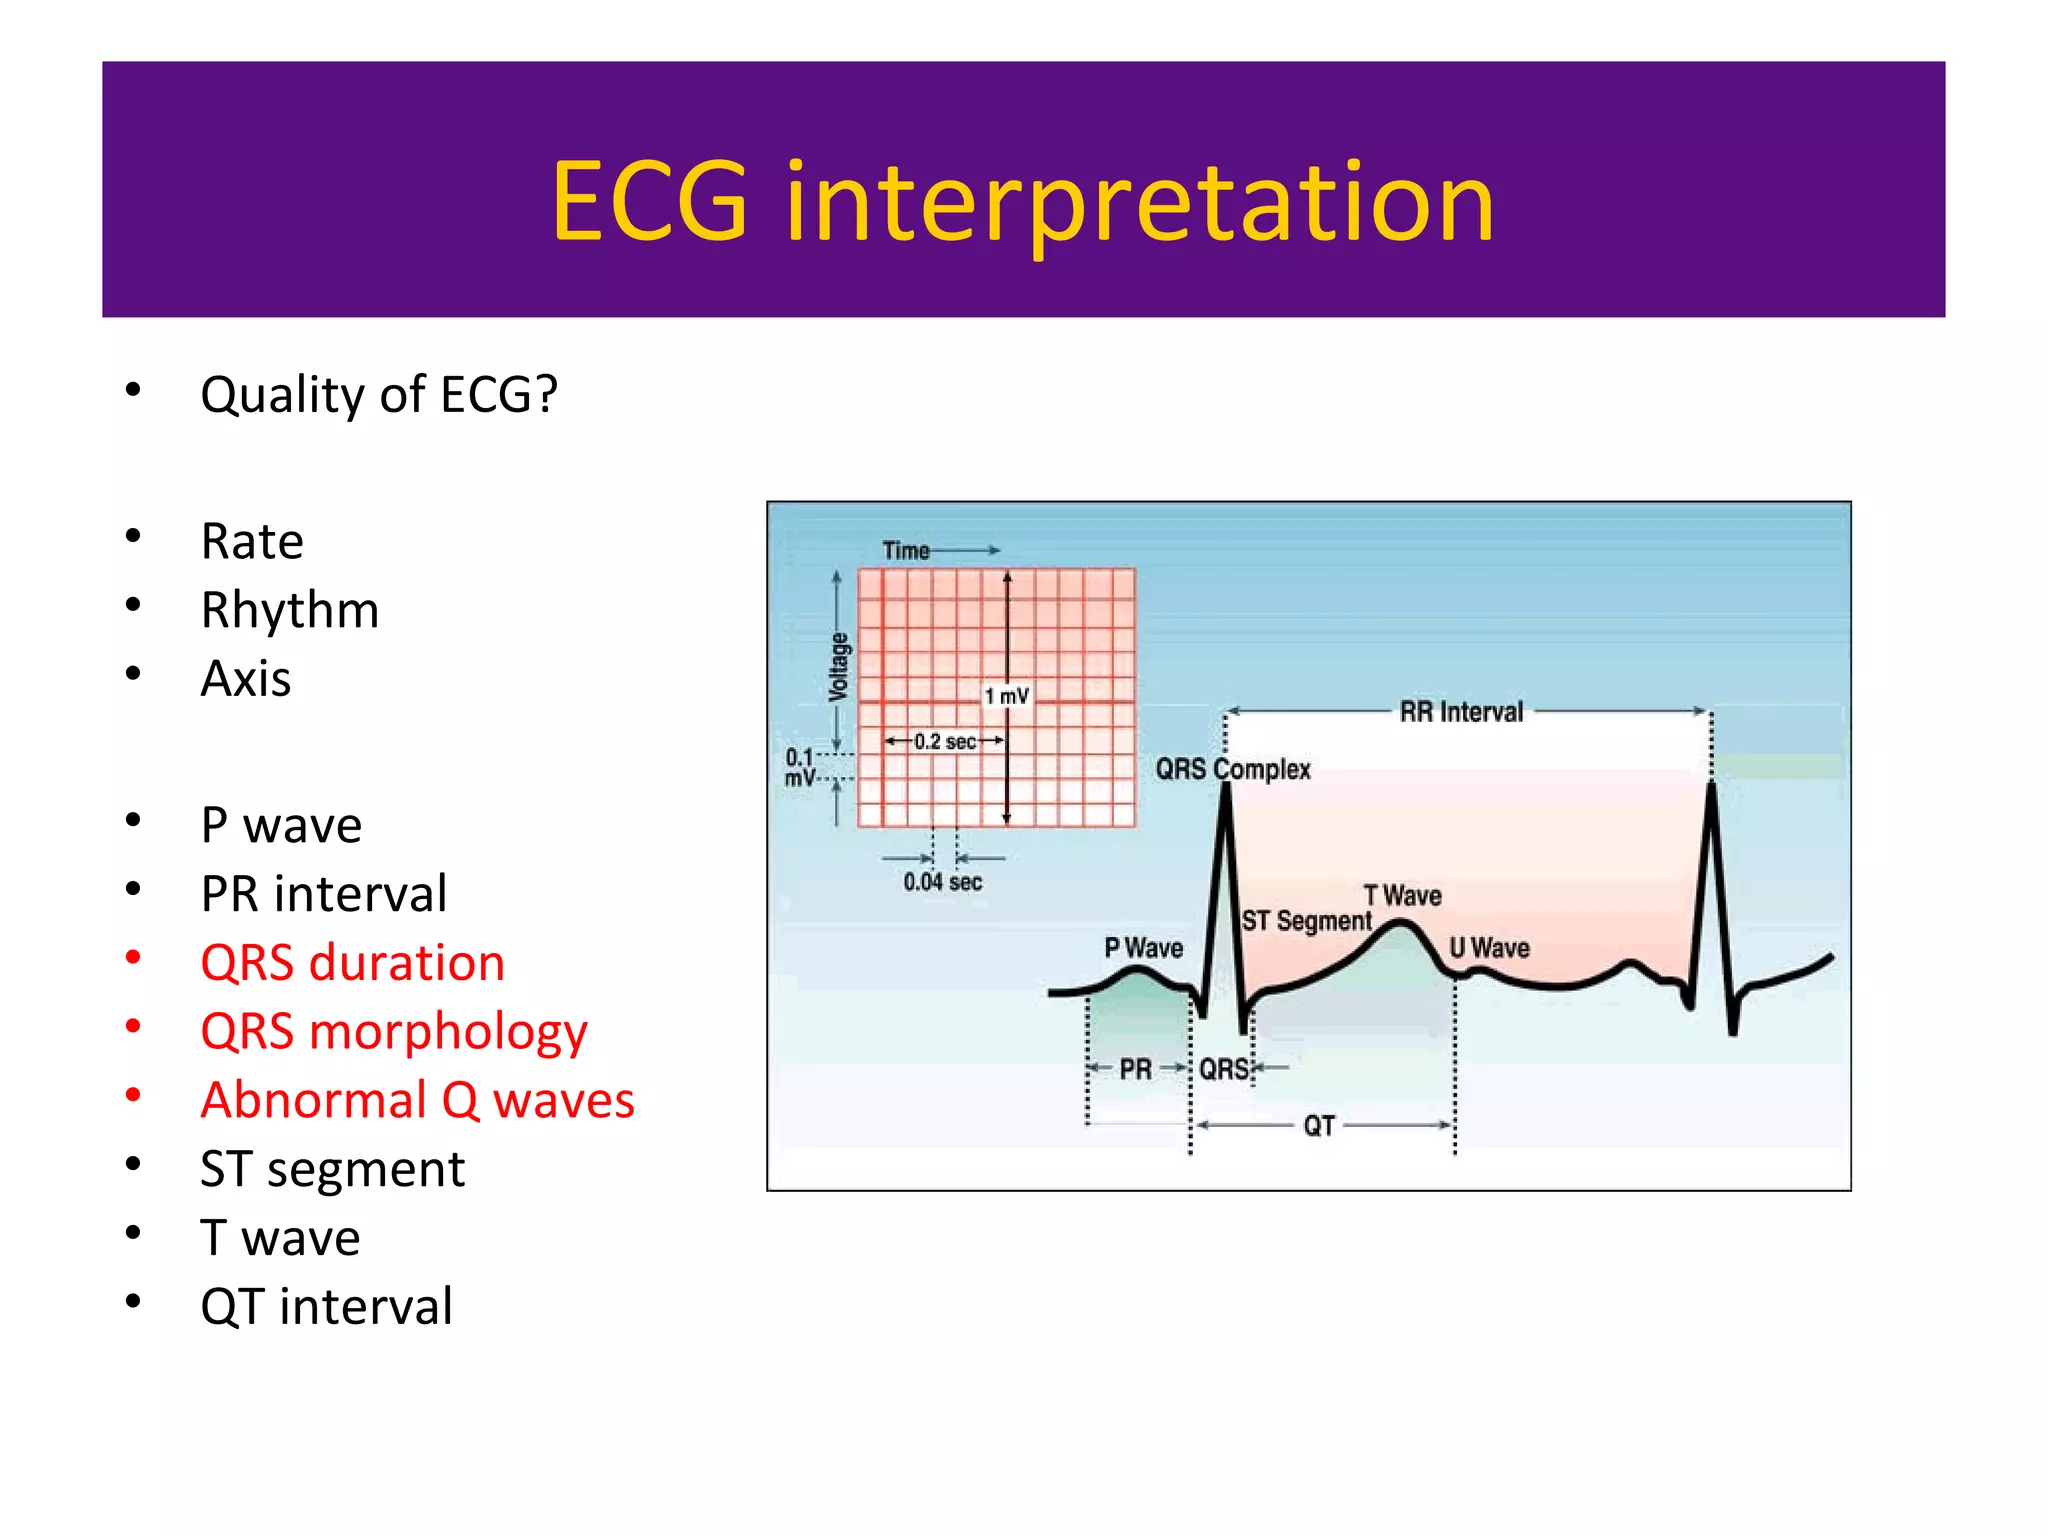
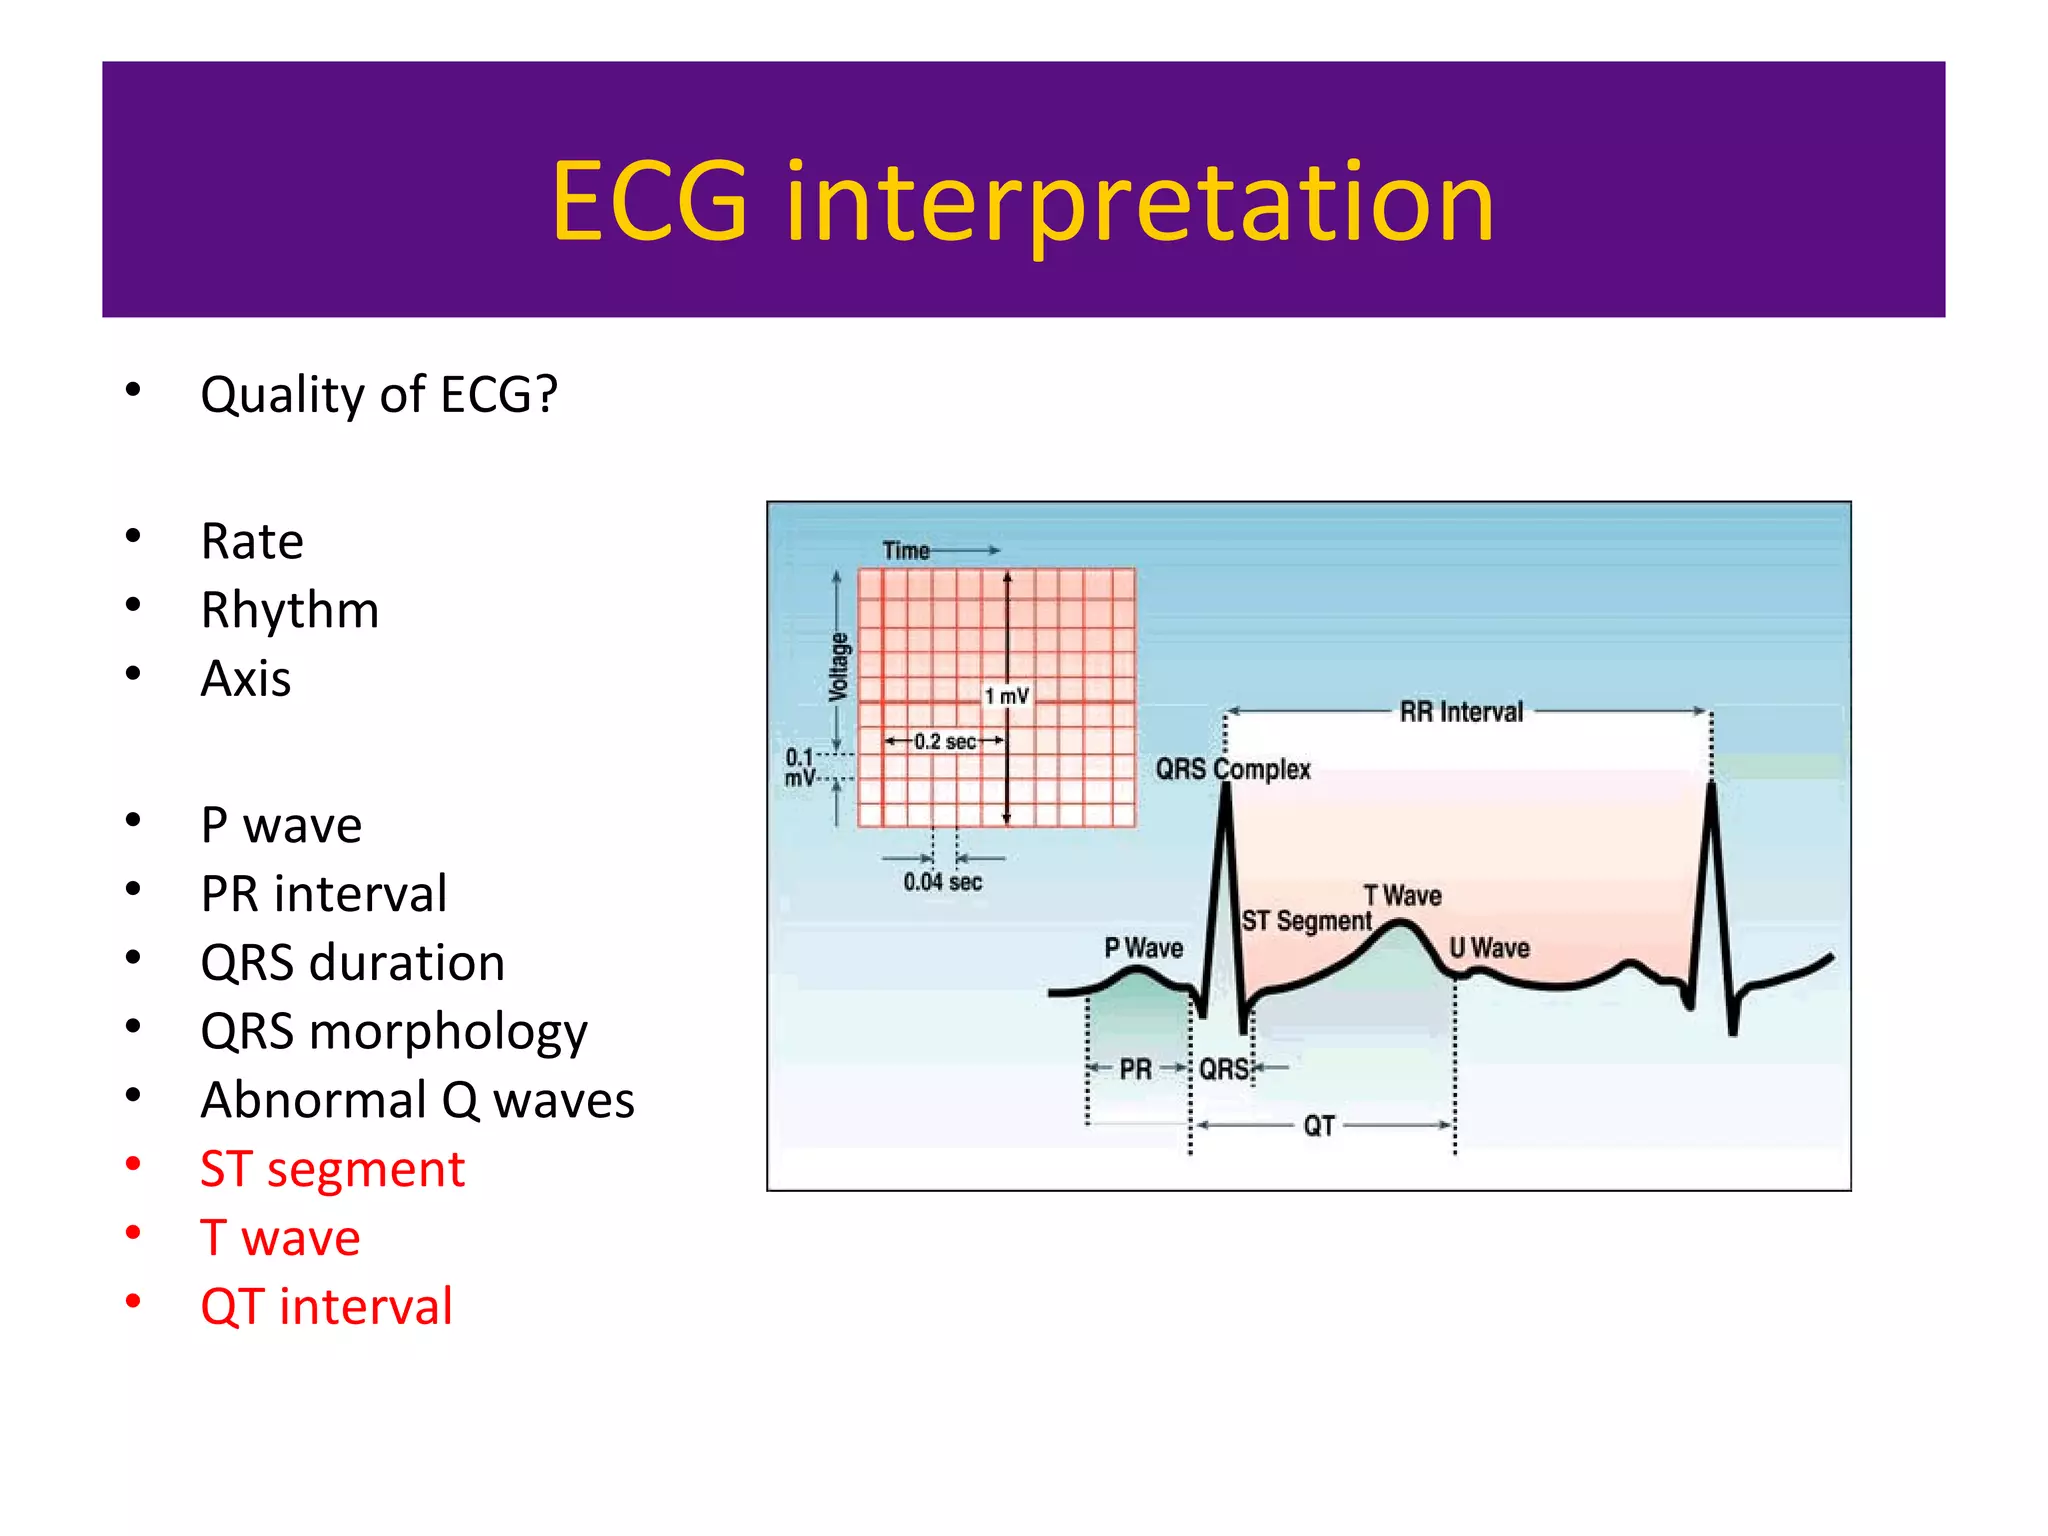
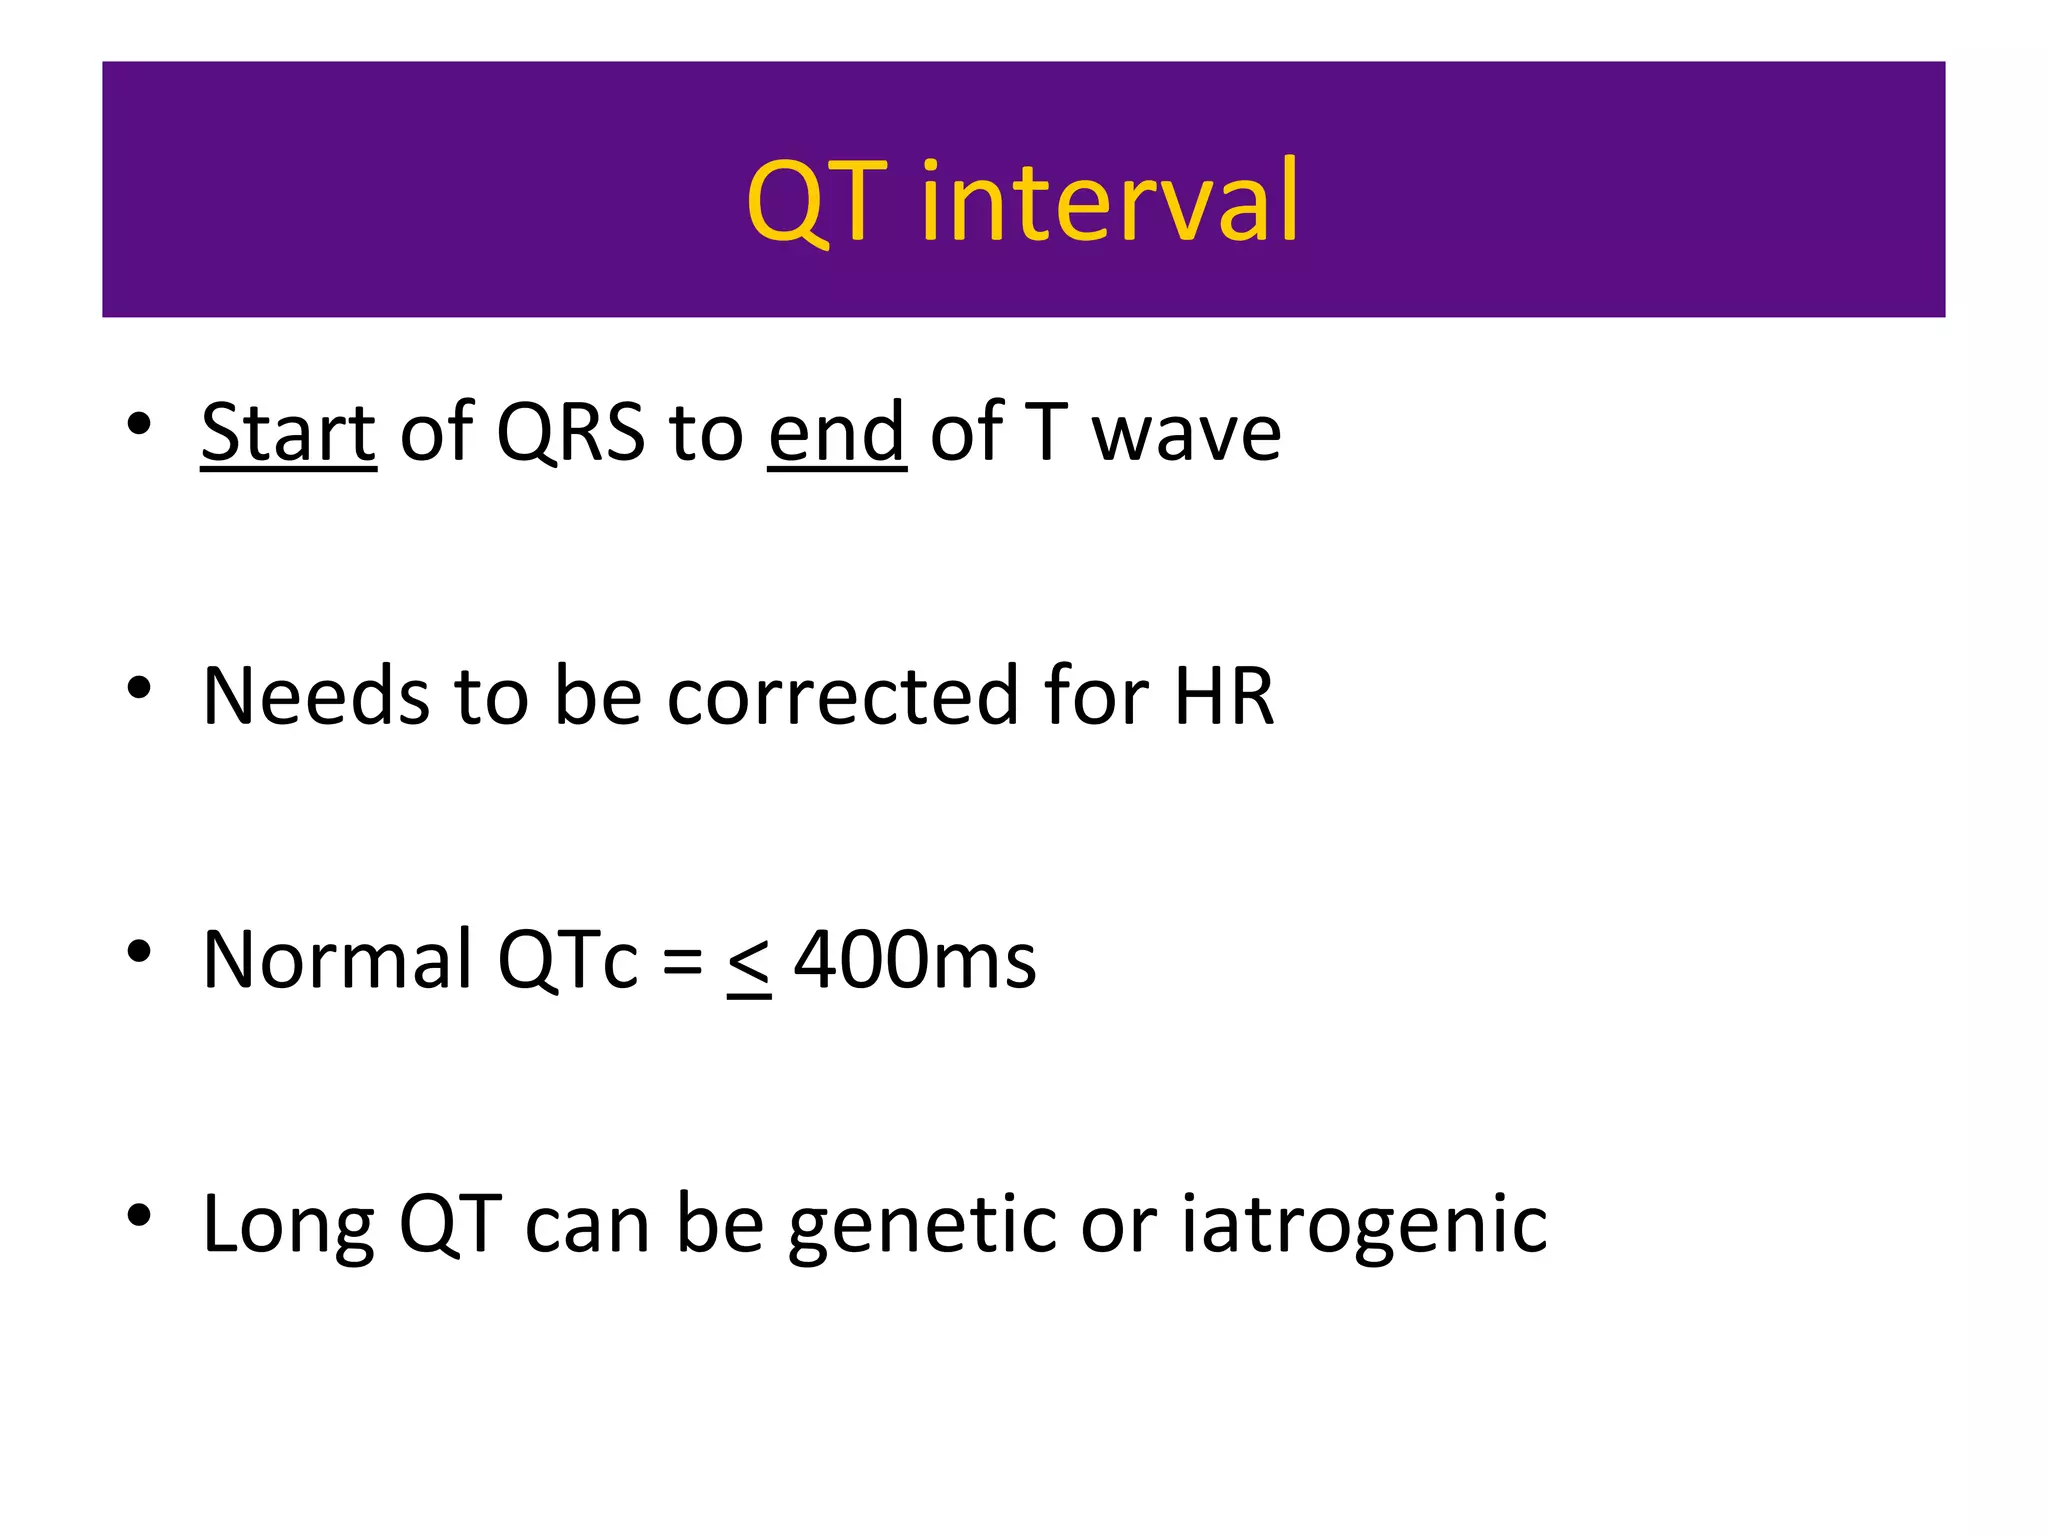
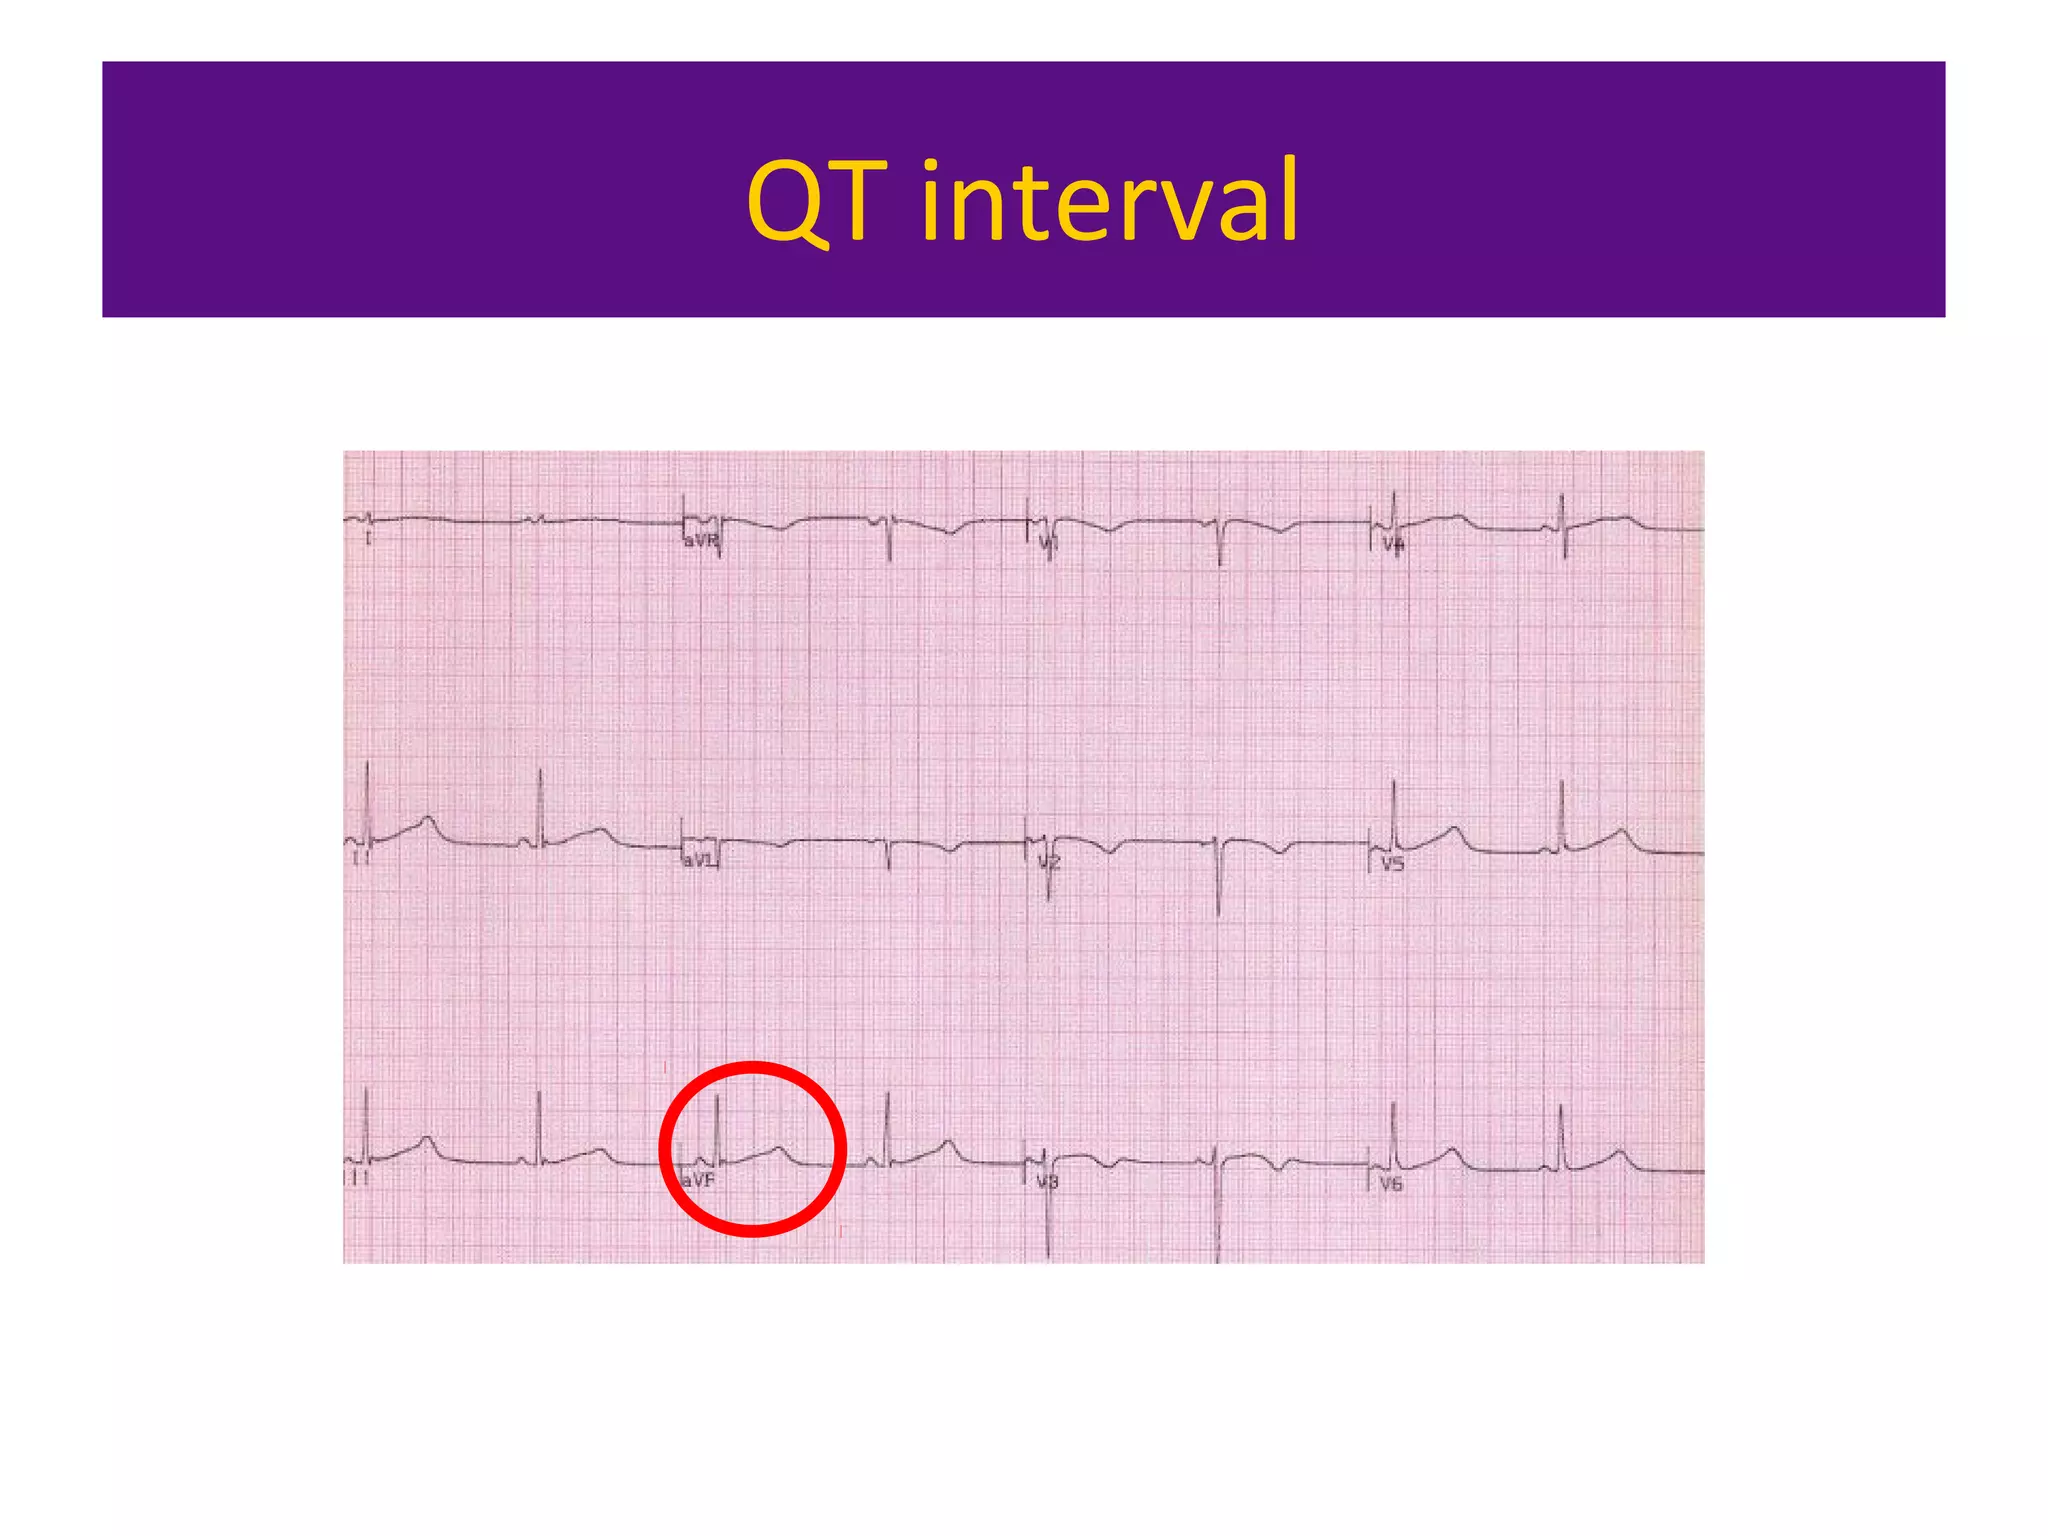

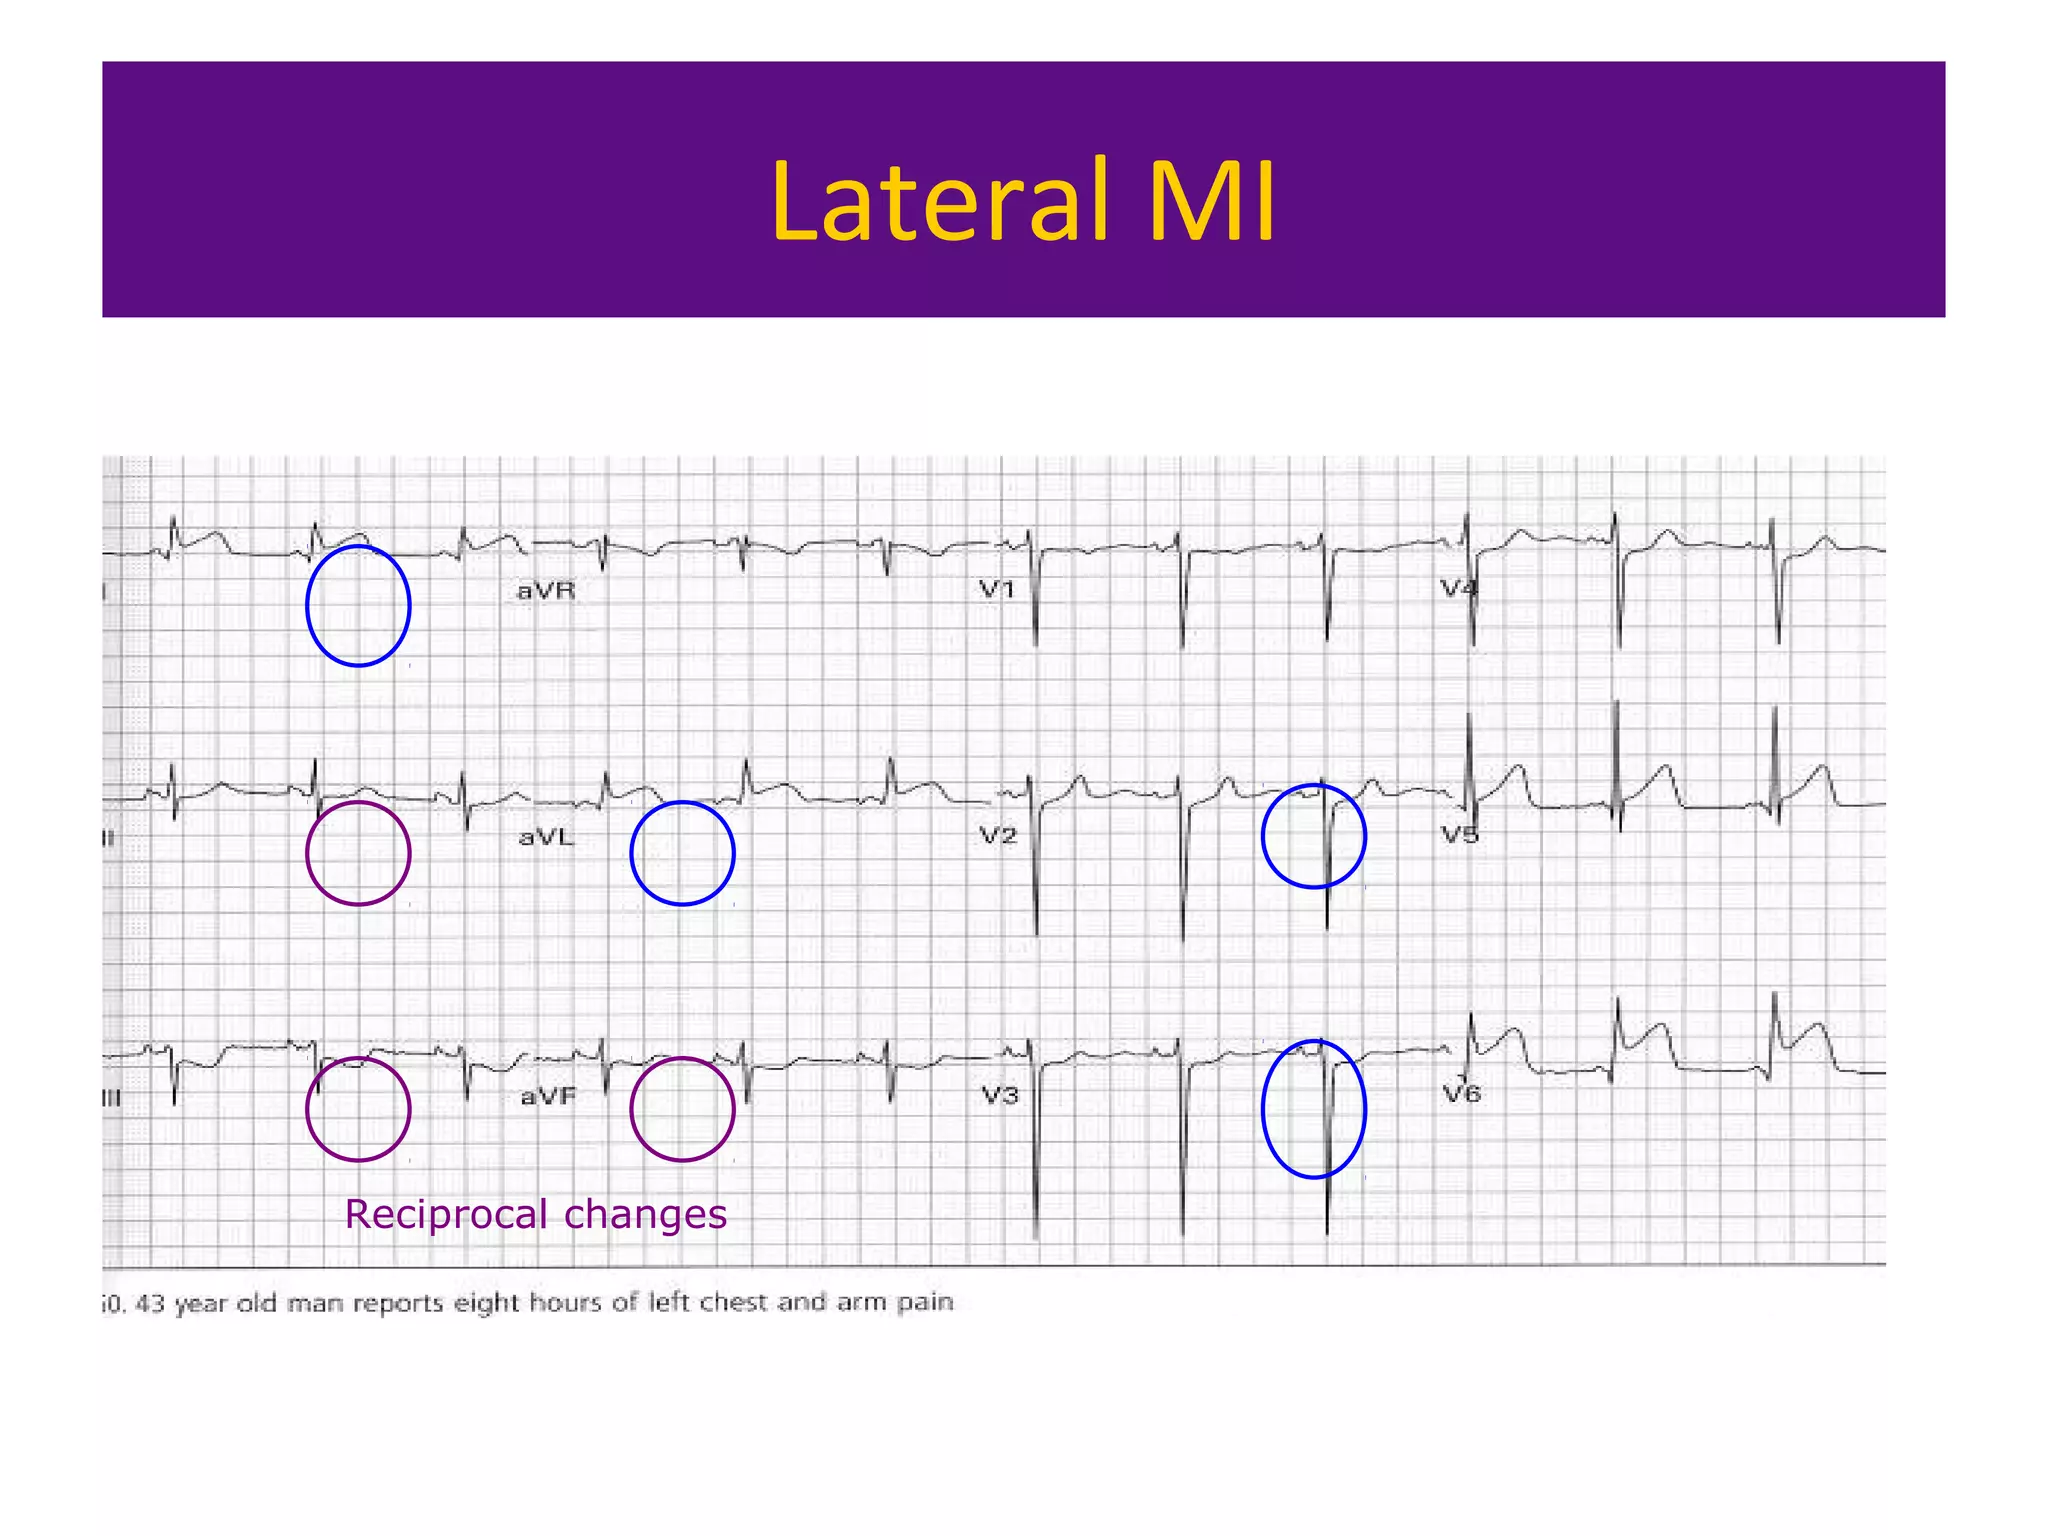
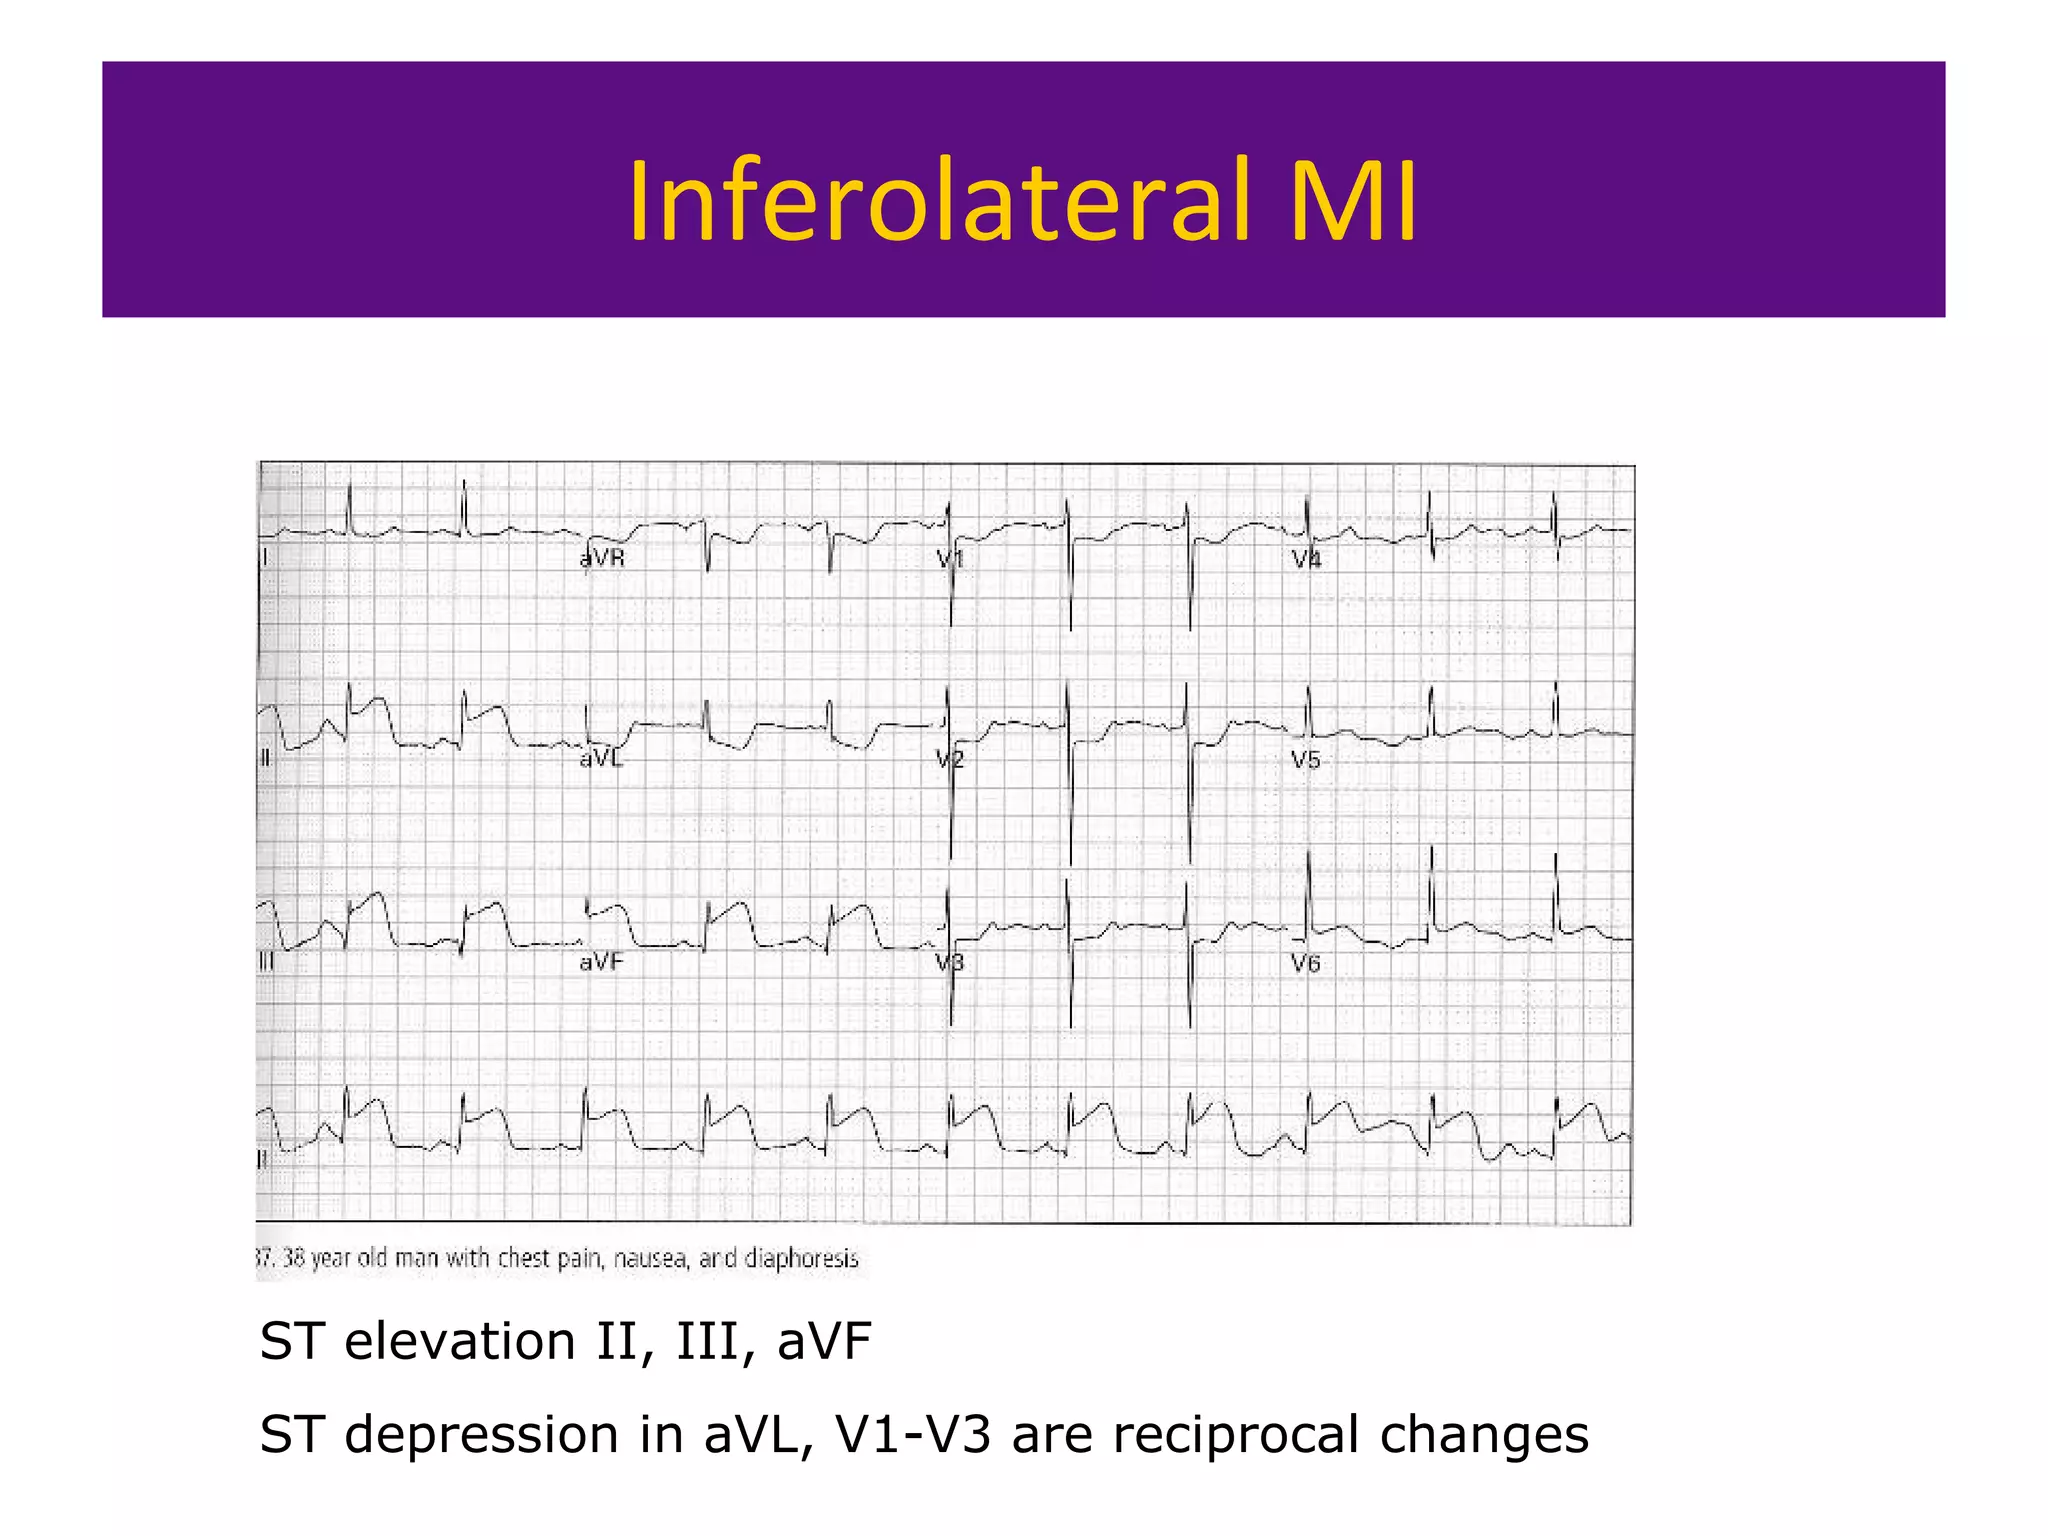
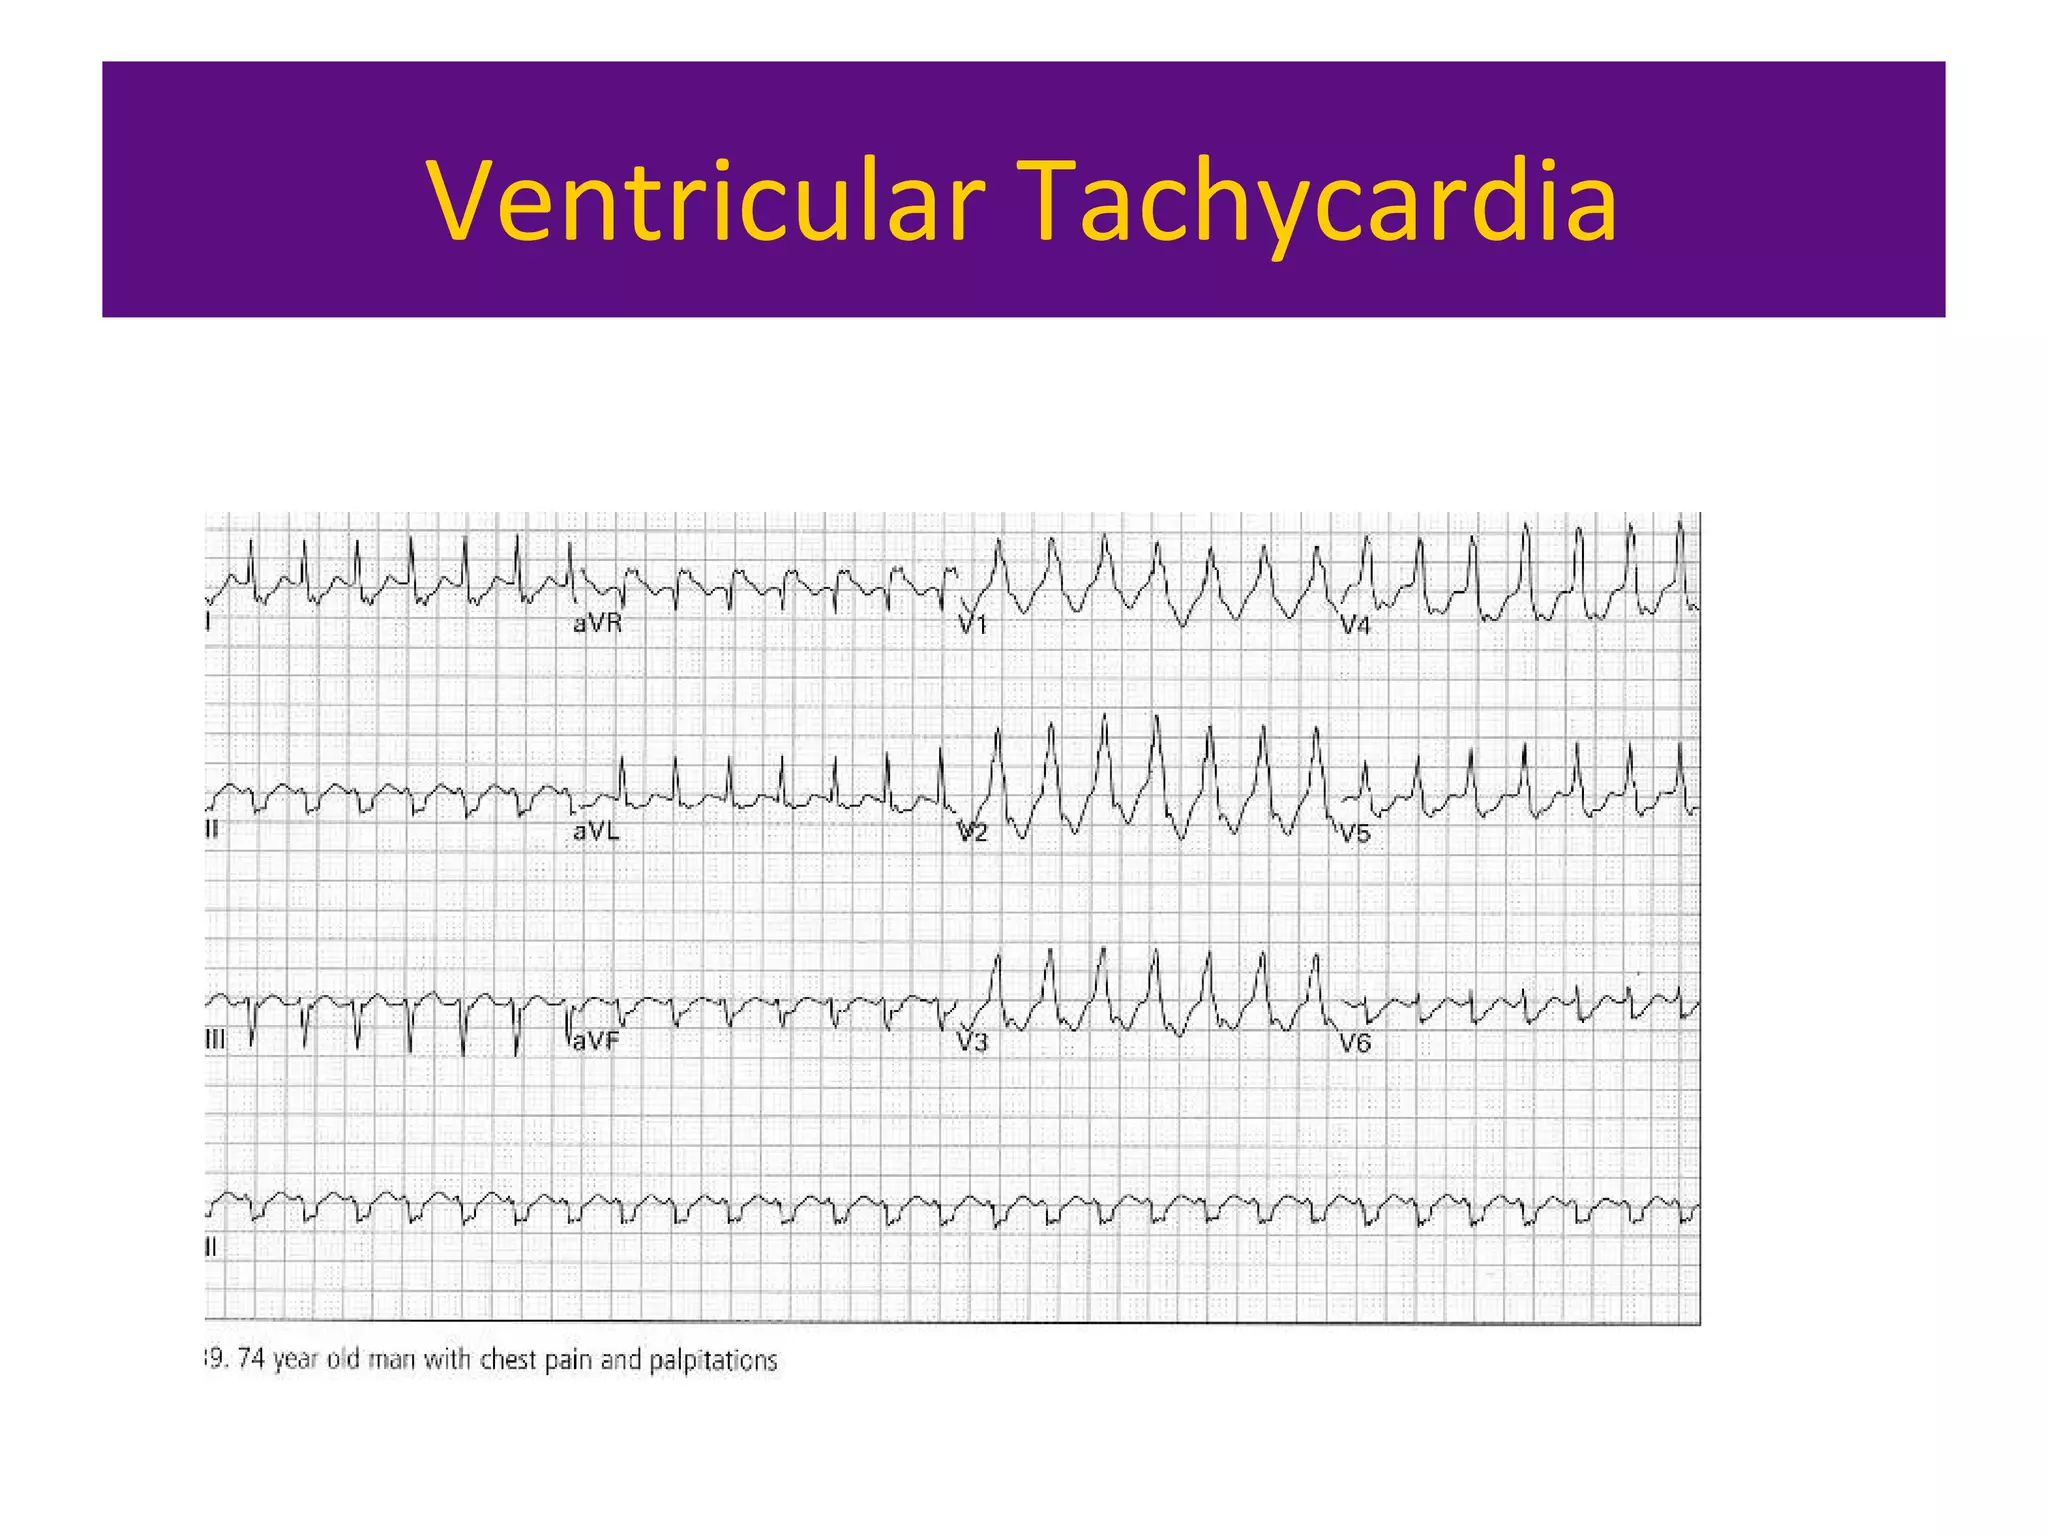
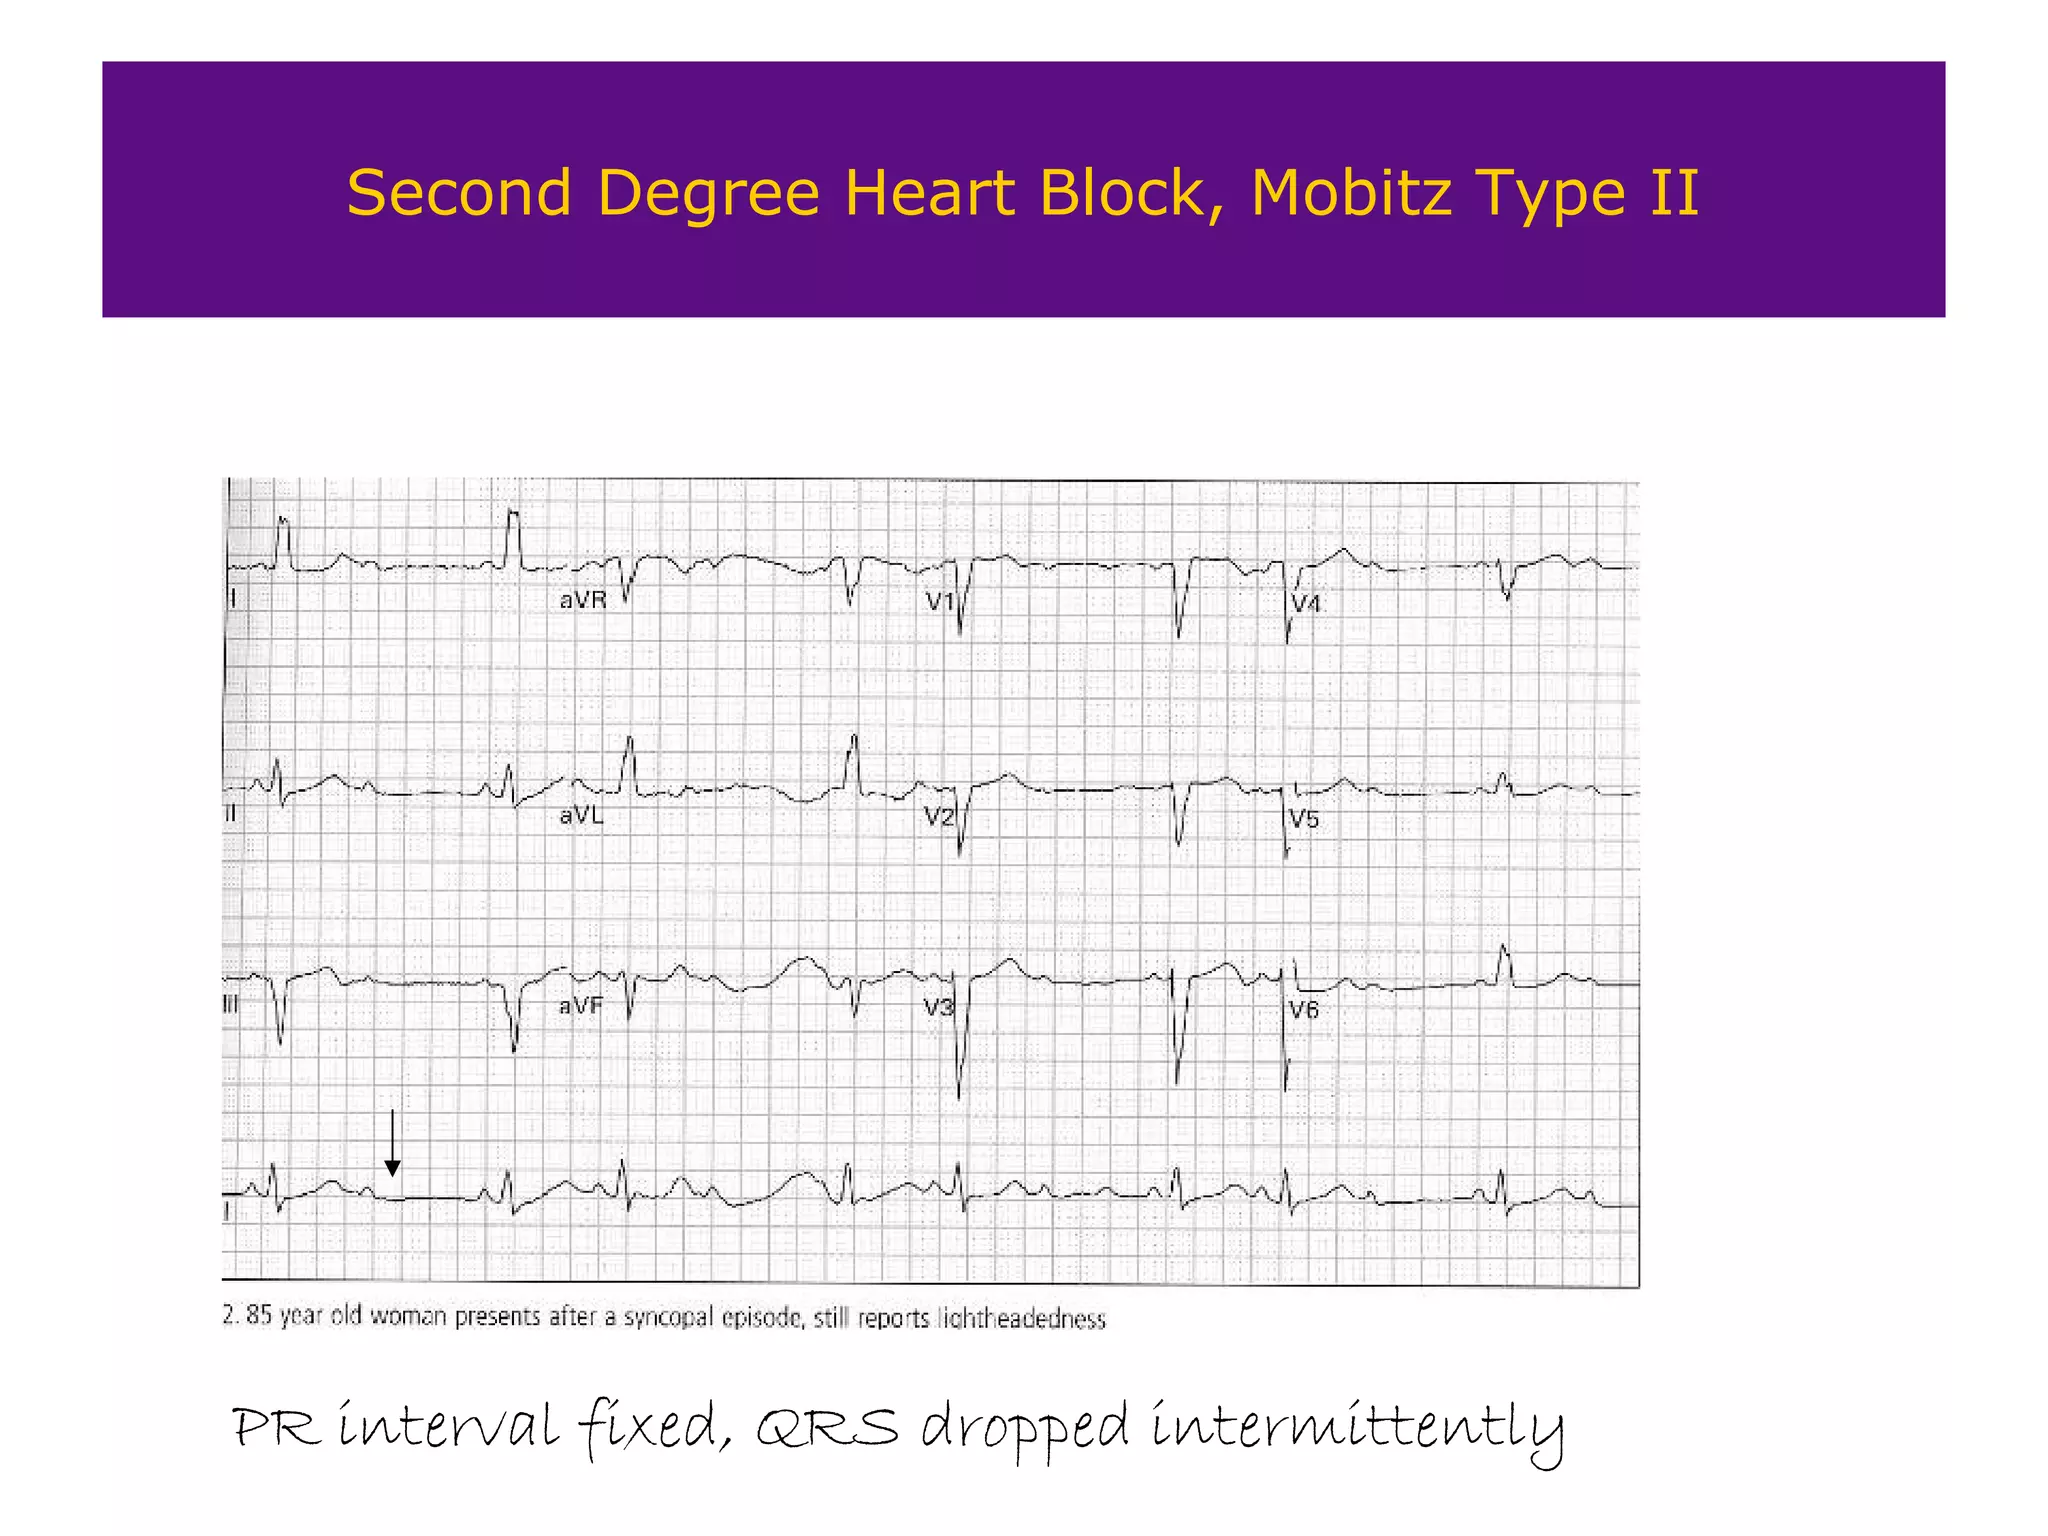
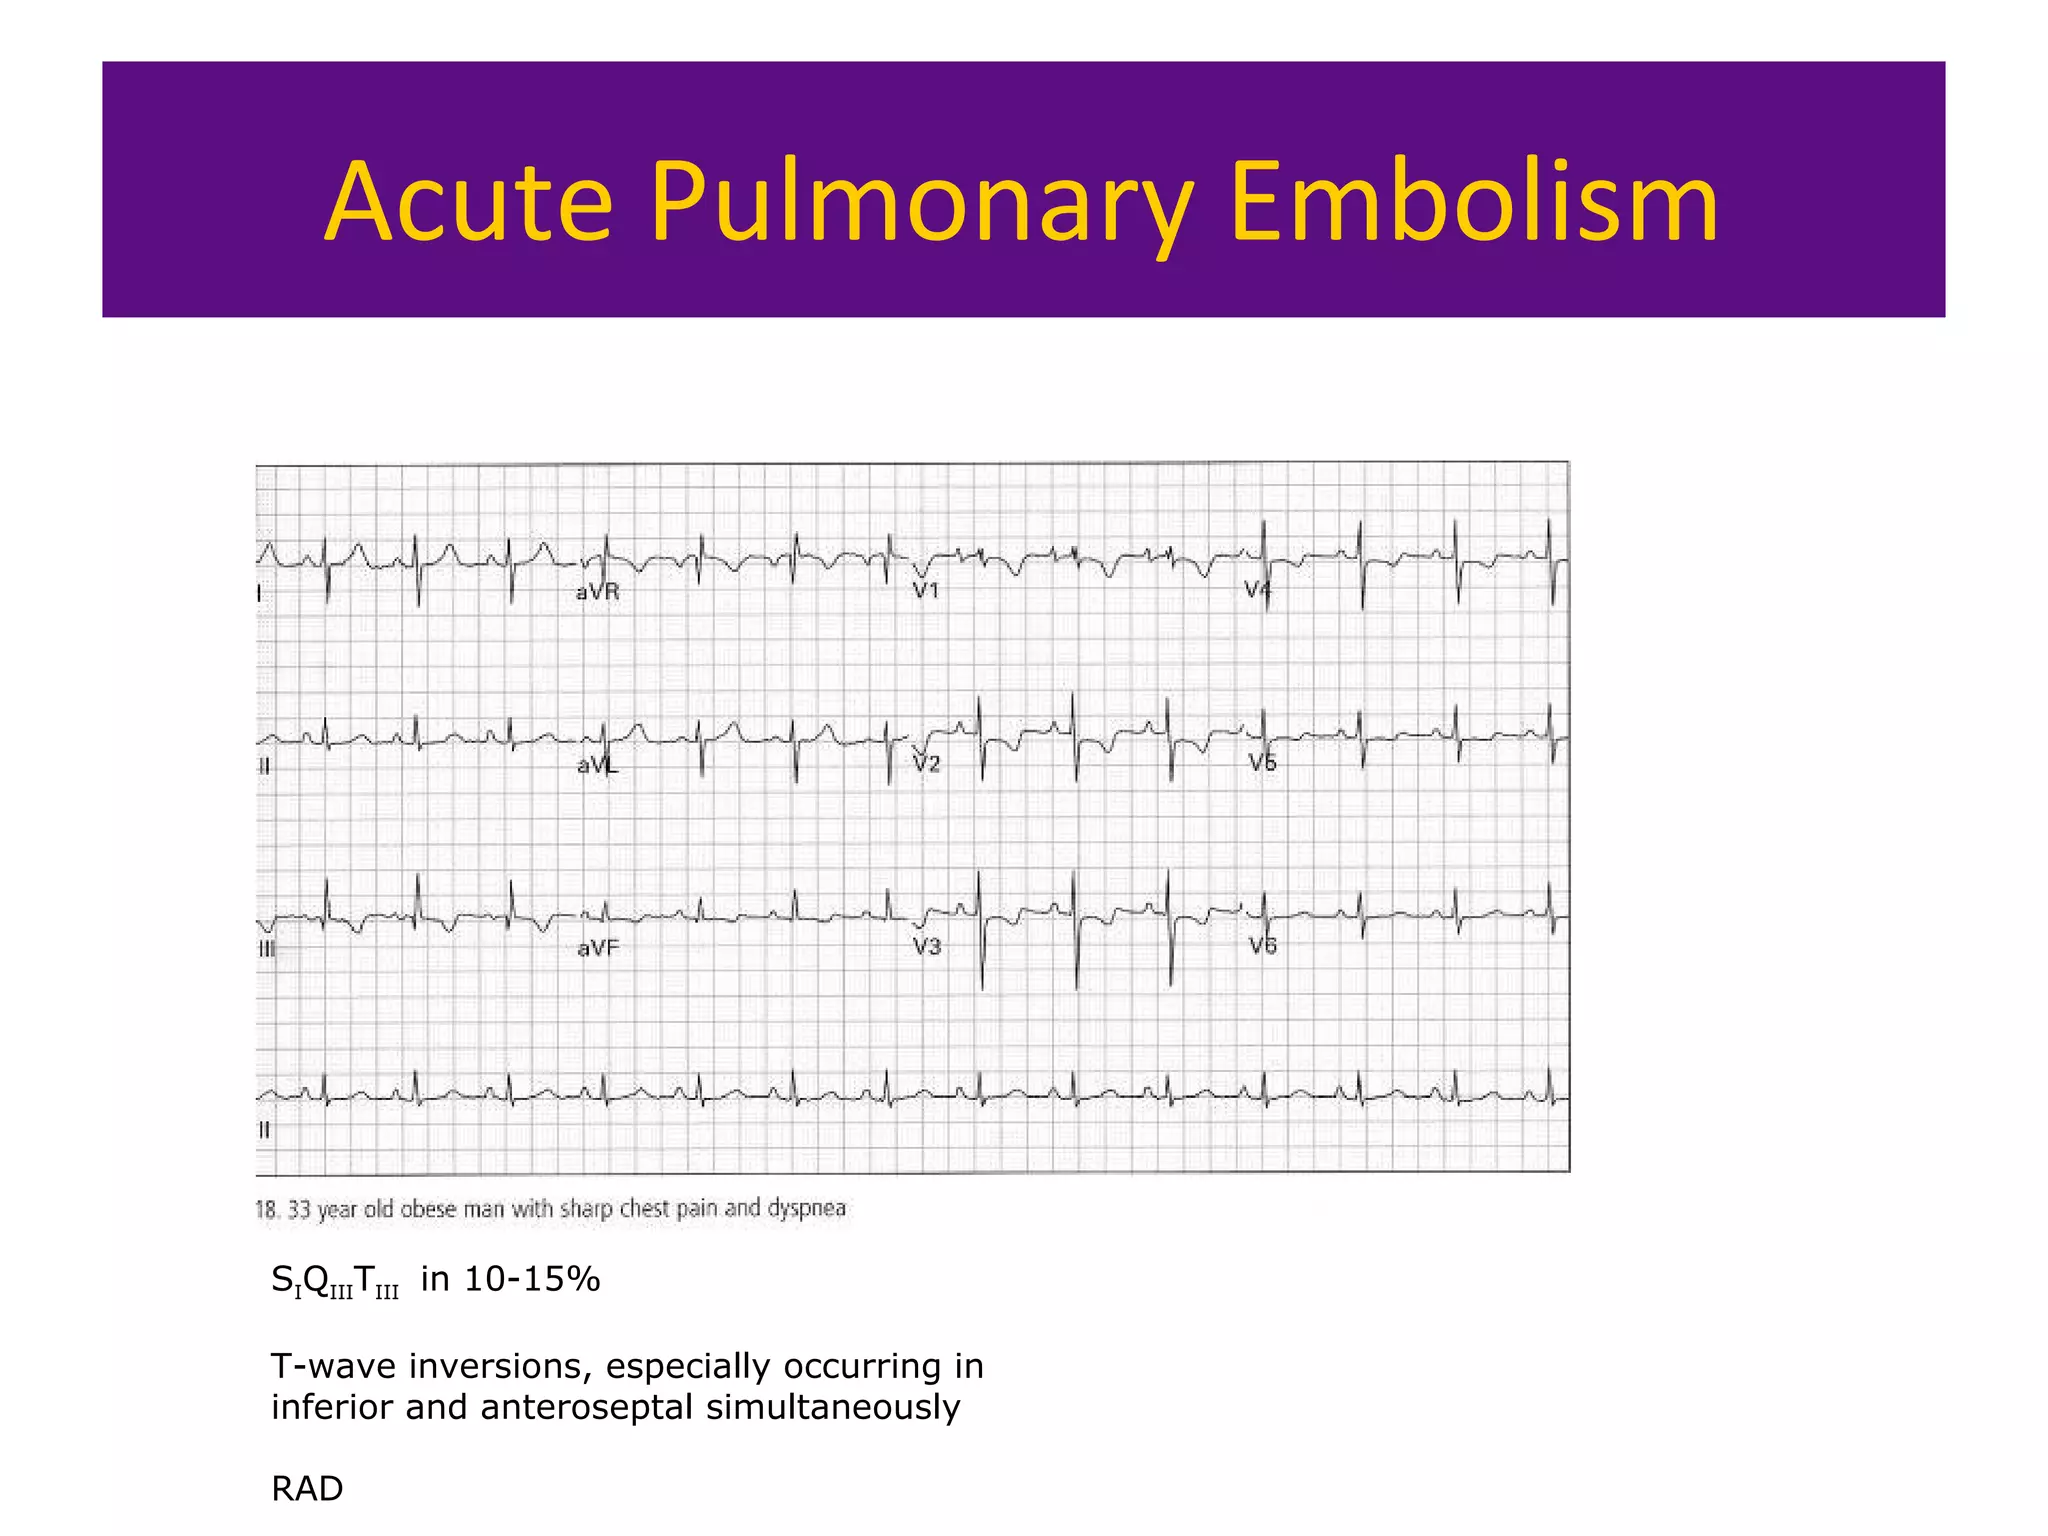
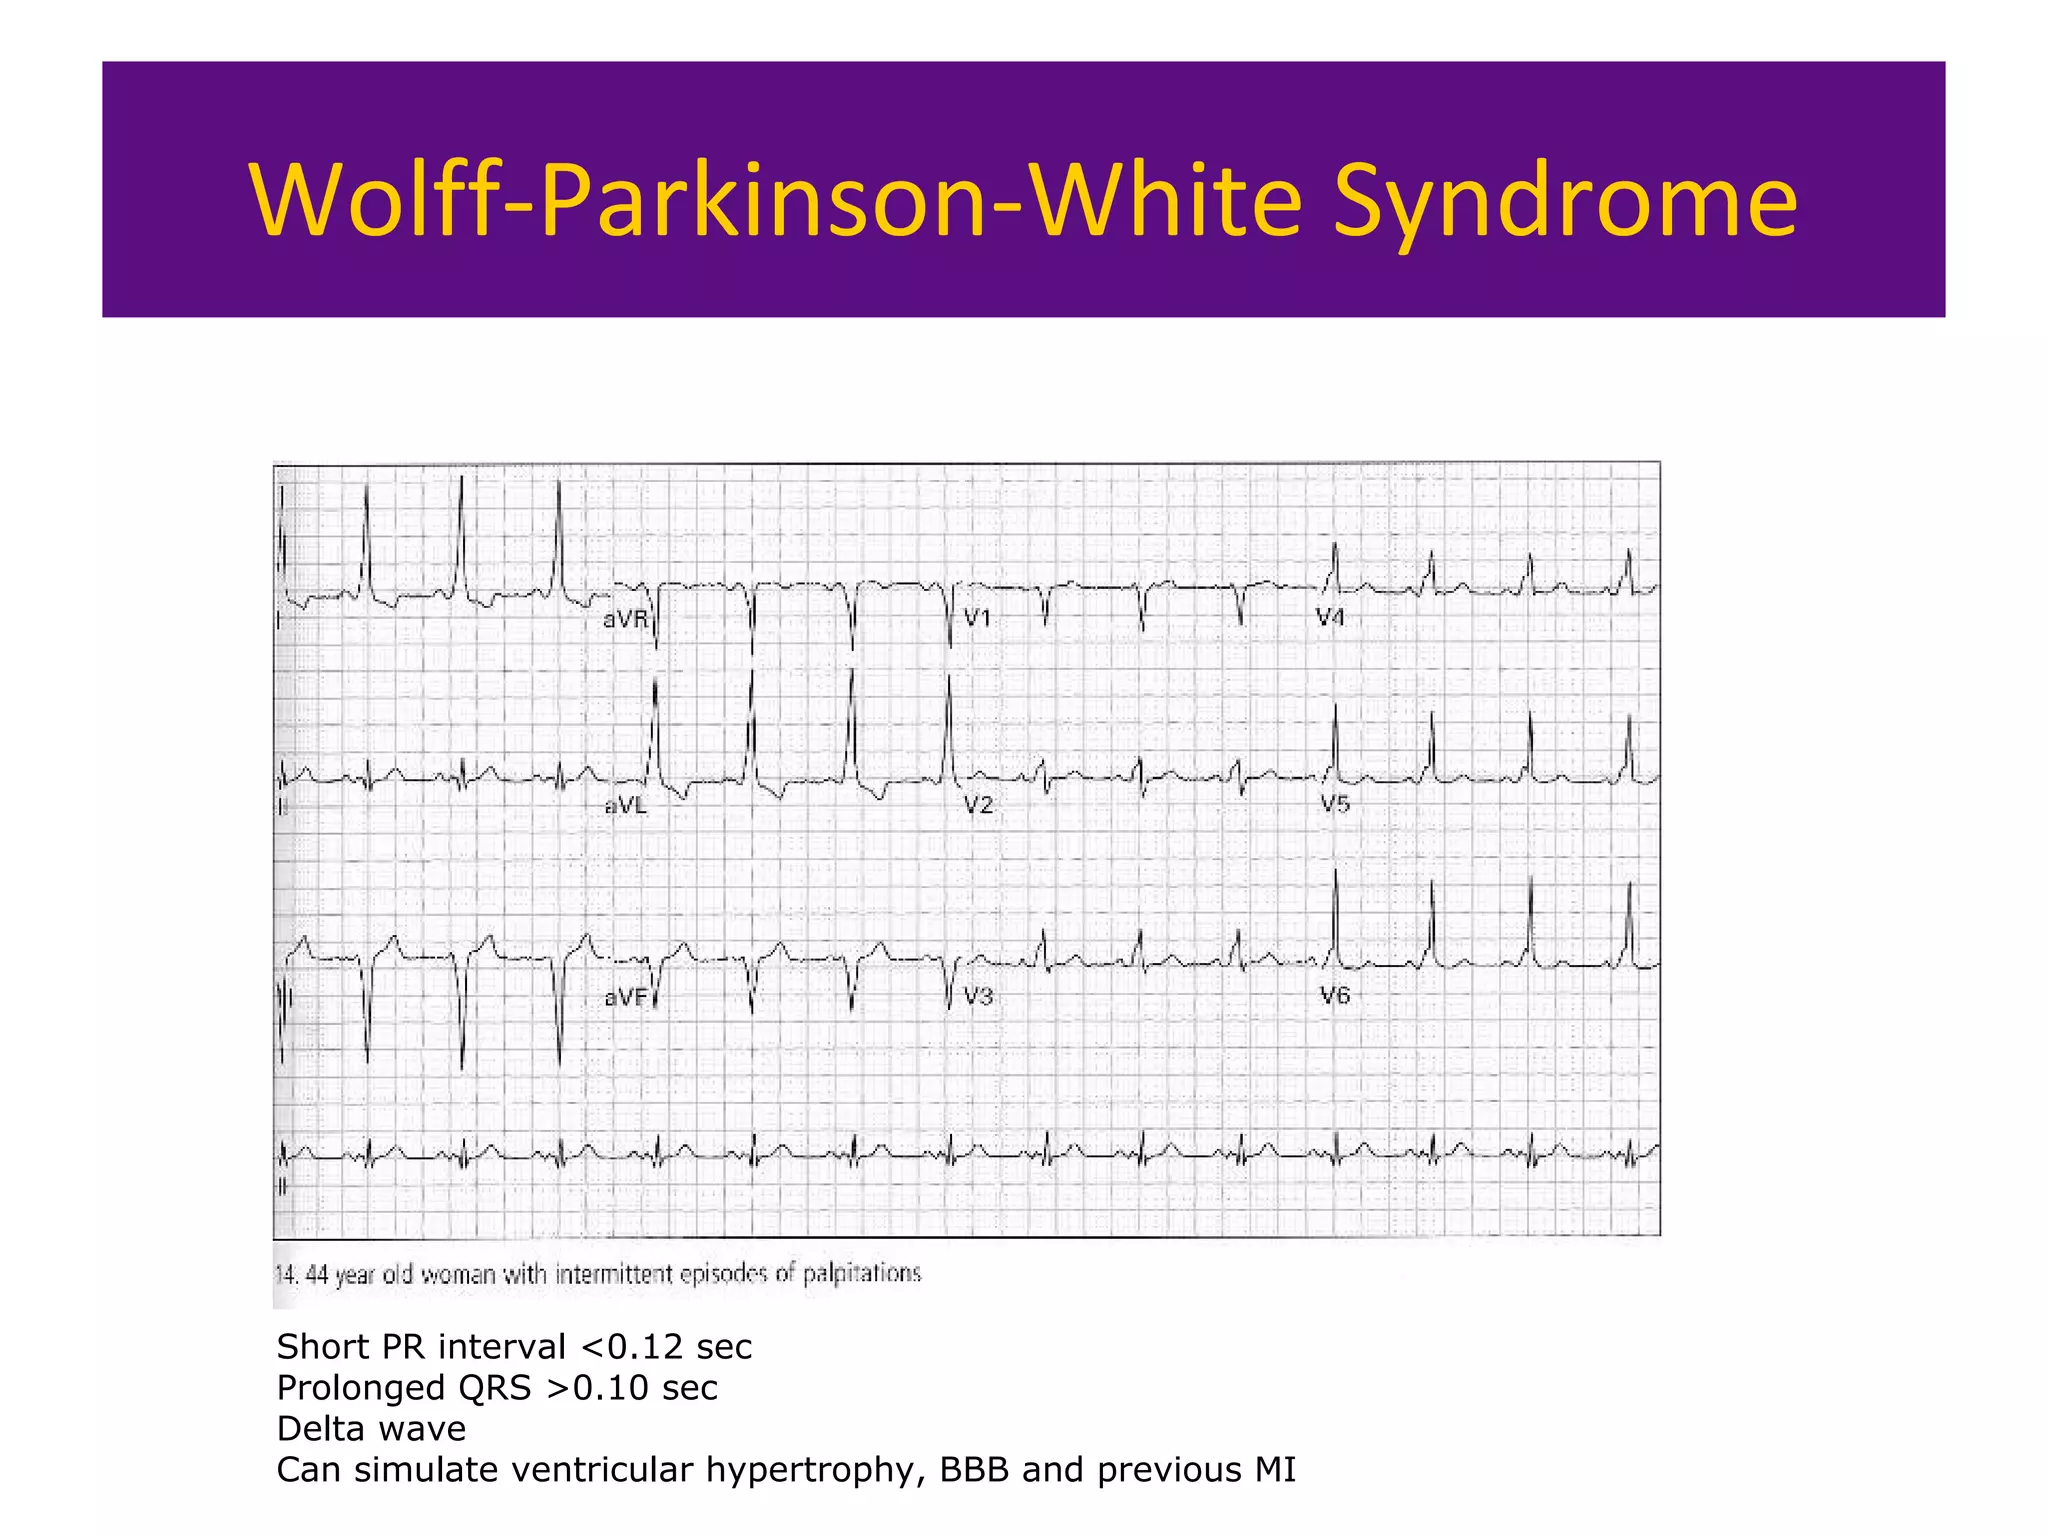
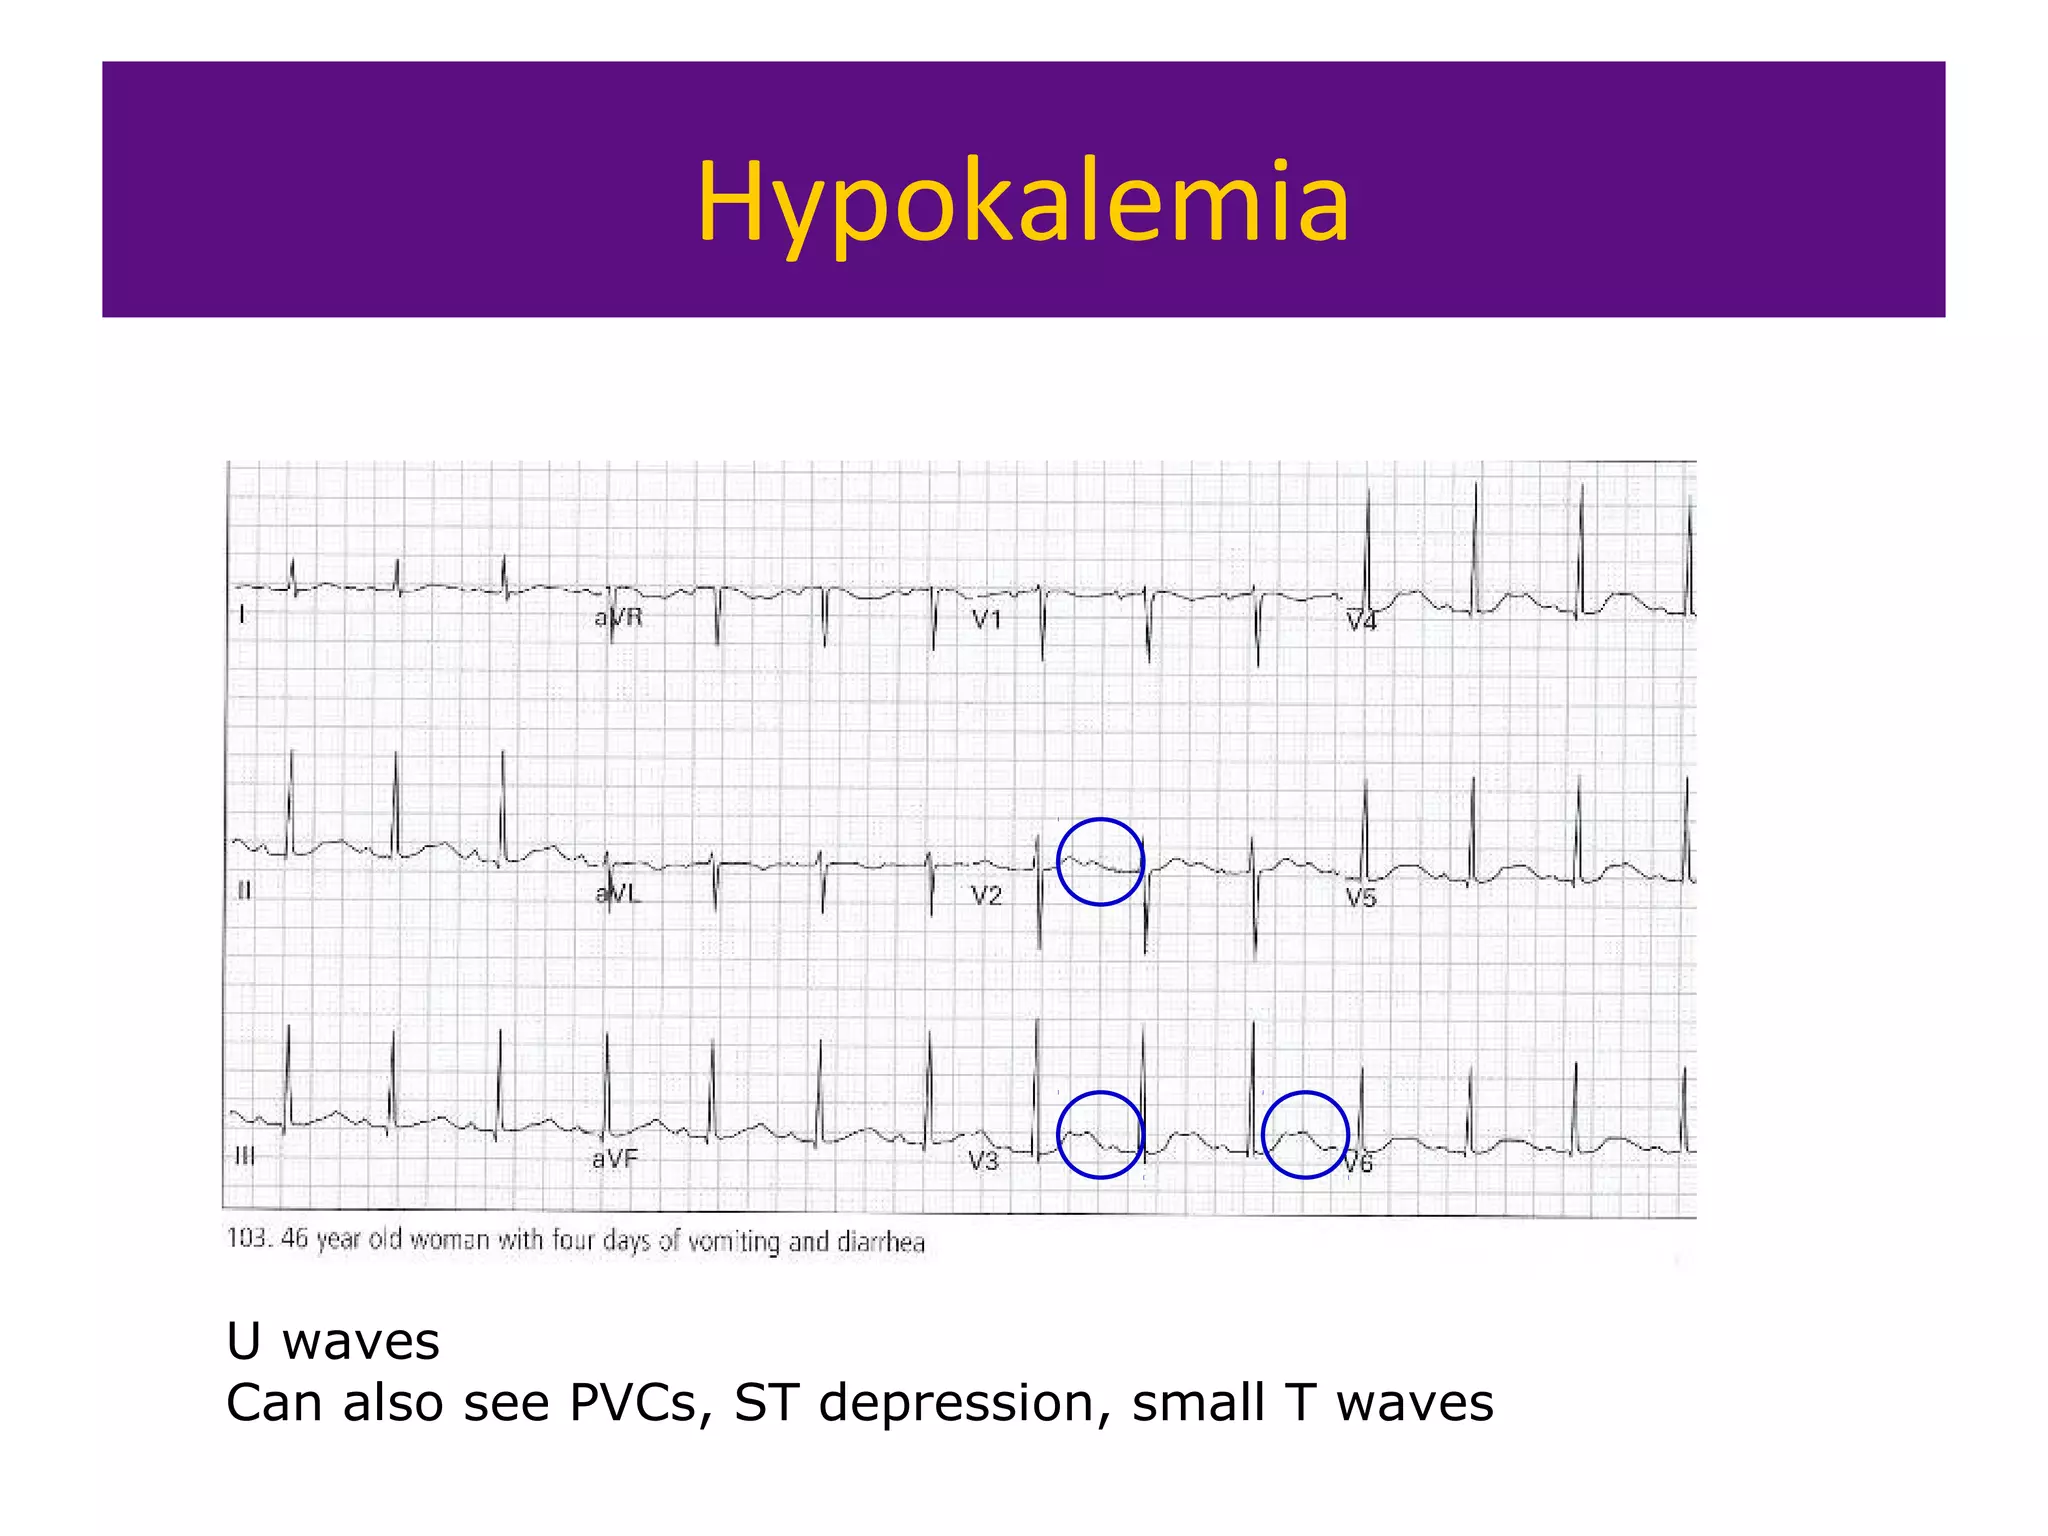


The document provides an overview of electrocardiogram (ECG) interpretation. It discusses the key steps including assessing quality, rate, rhythm, axis, P wave, PR interval, QRS duration and morphology, ST segment, T wave, QT interval, and identifying common abnormalities. Examples of important ECG patterns are also shown, such as lateral myocardial infarction, left bundle branch block, ventricular tachycardia, and Wolff-Parkinson-White syndrome. The overall document aims to develop a structured approach for interpreting ECGs in clinical practice.