Downloaded 31,116 times
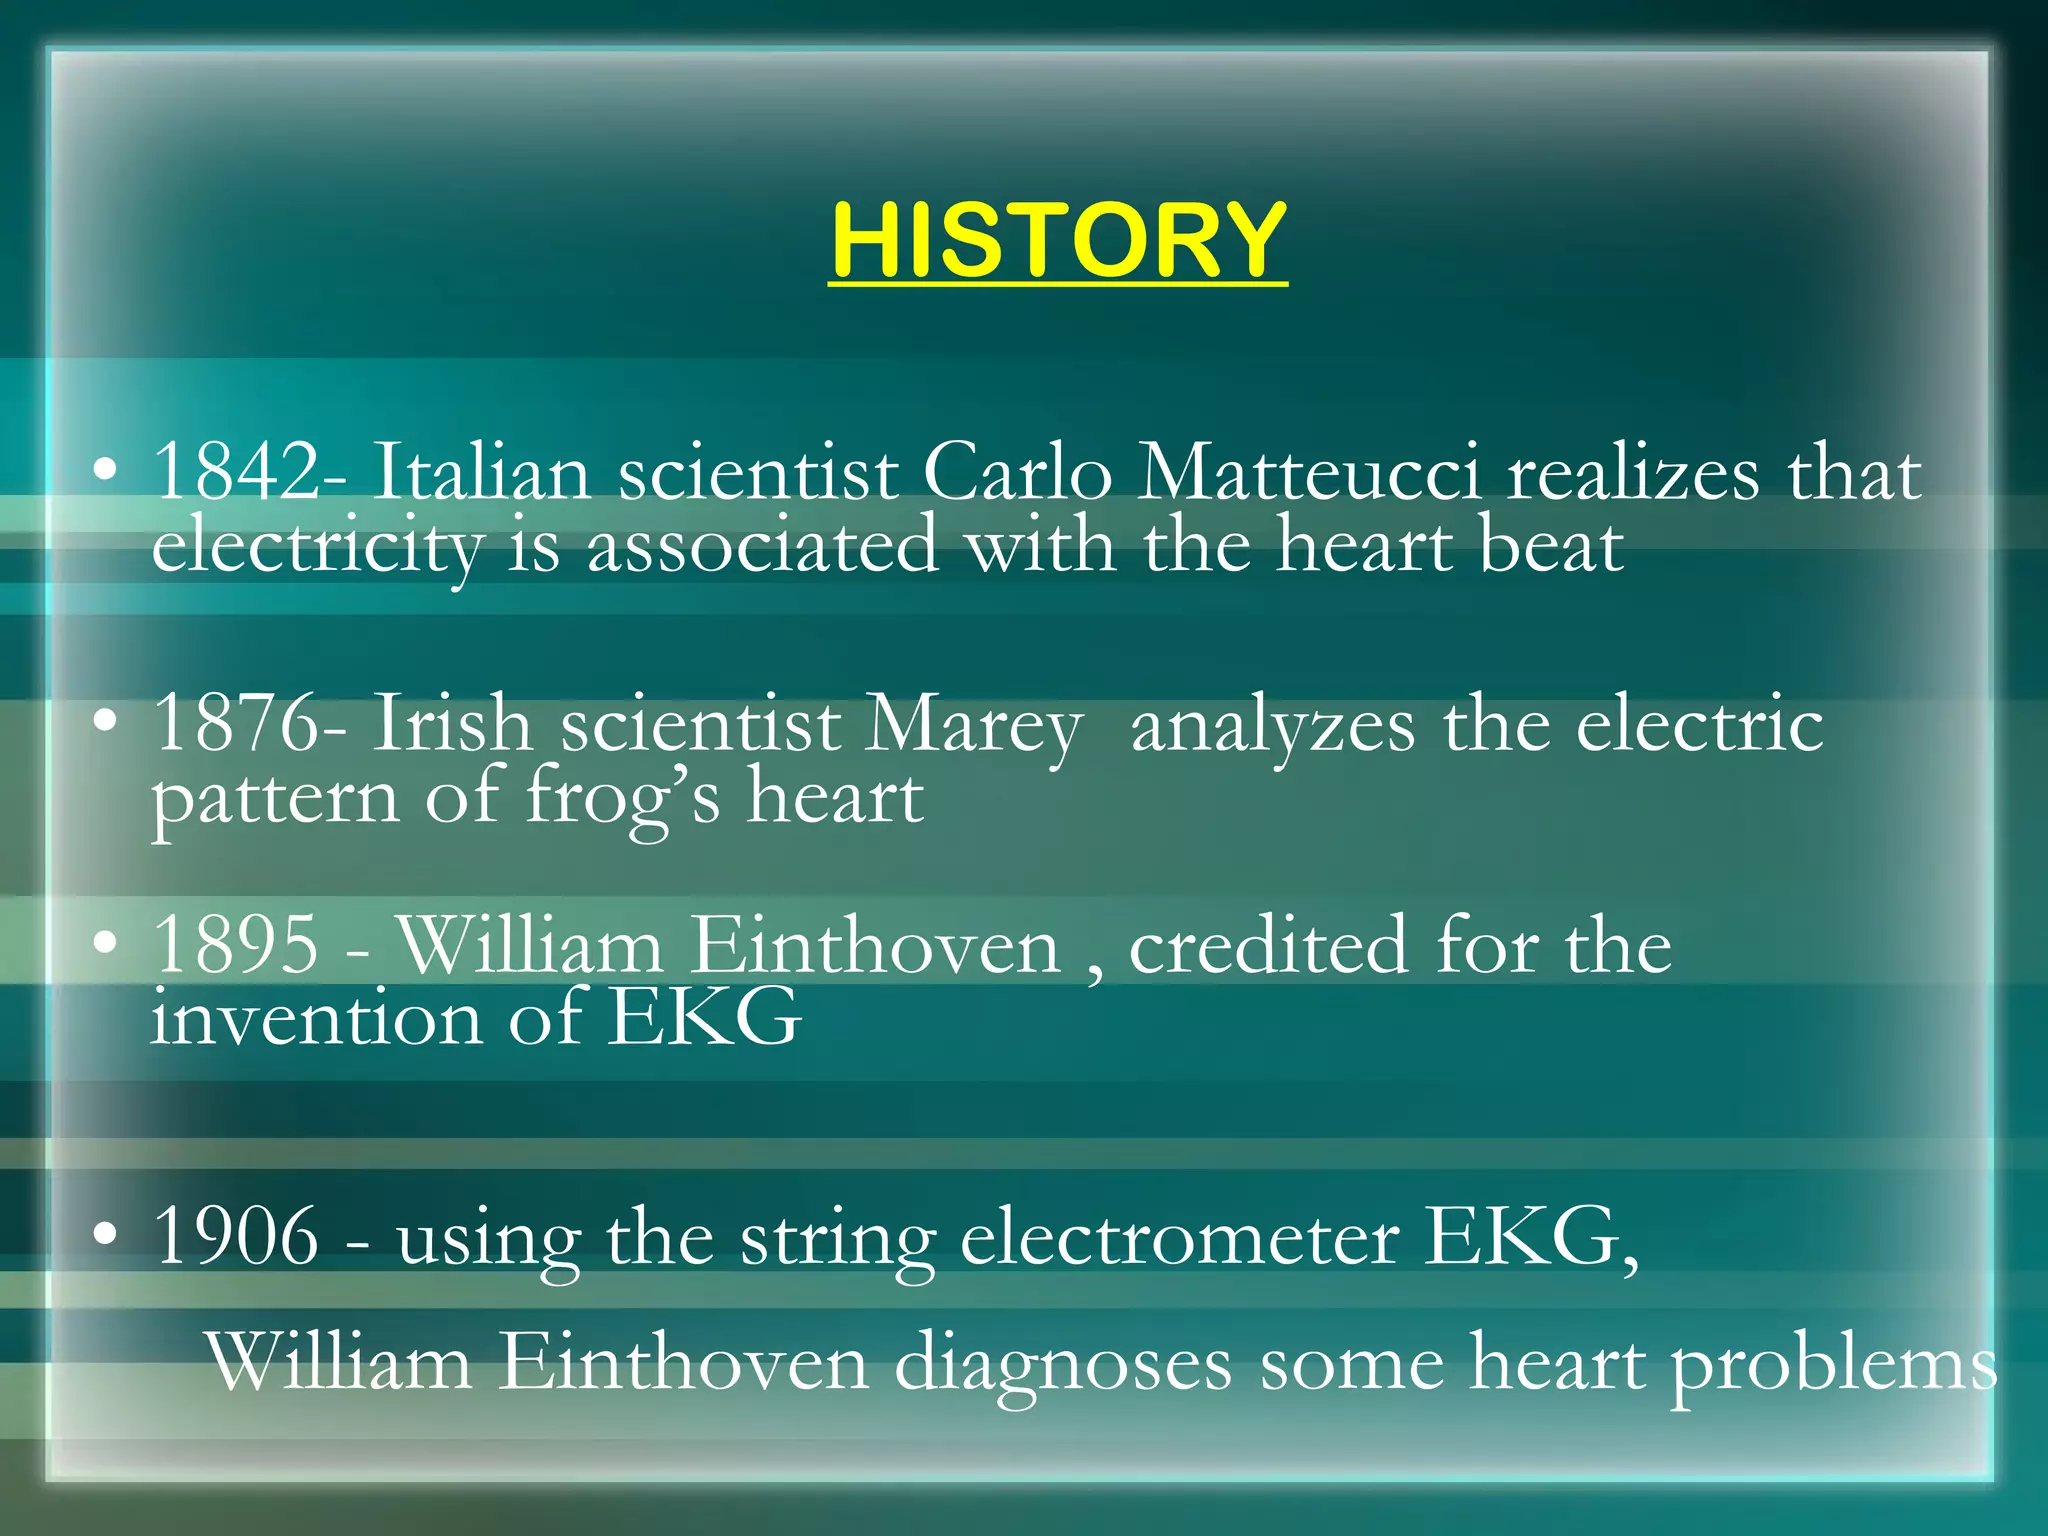
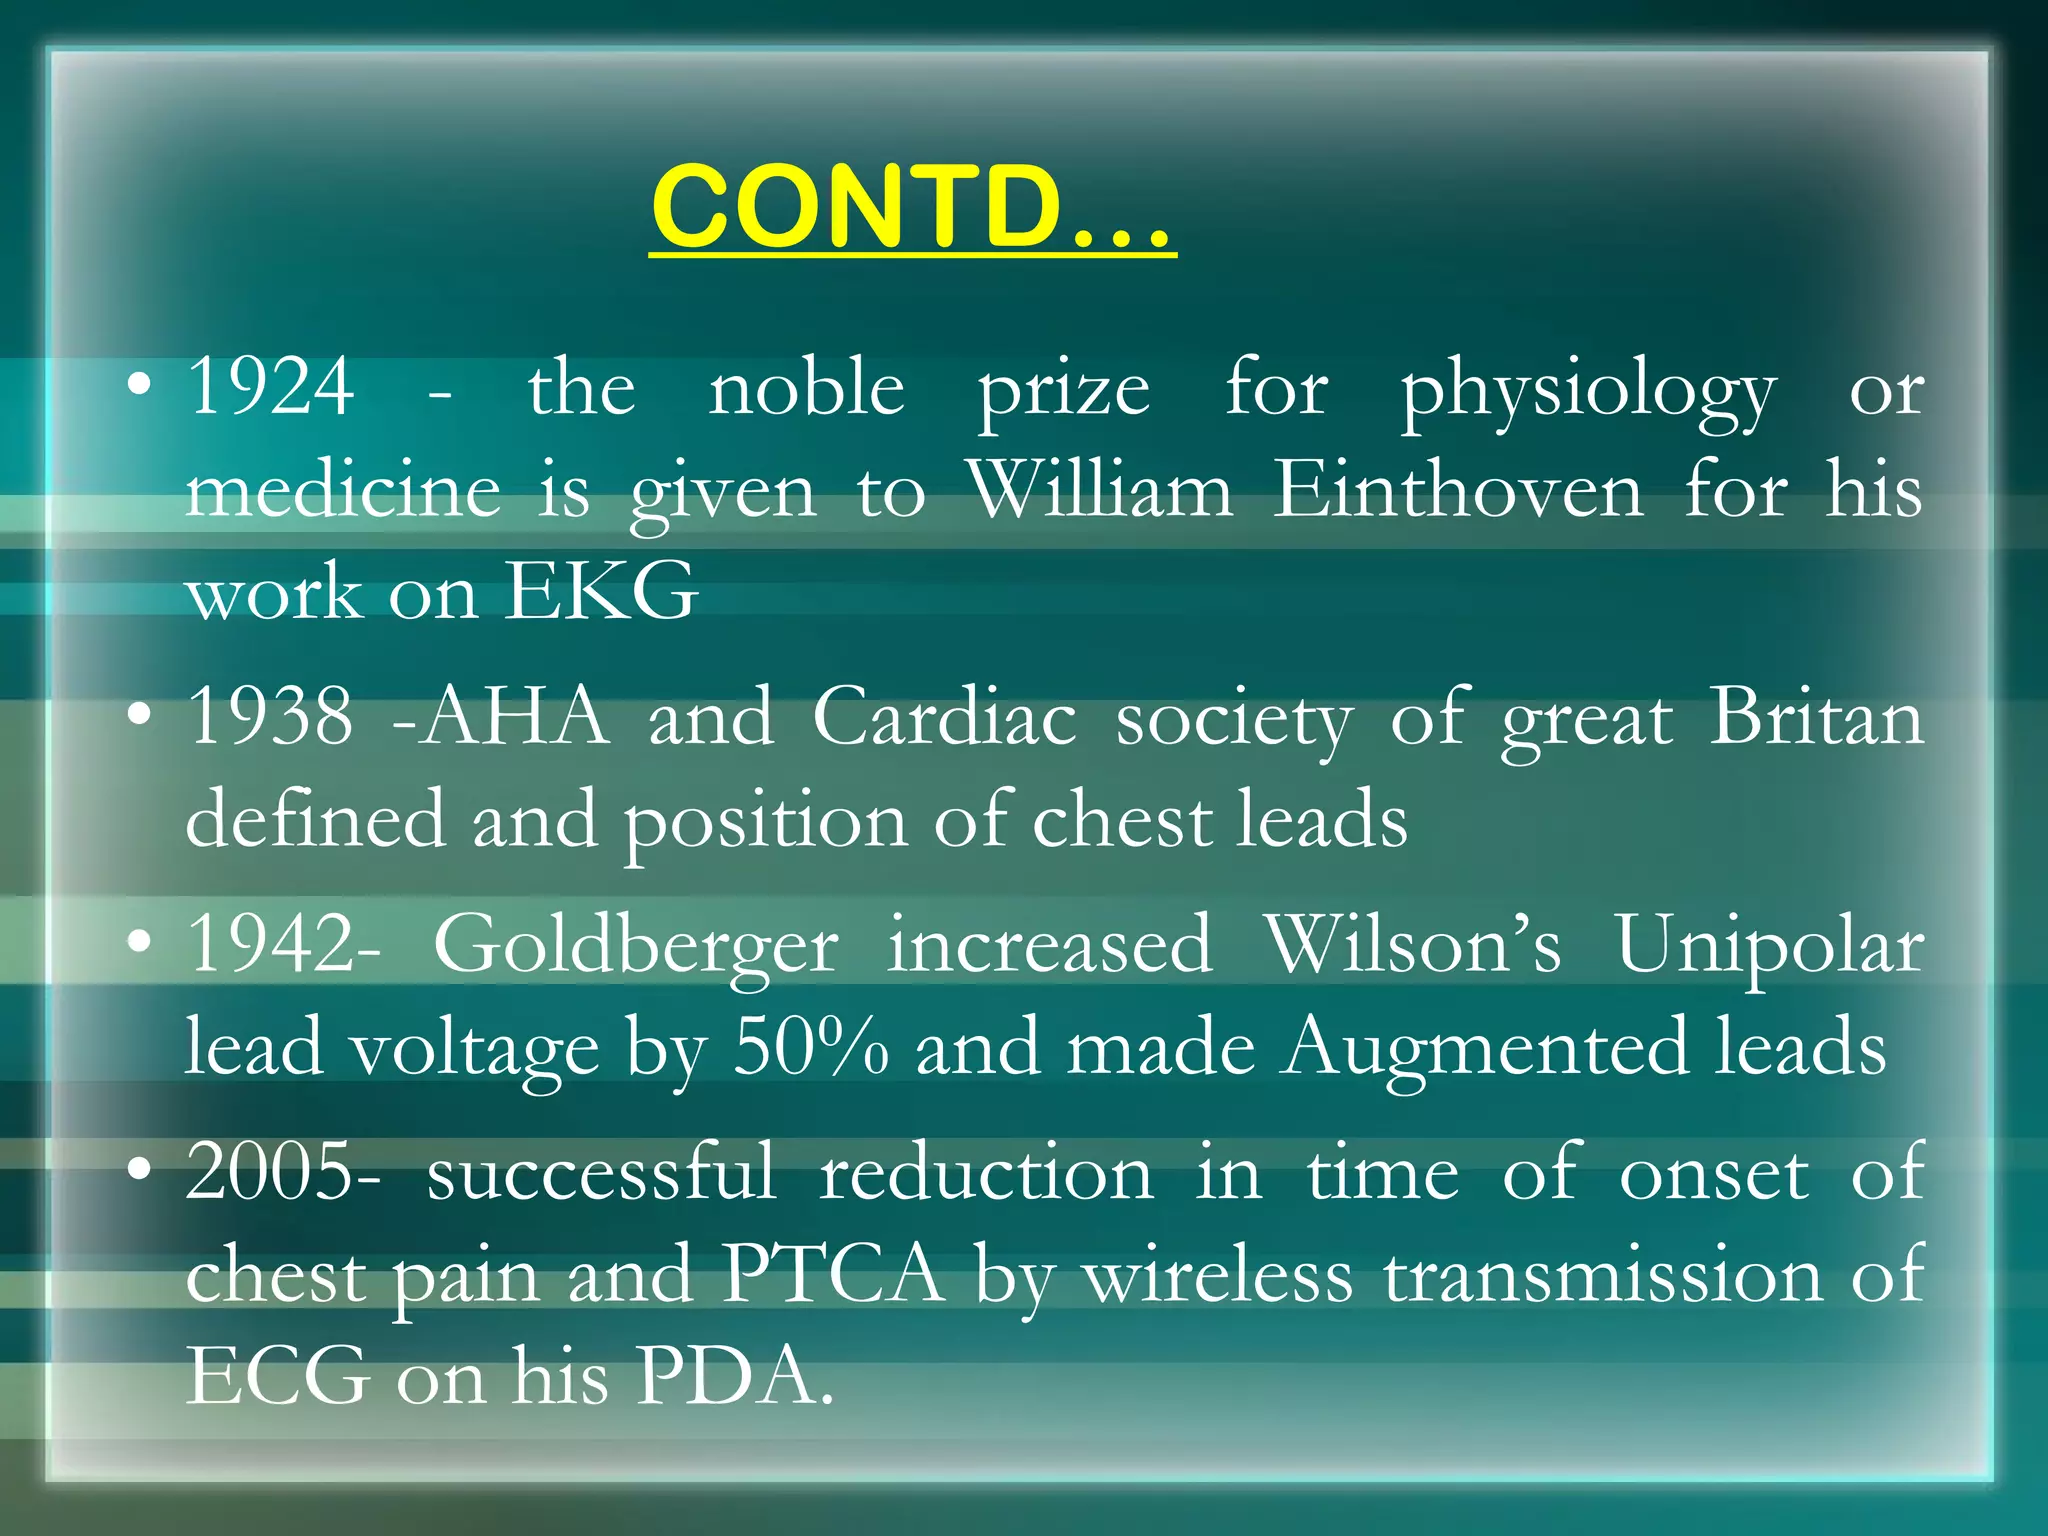
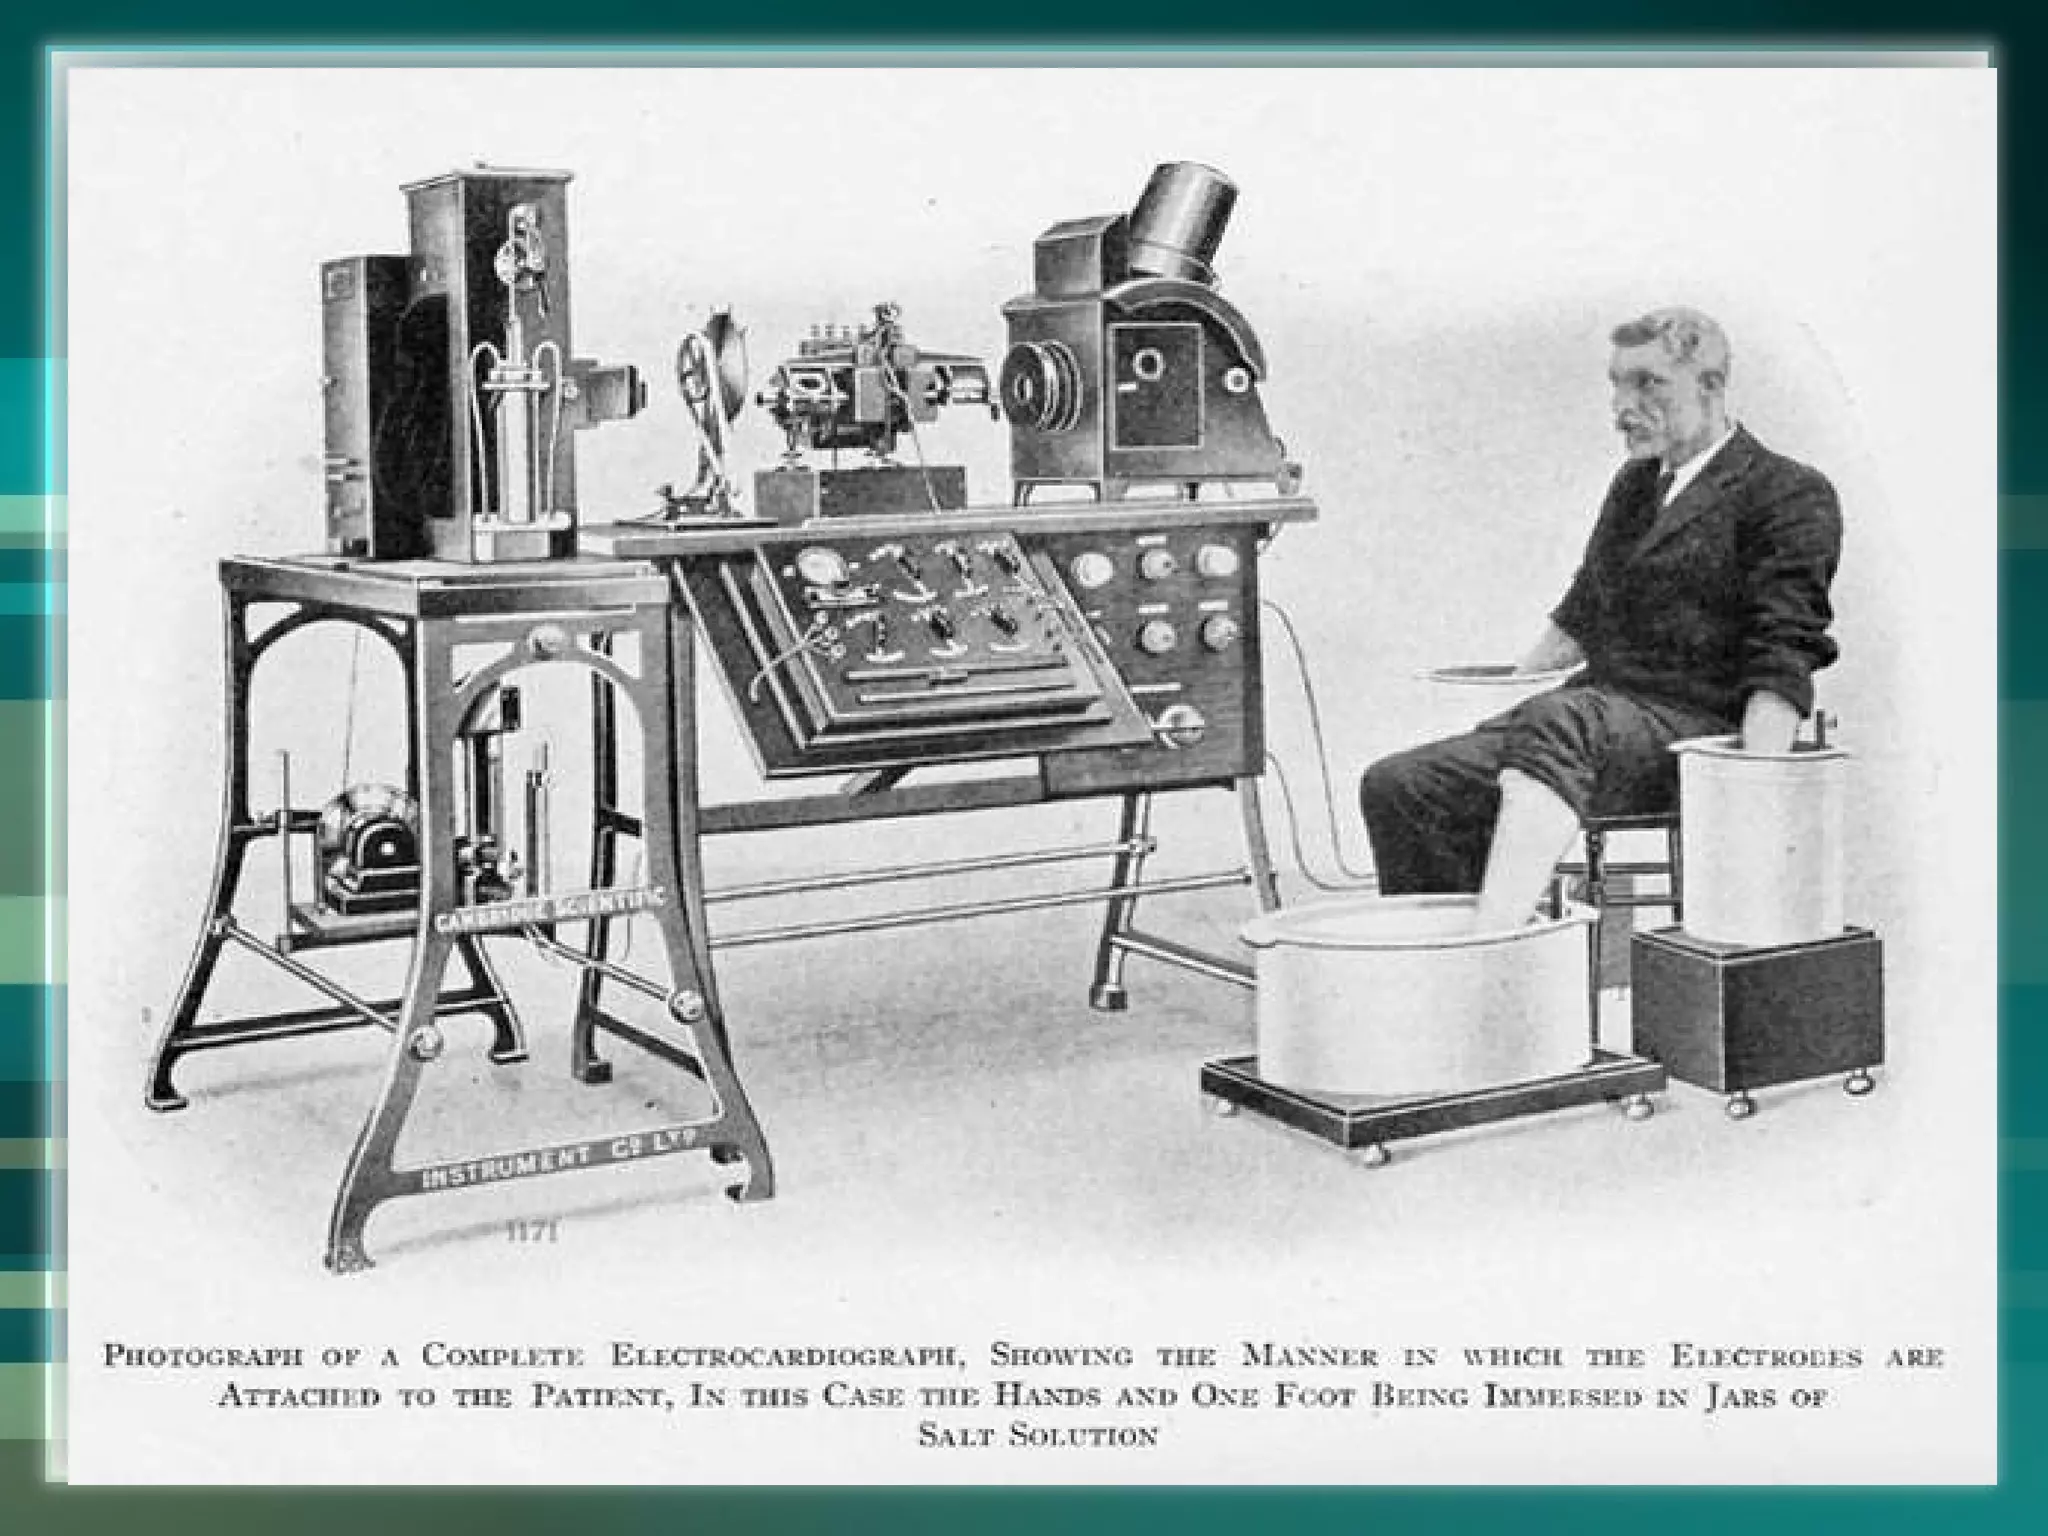
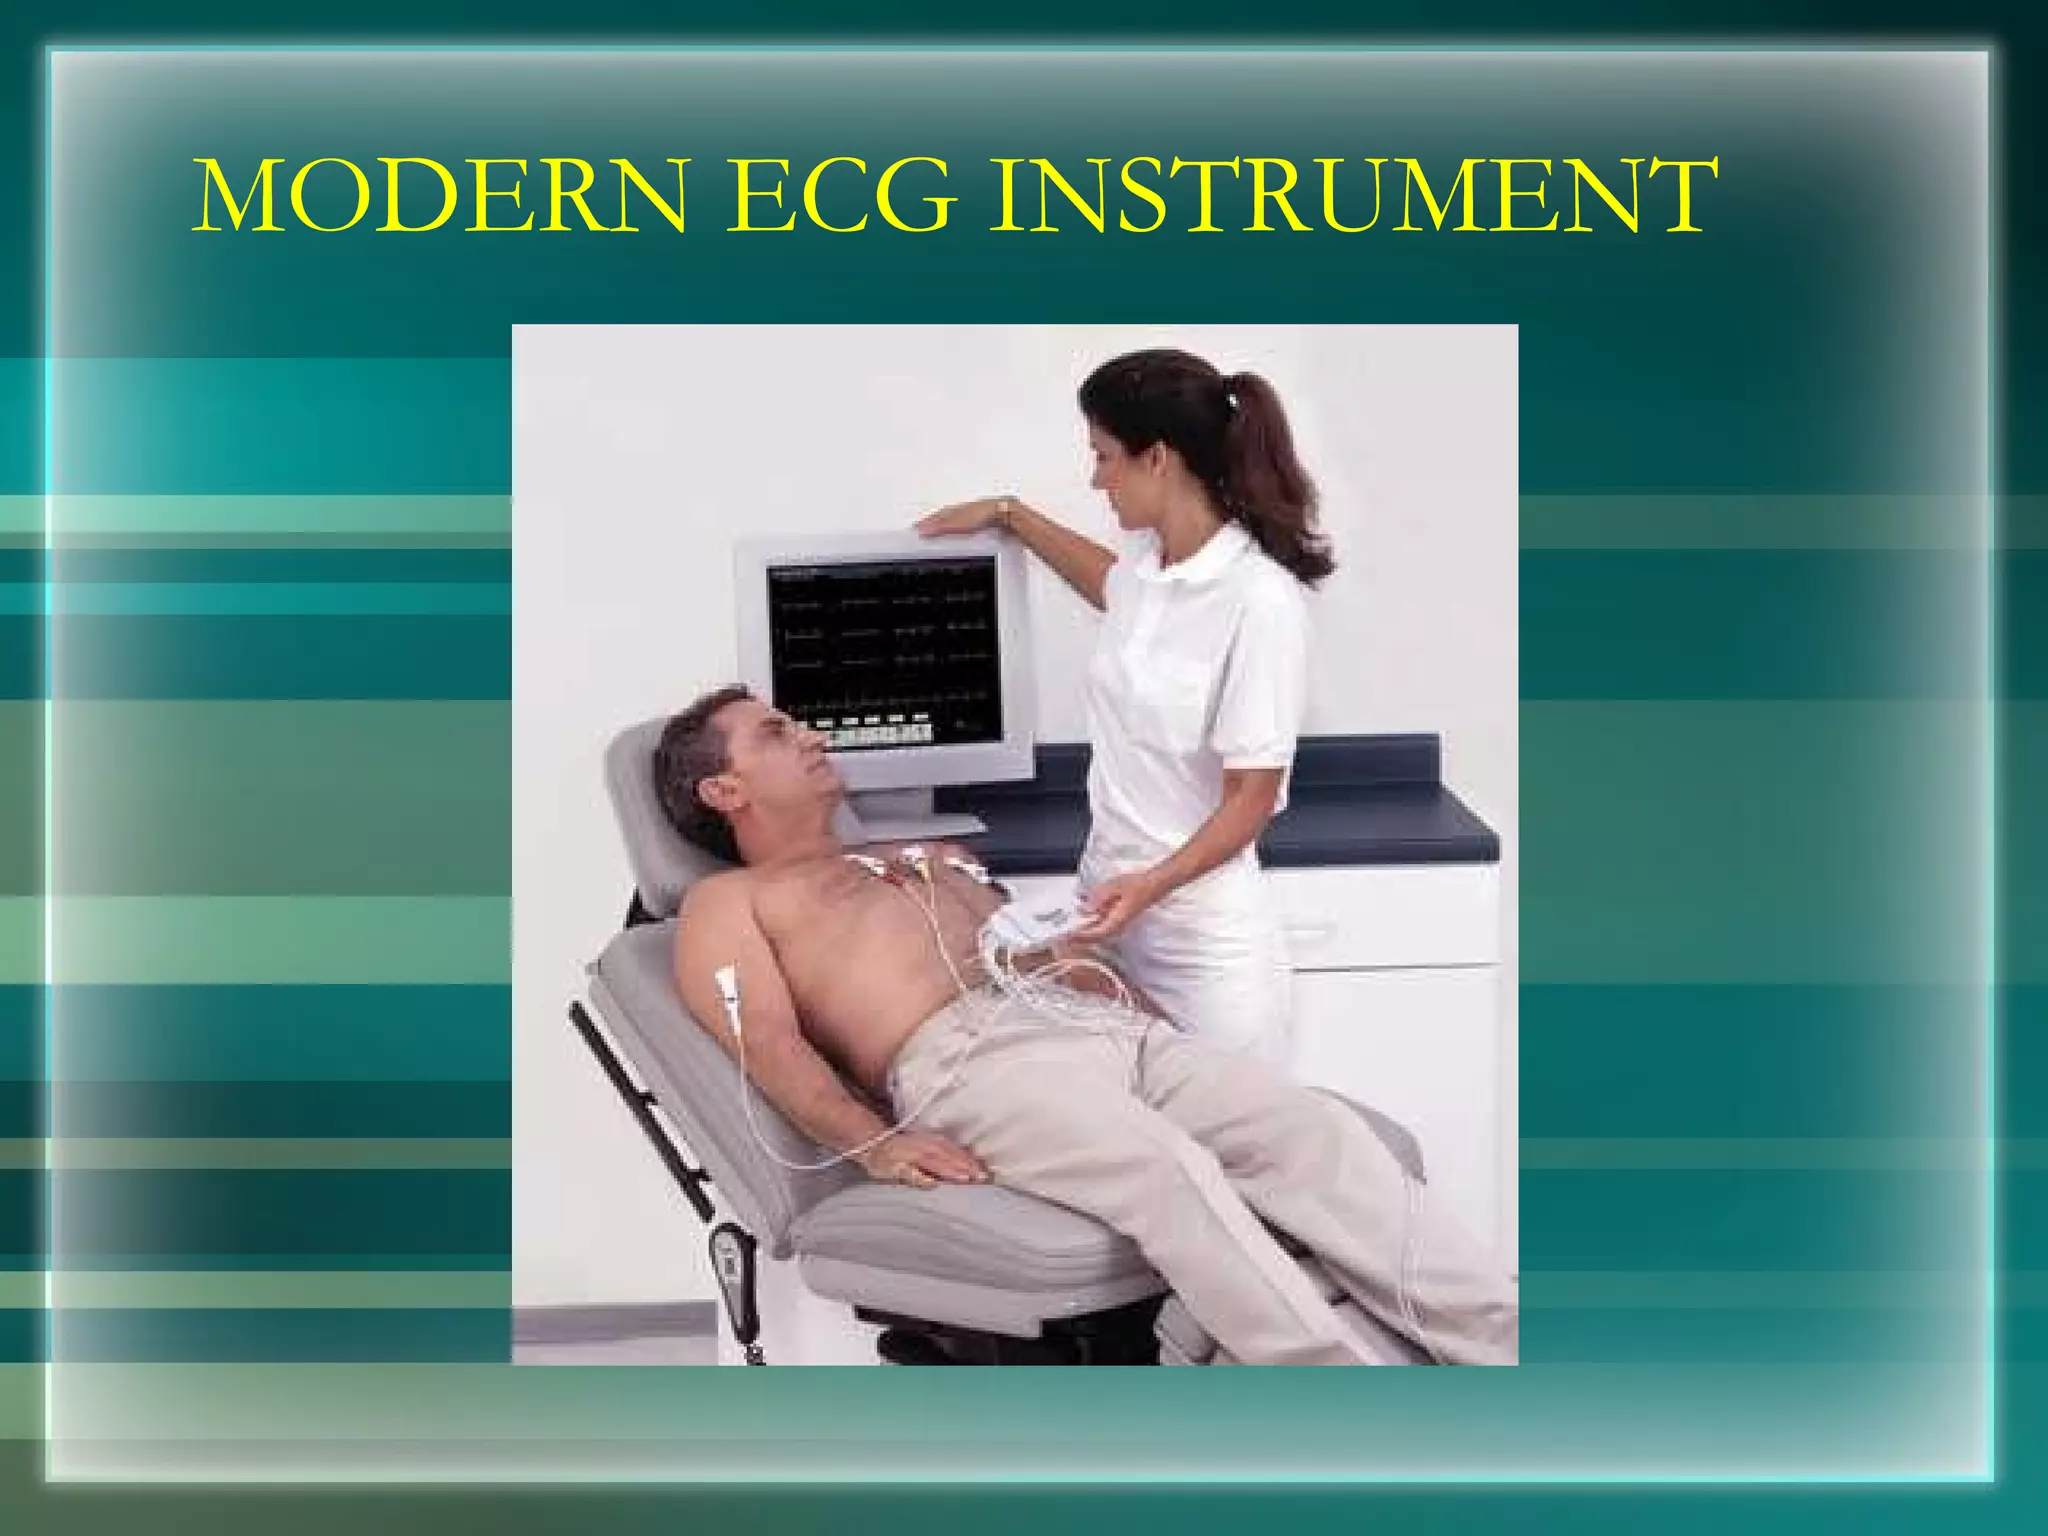
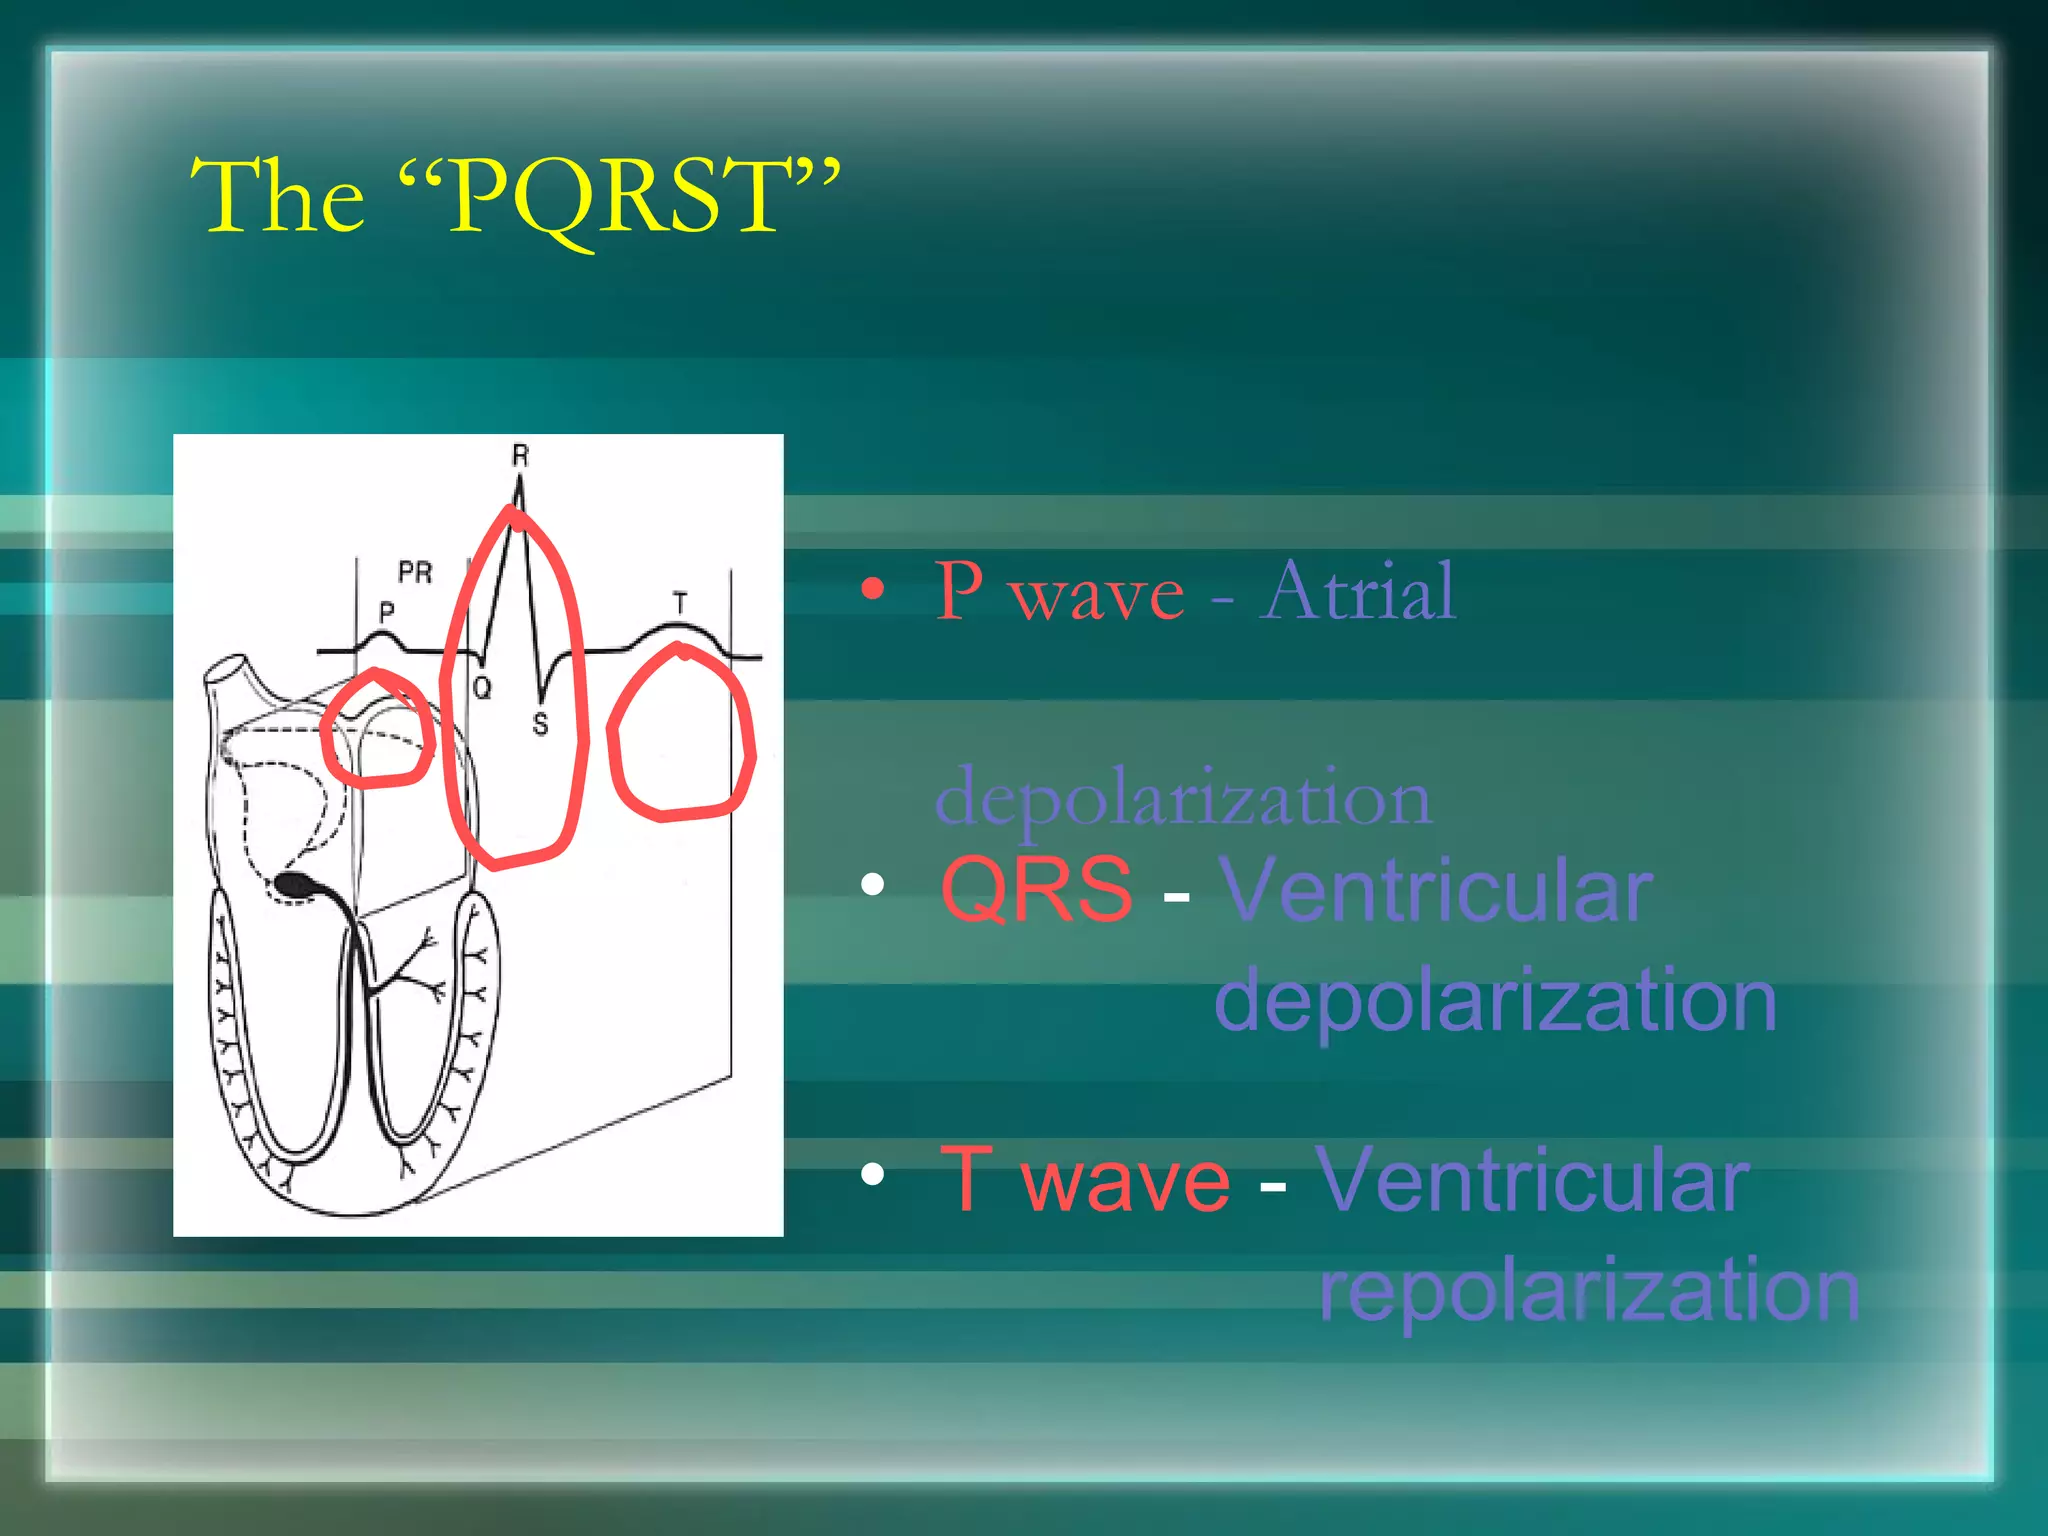
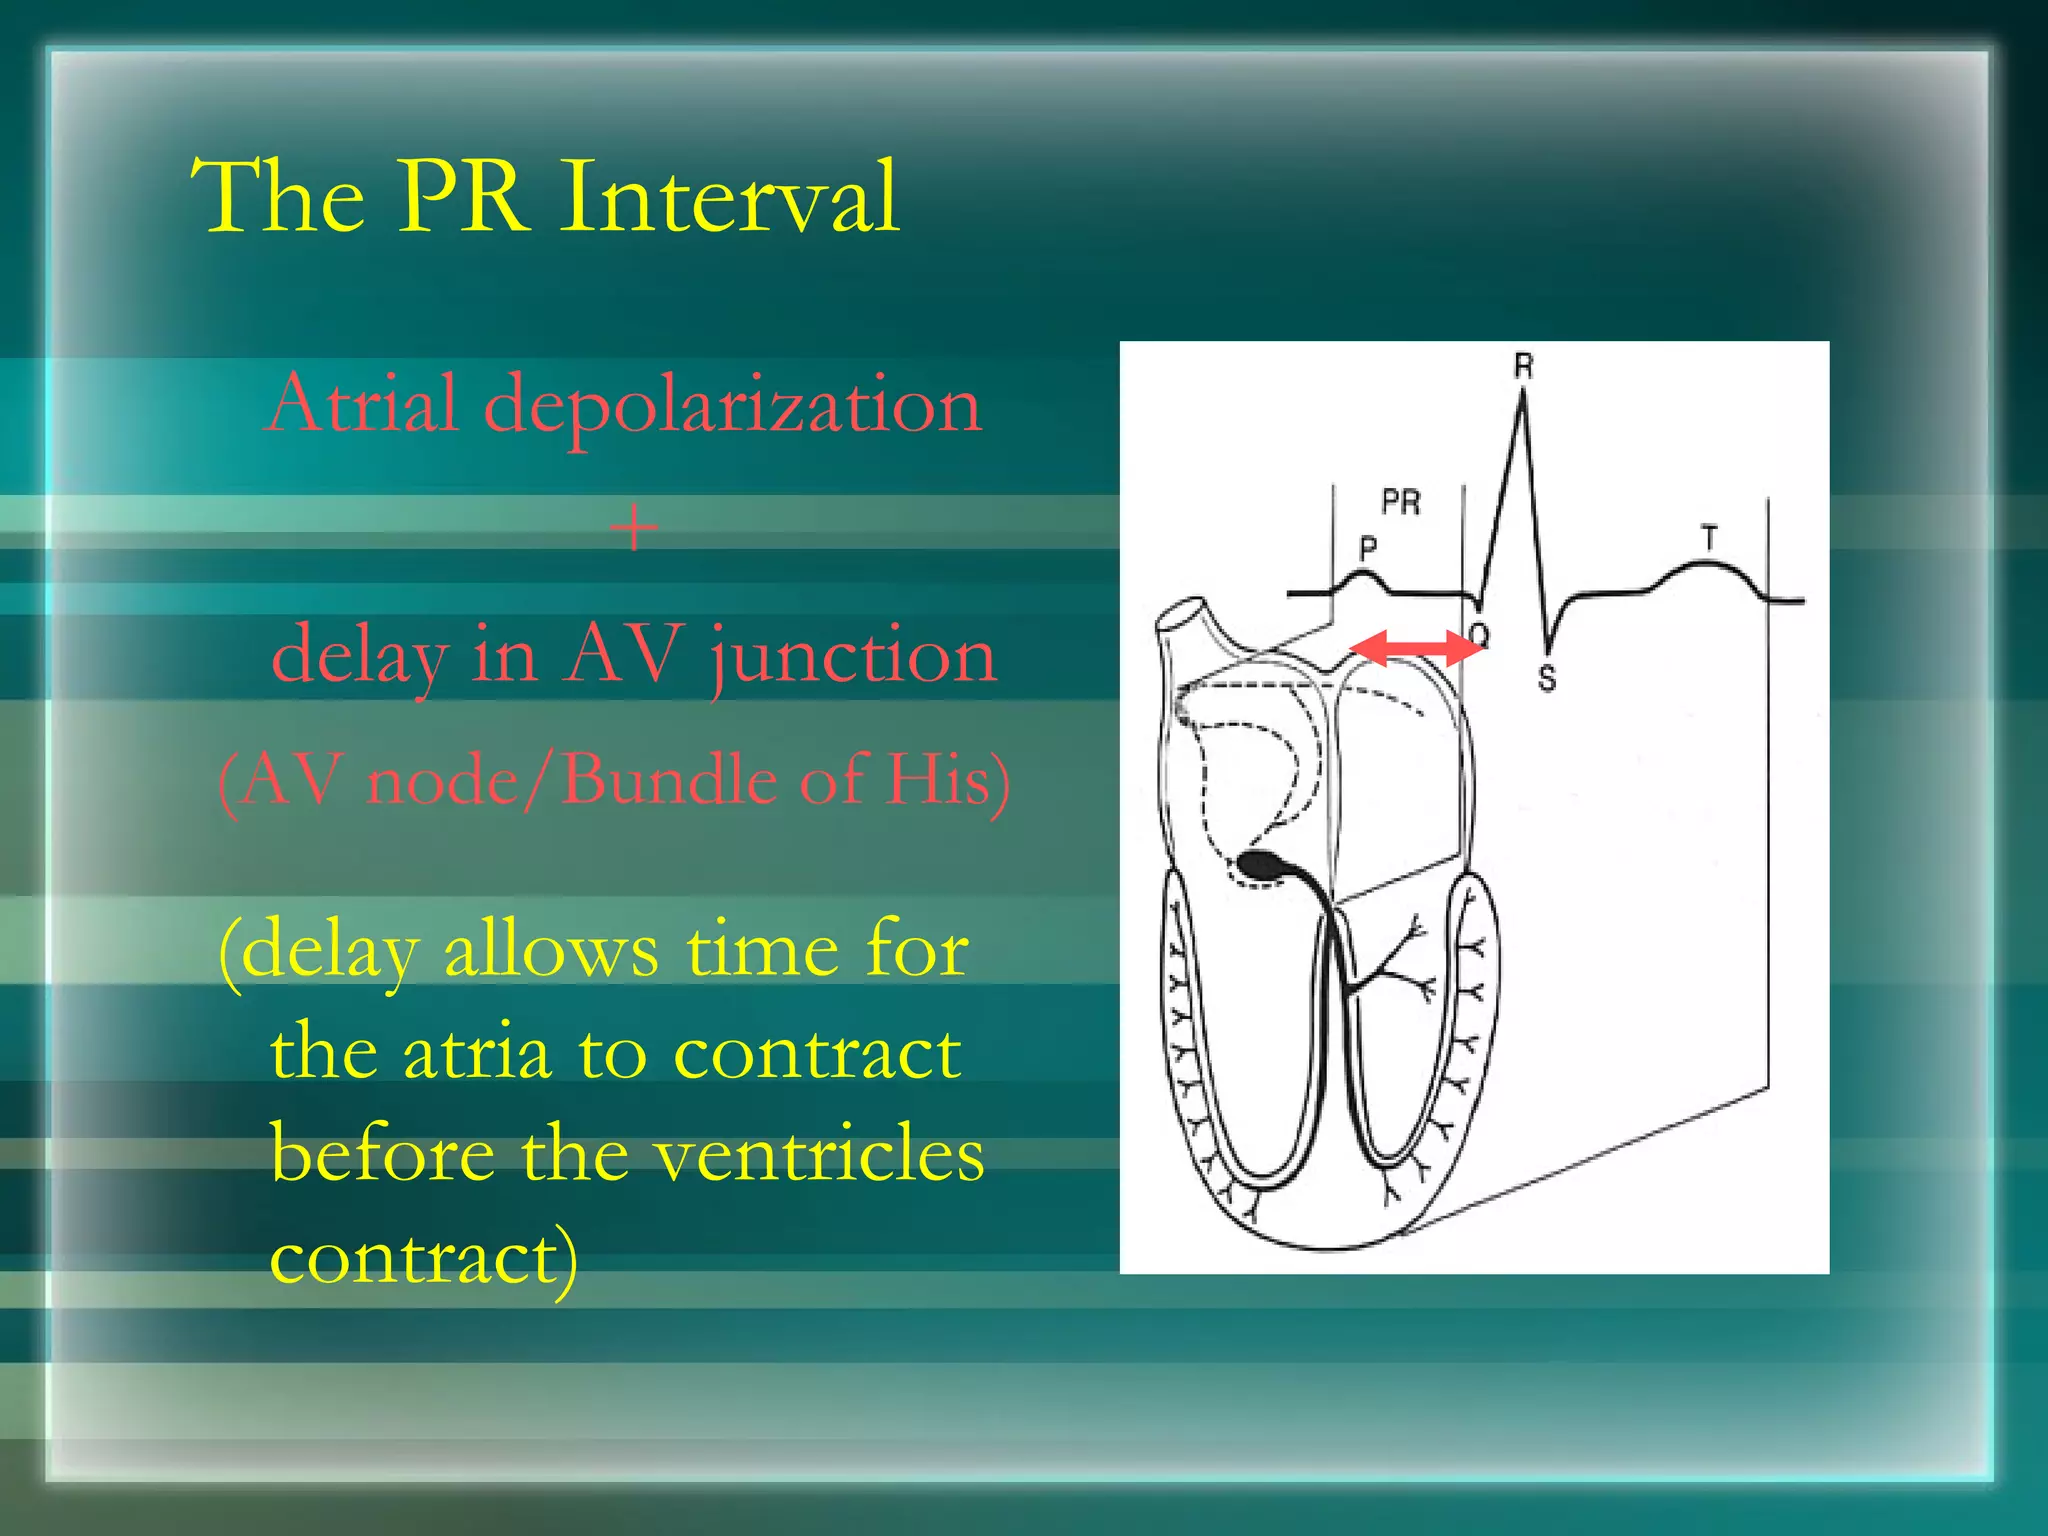
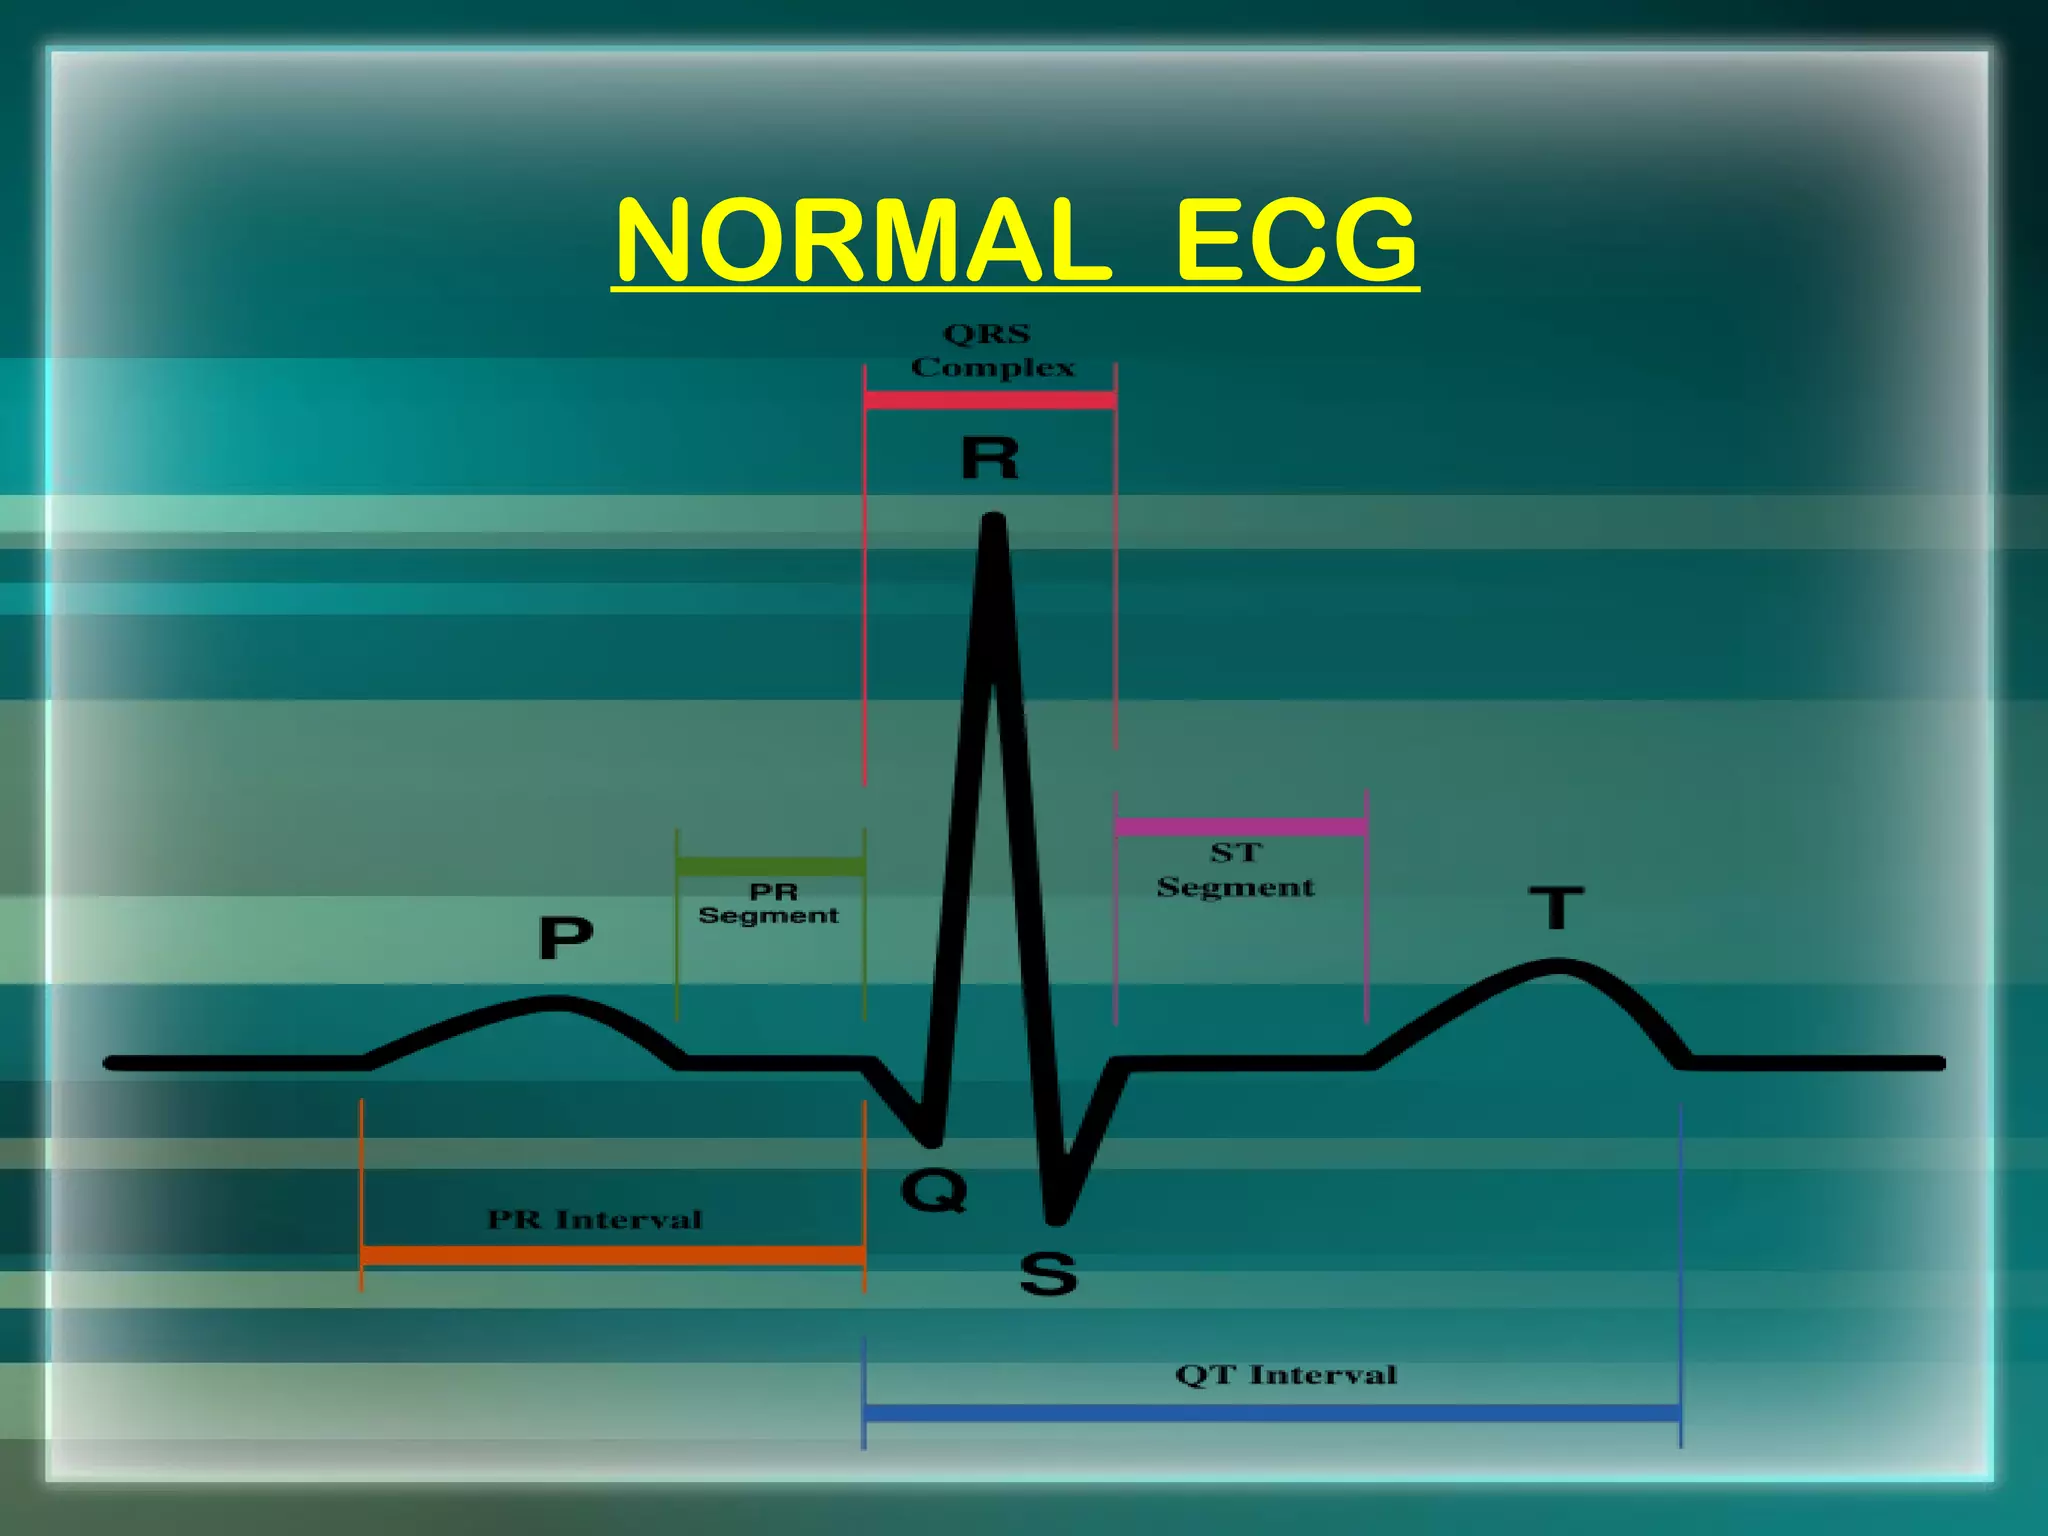
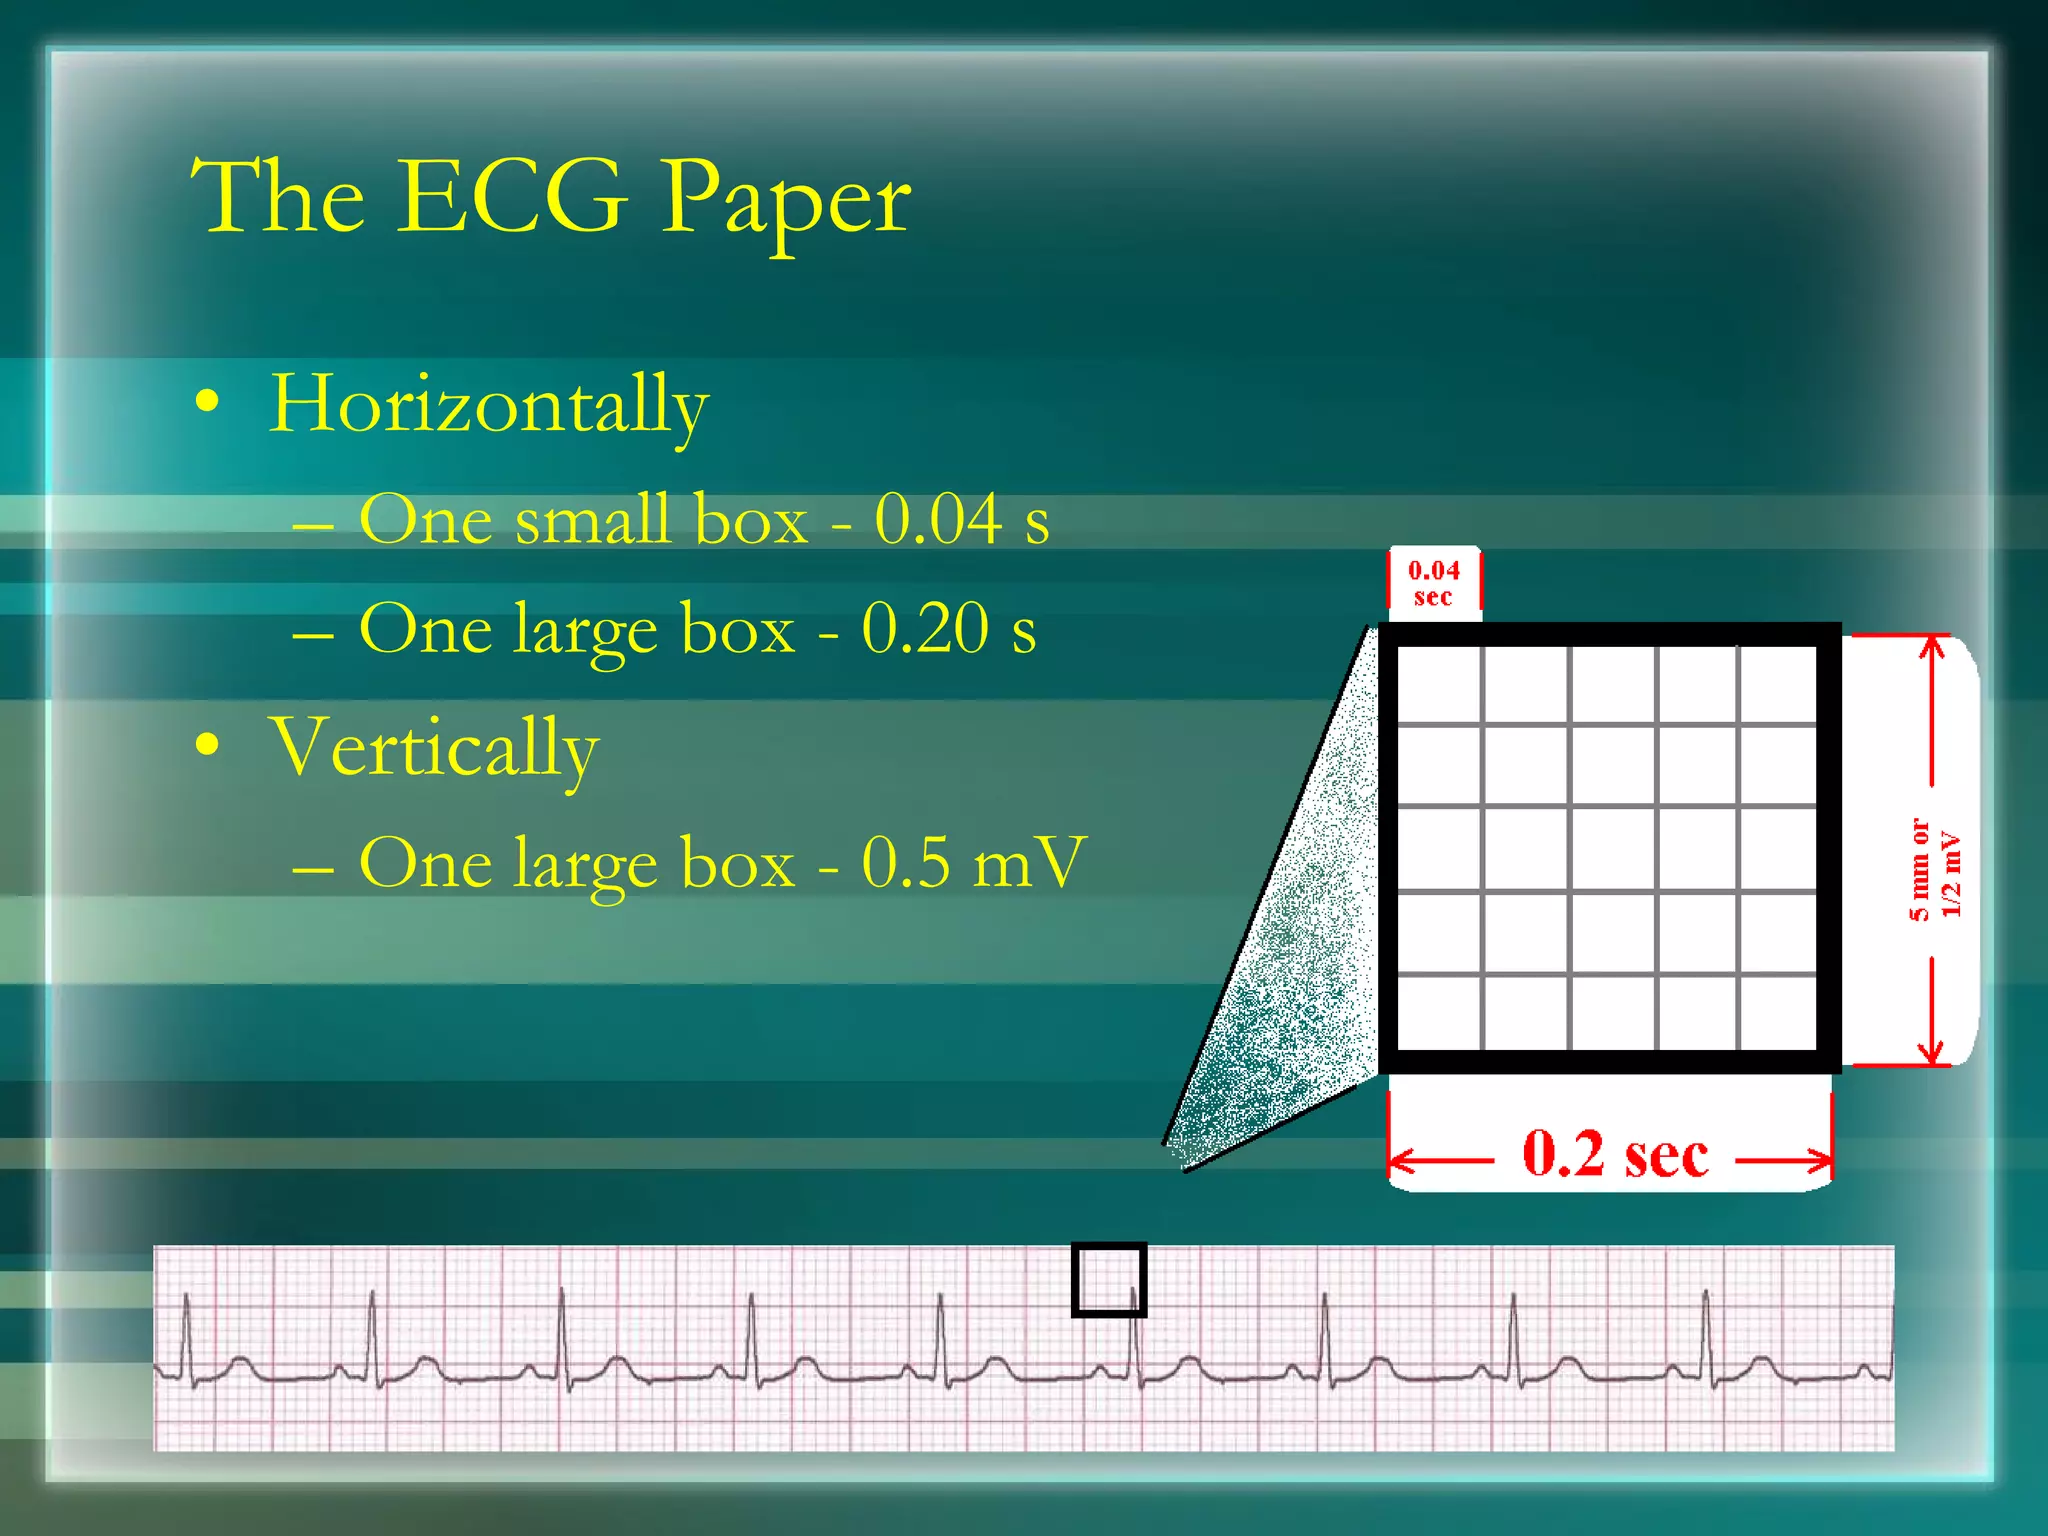
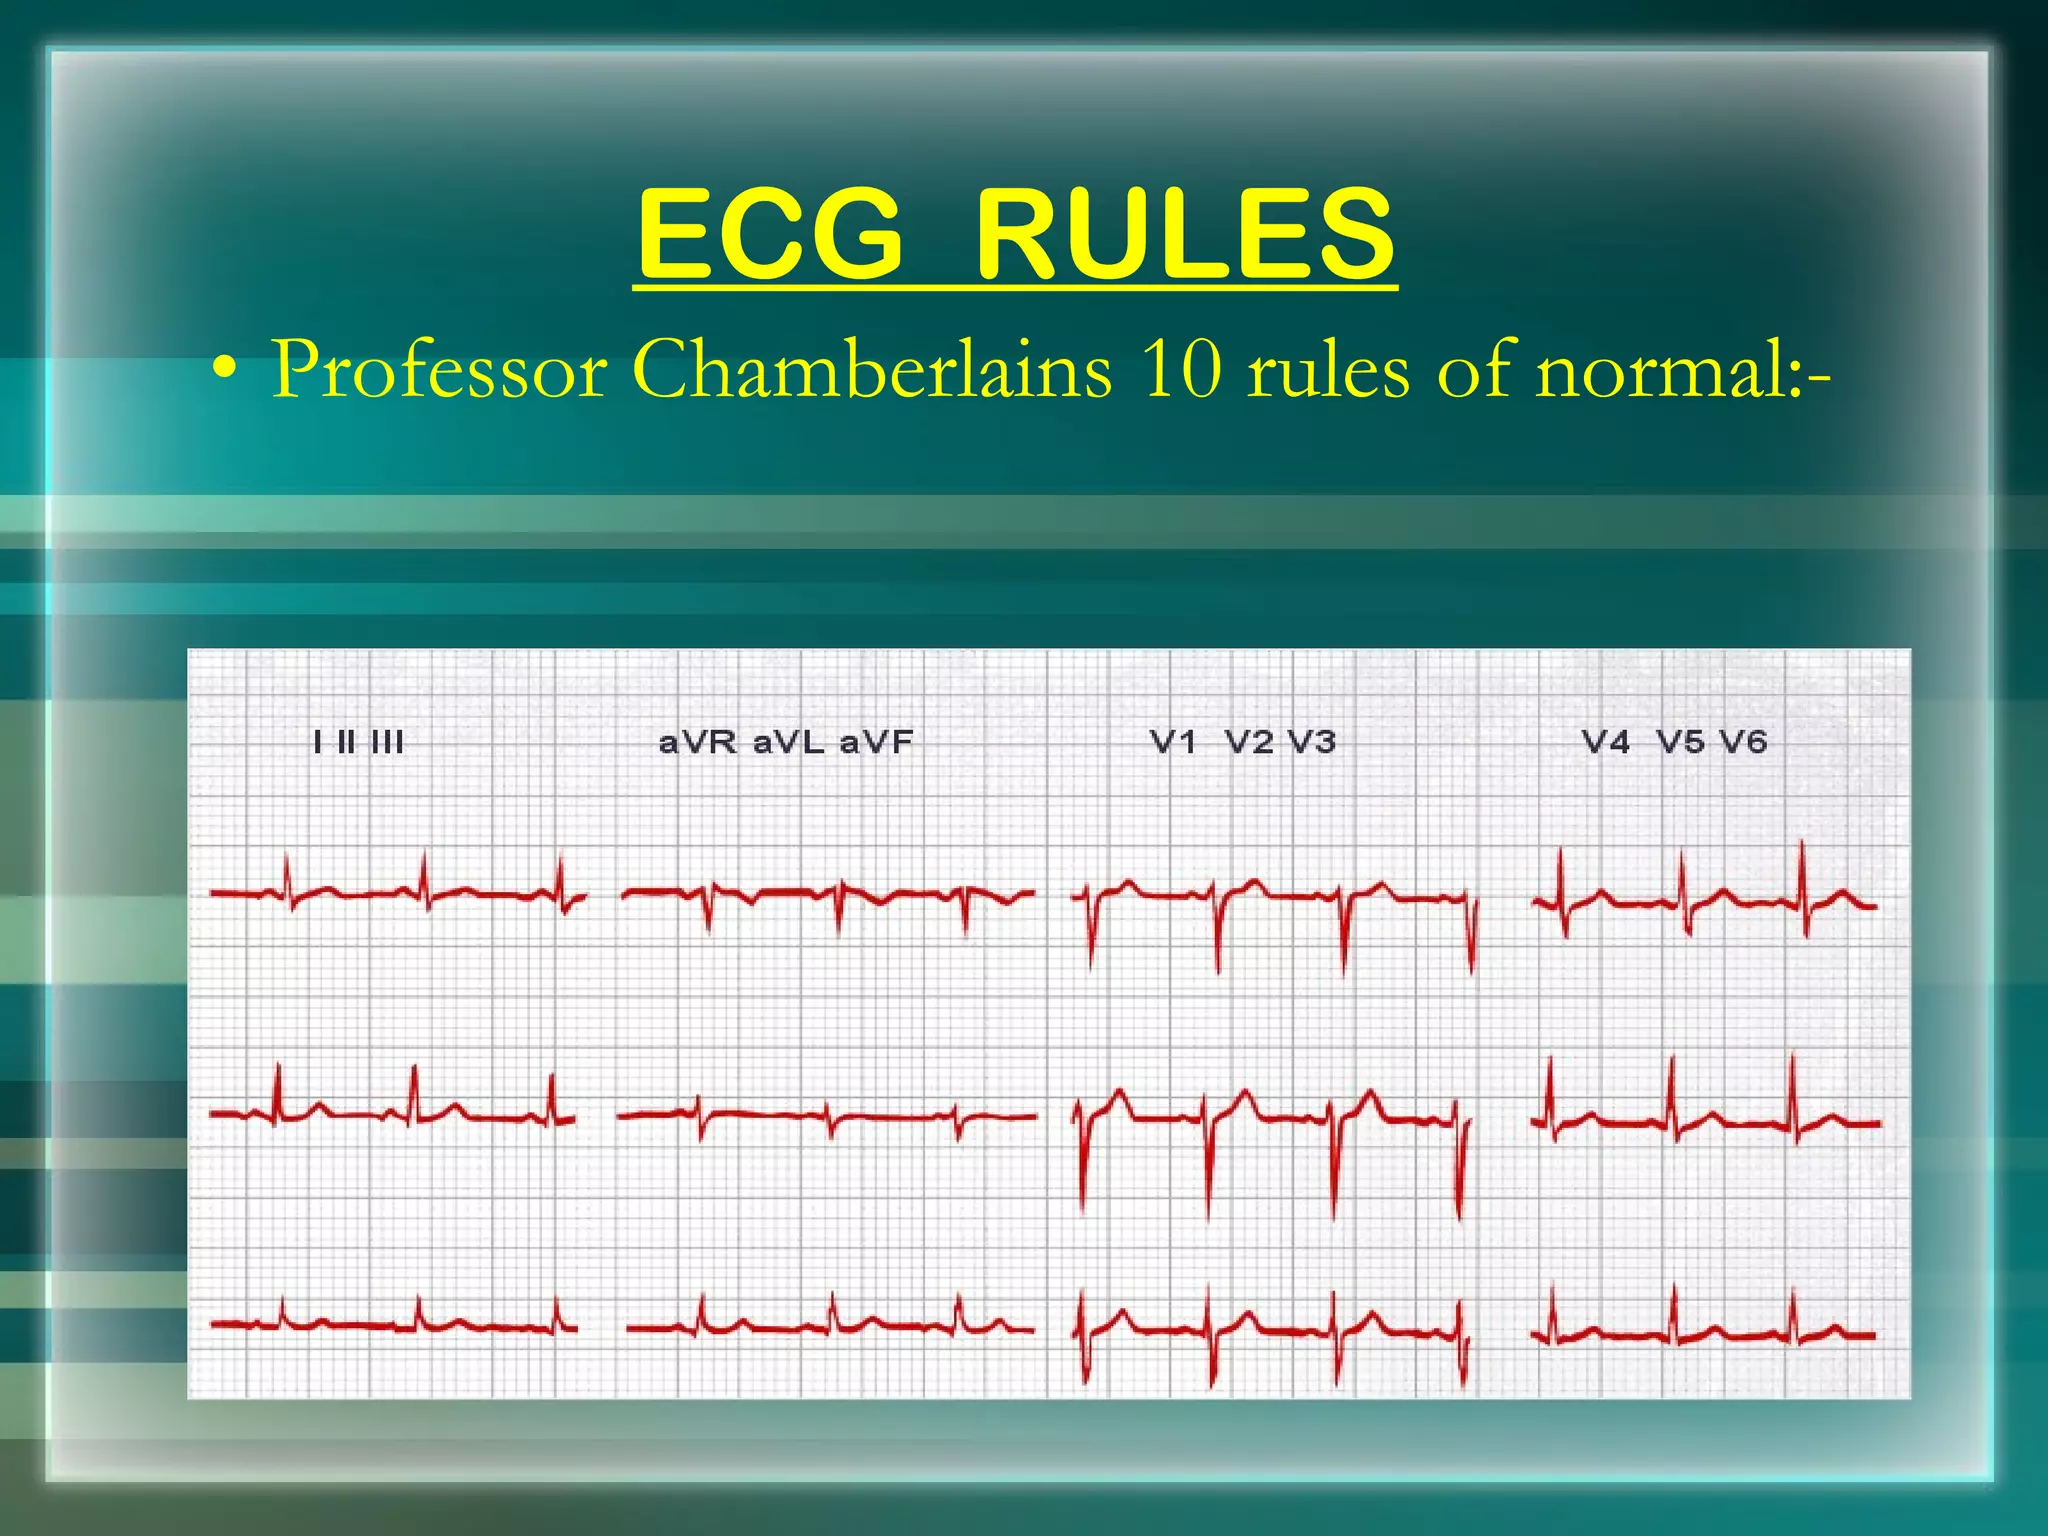
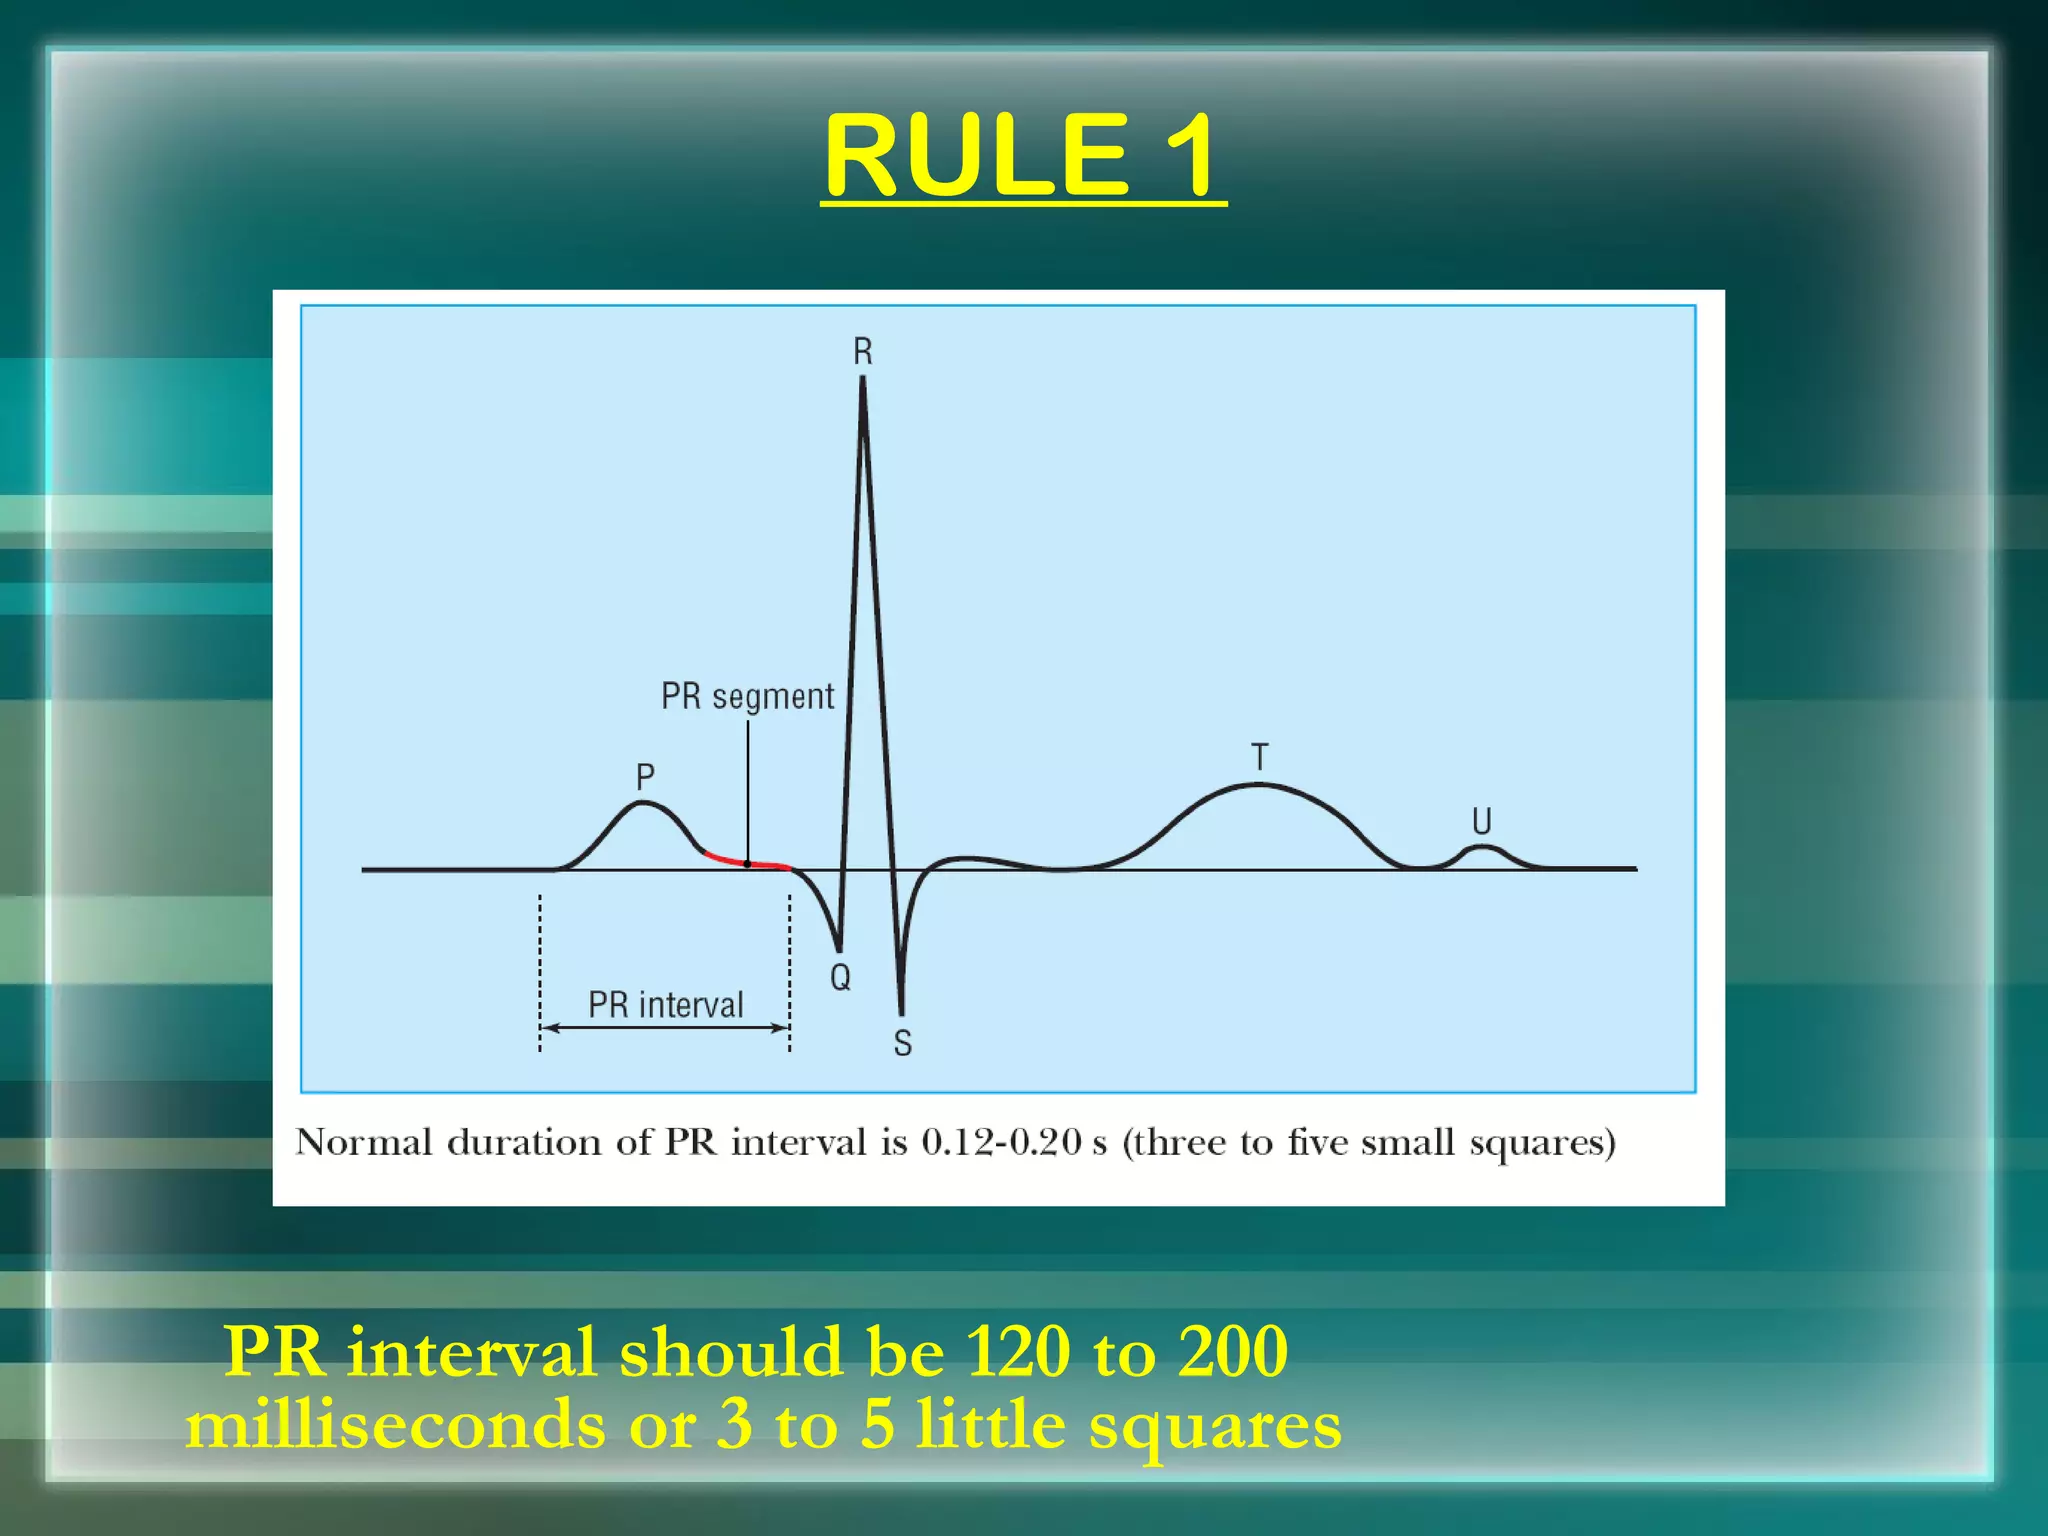
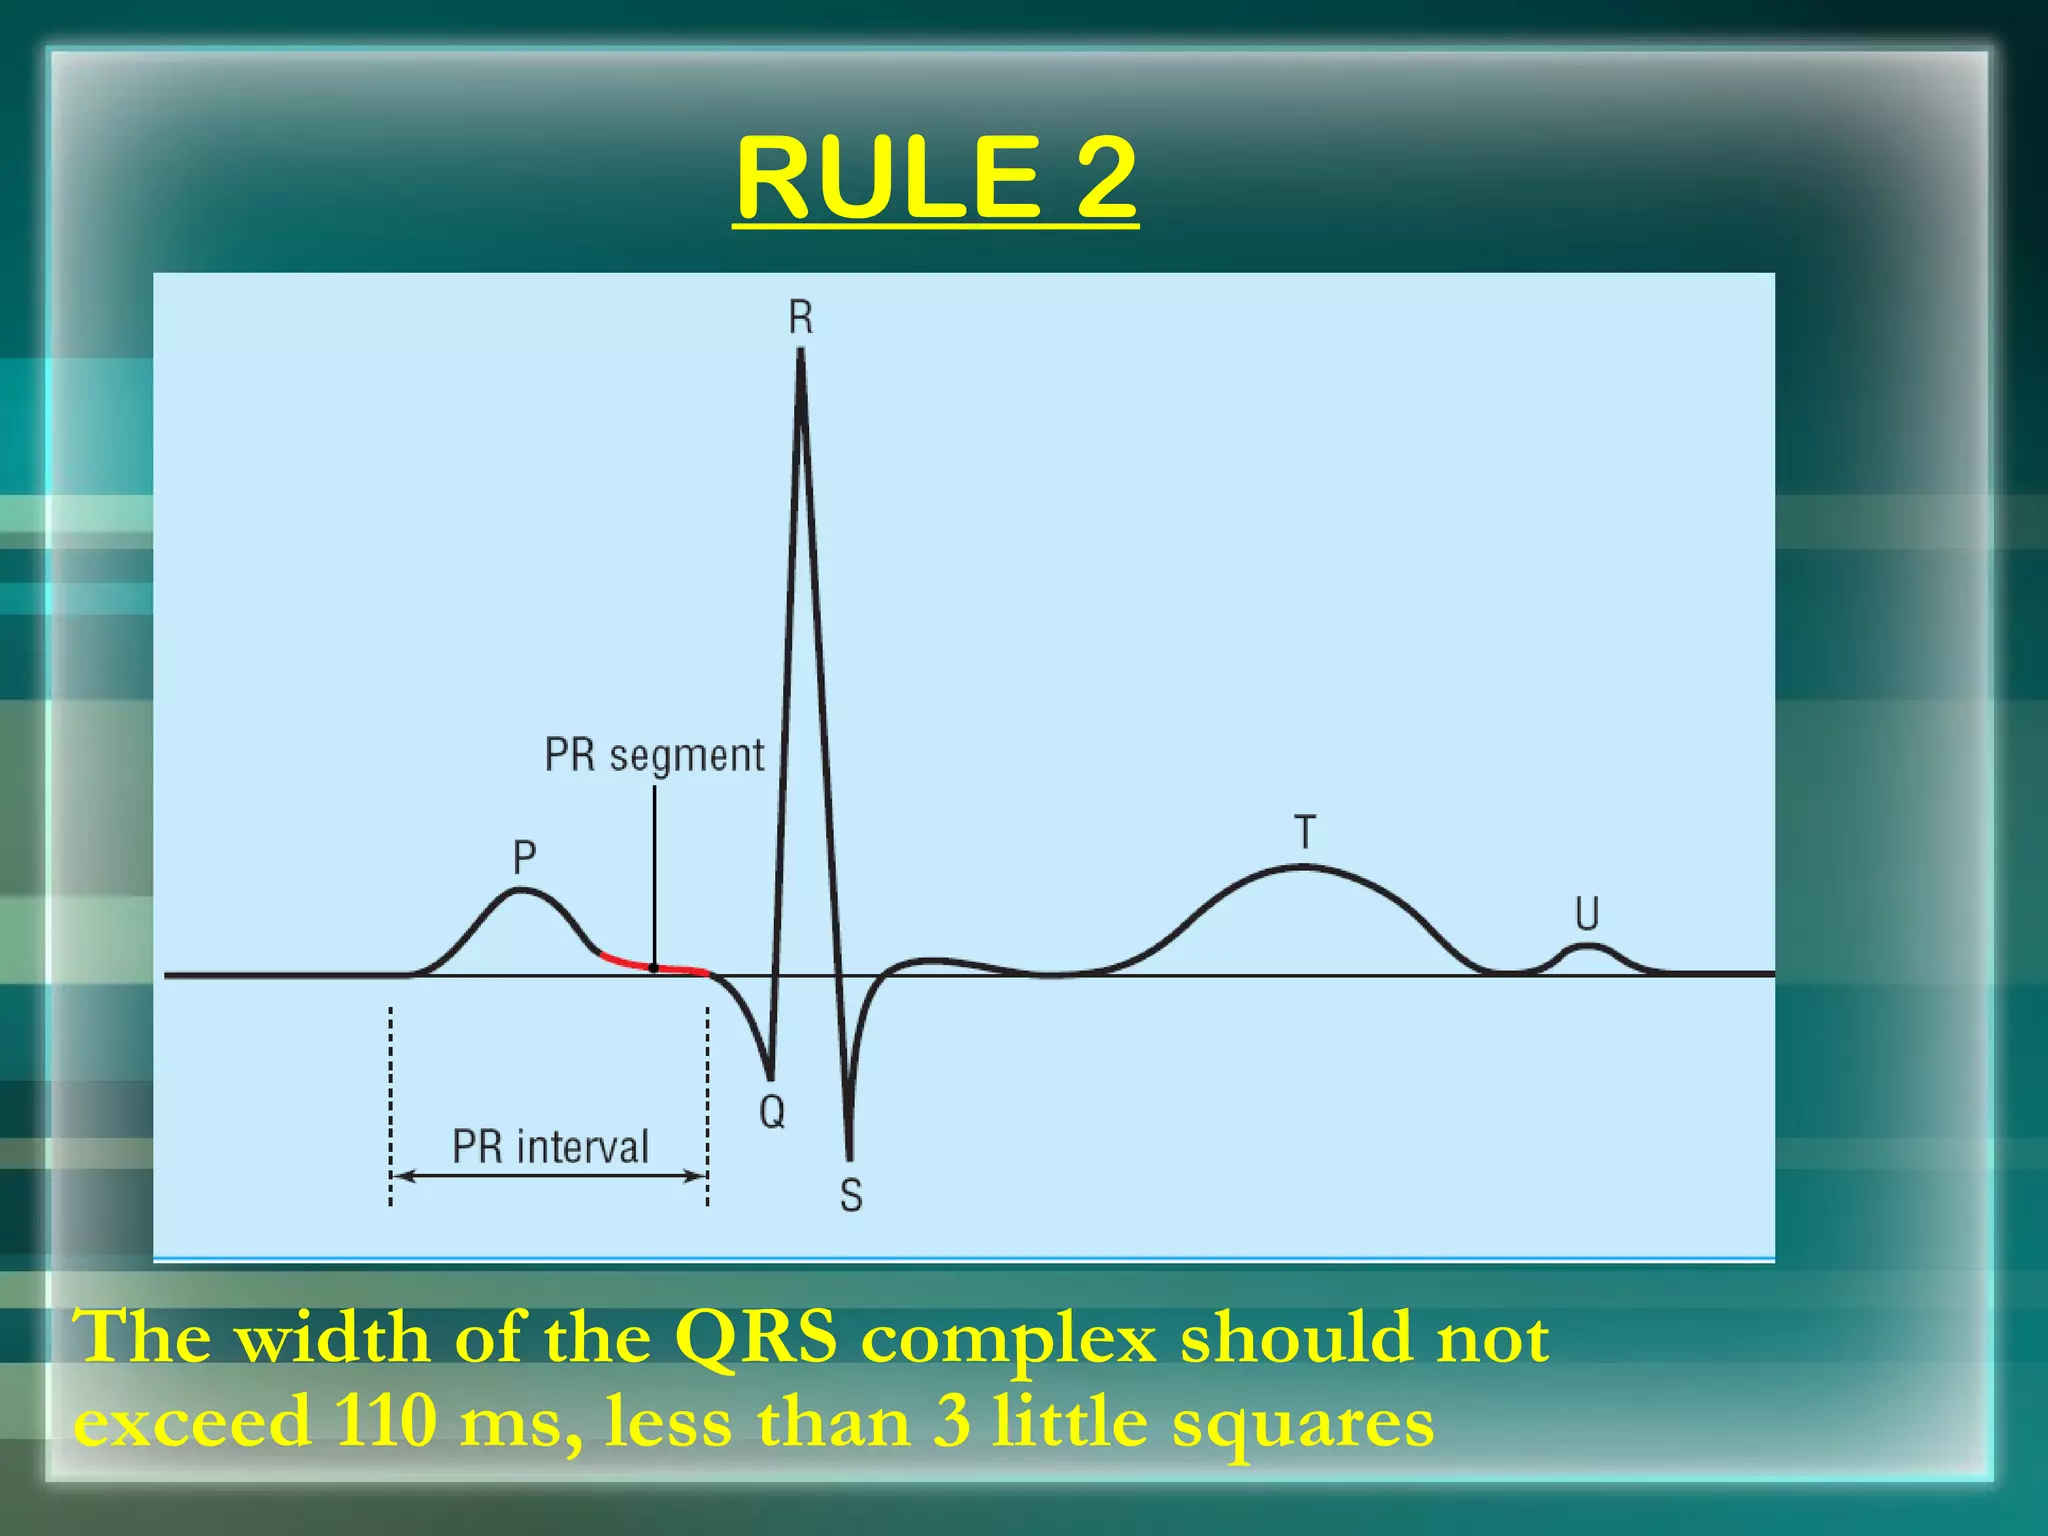
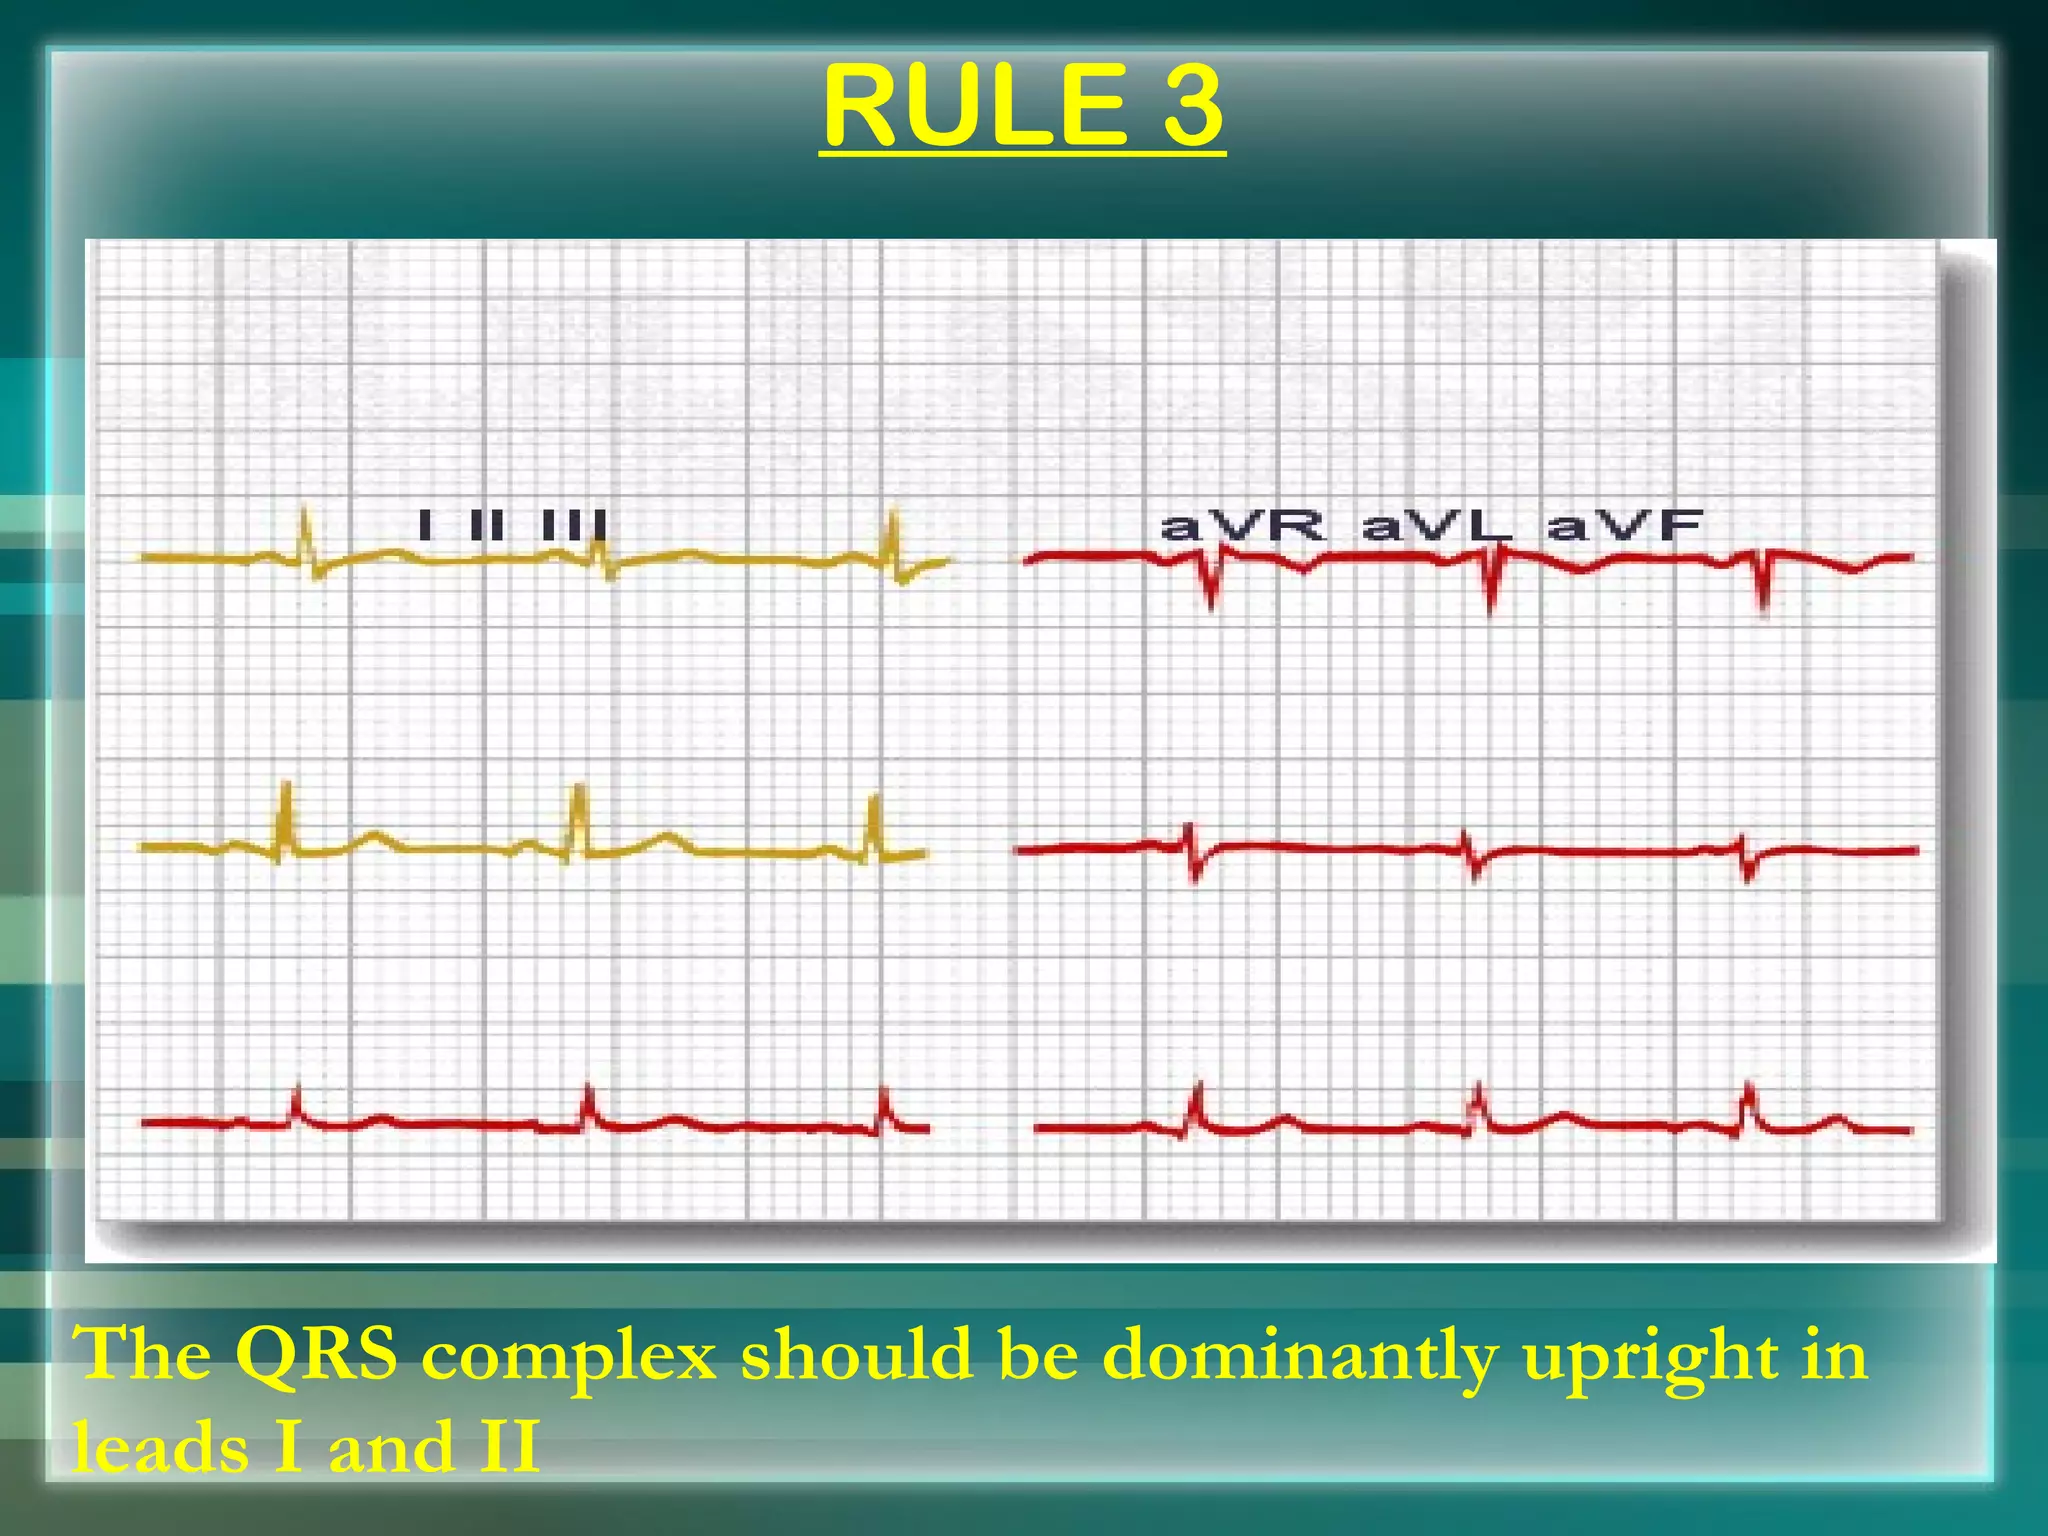
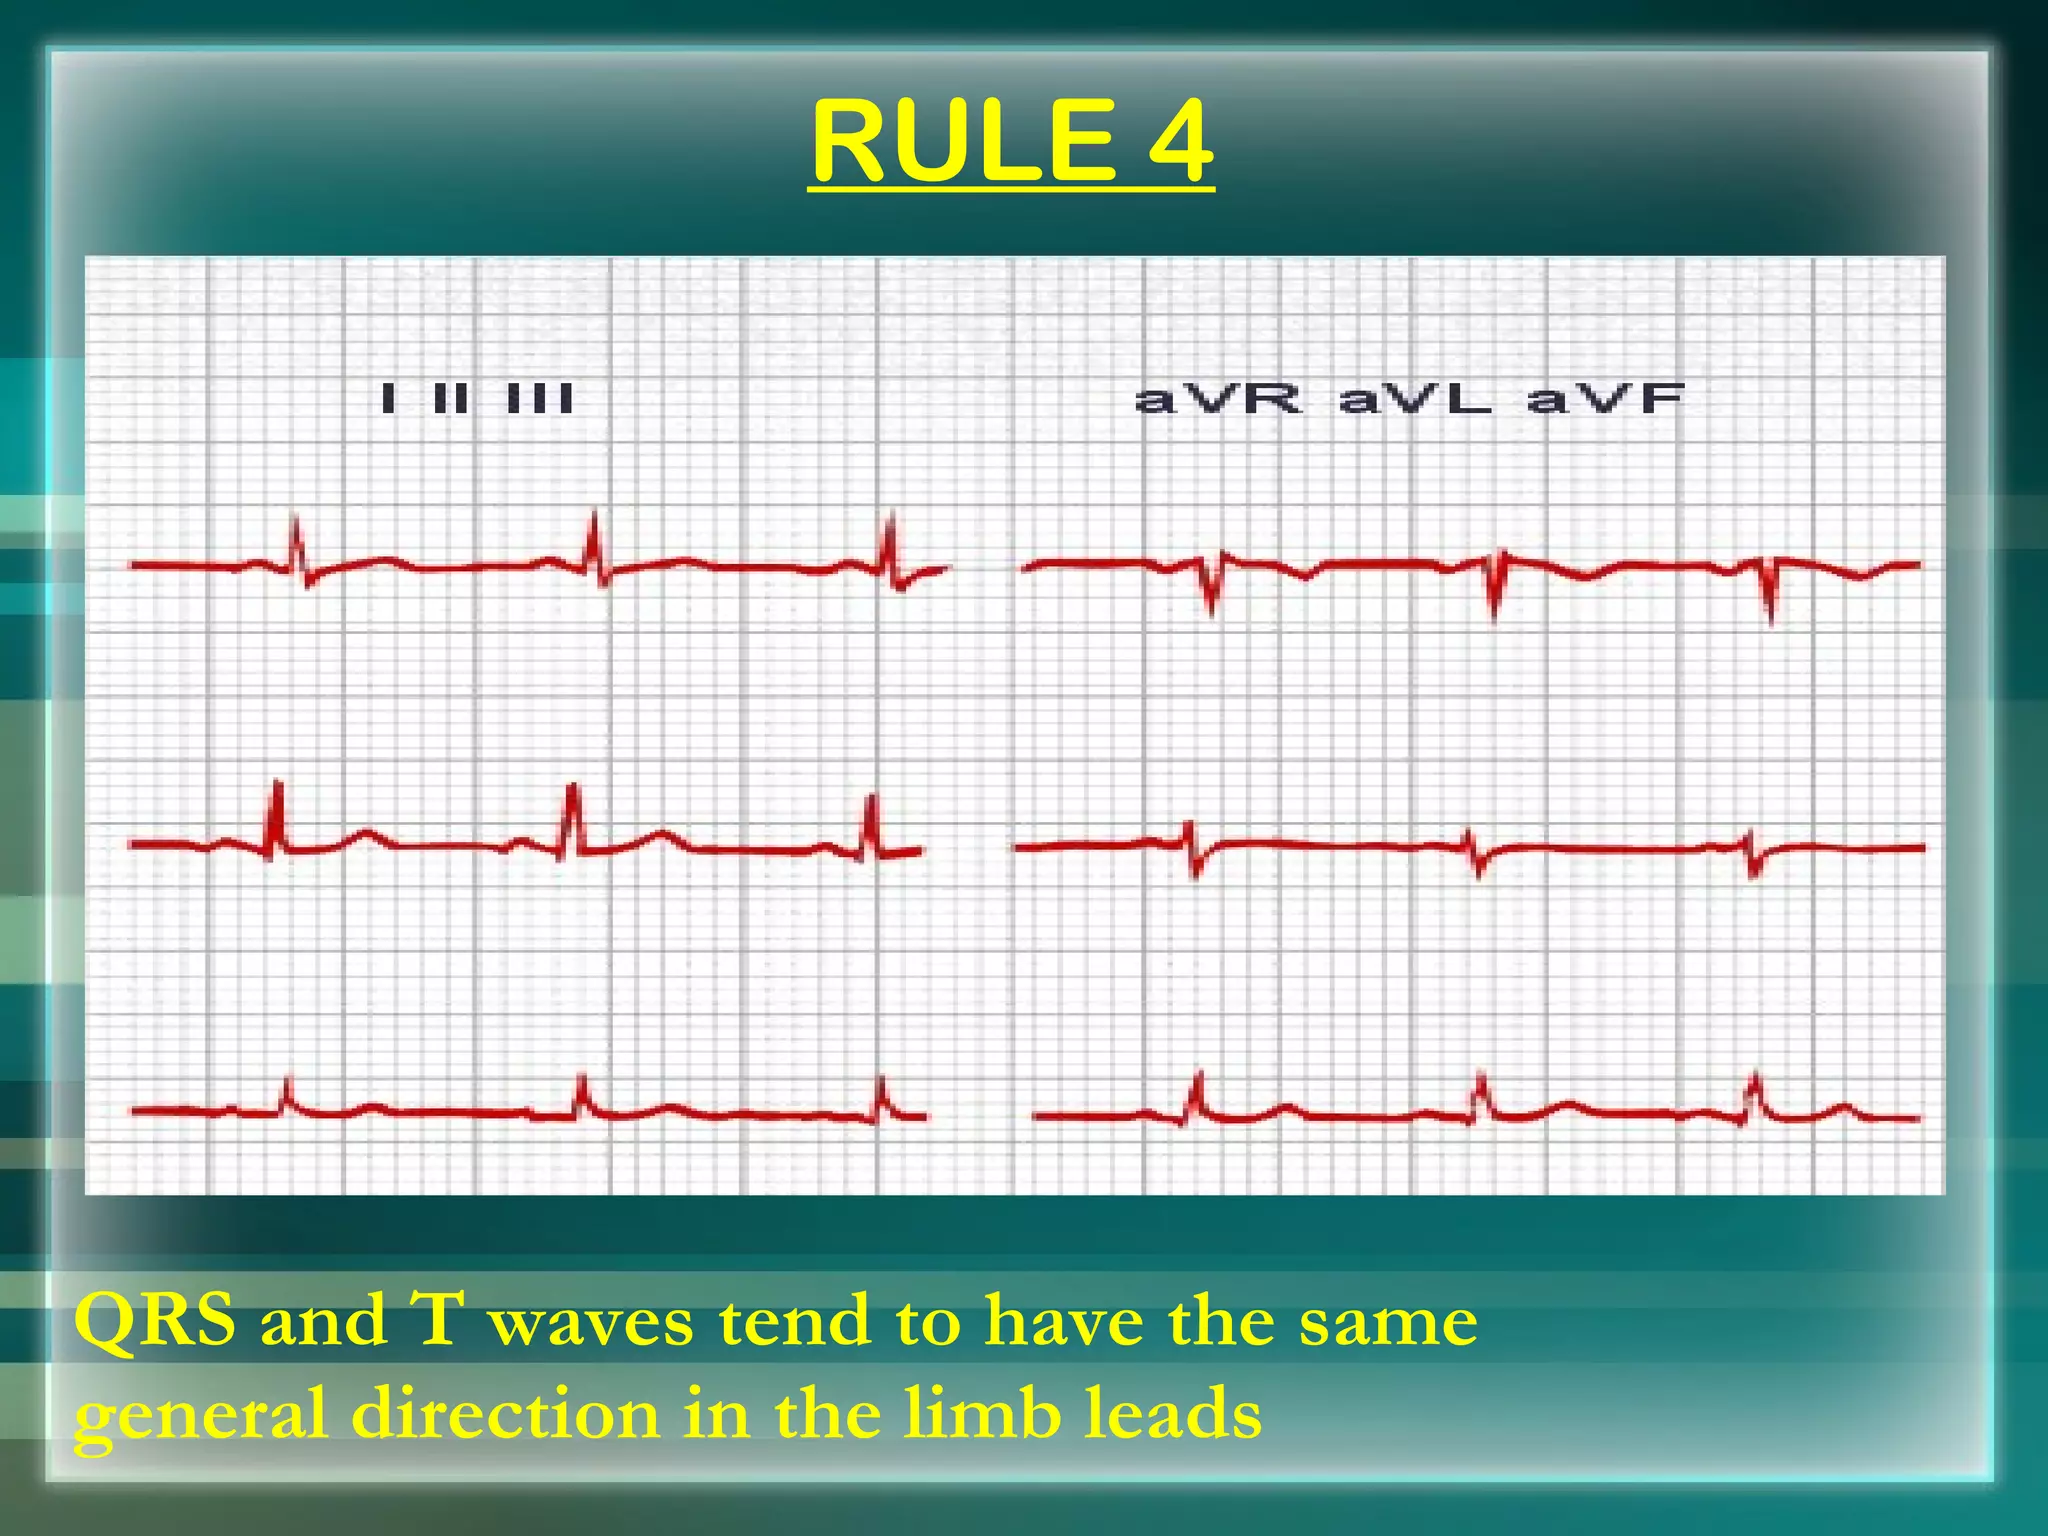
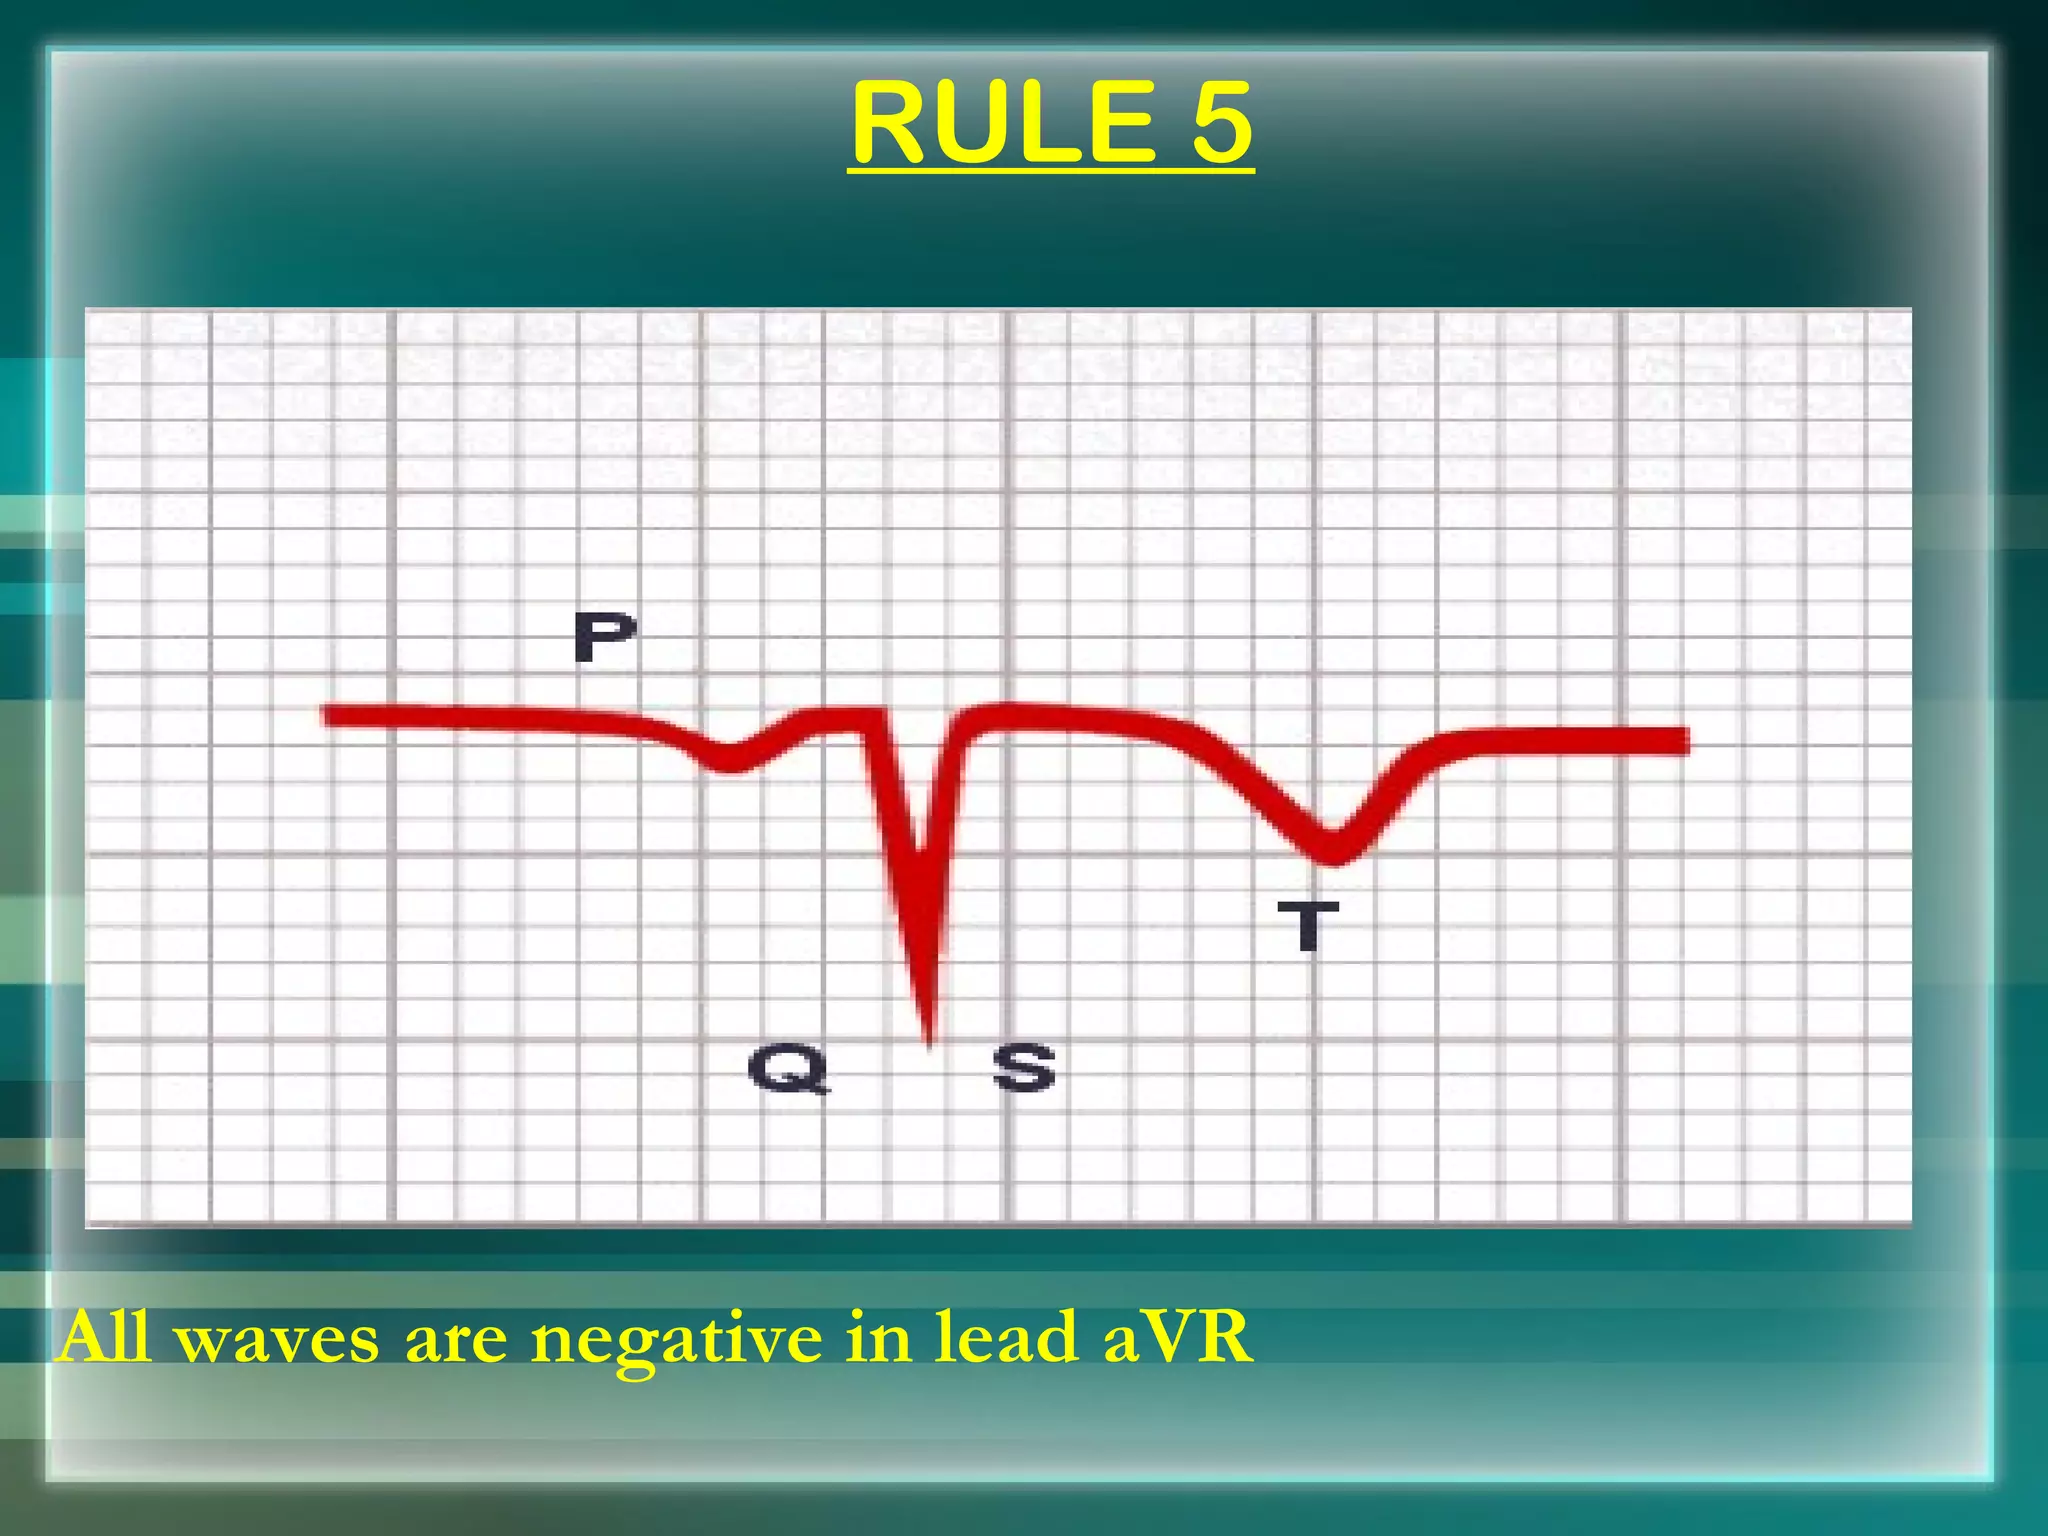
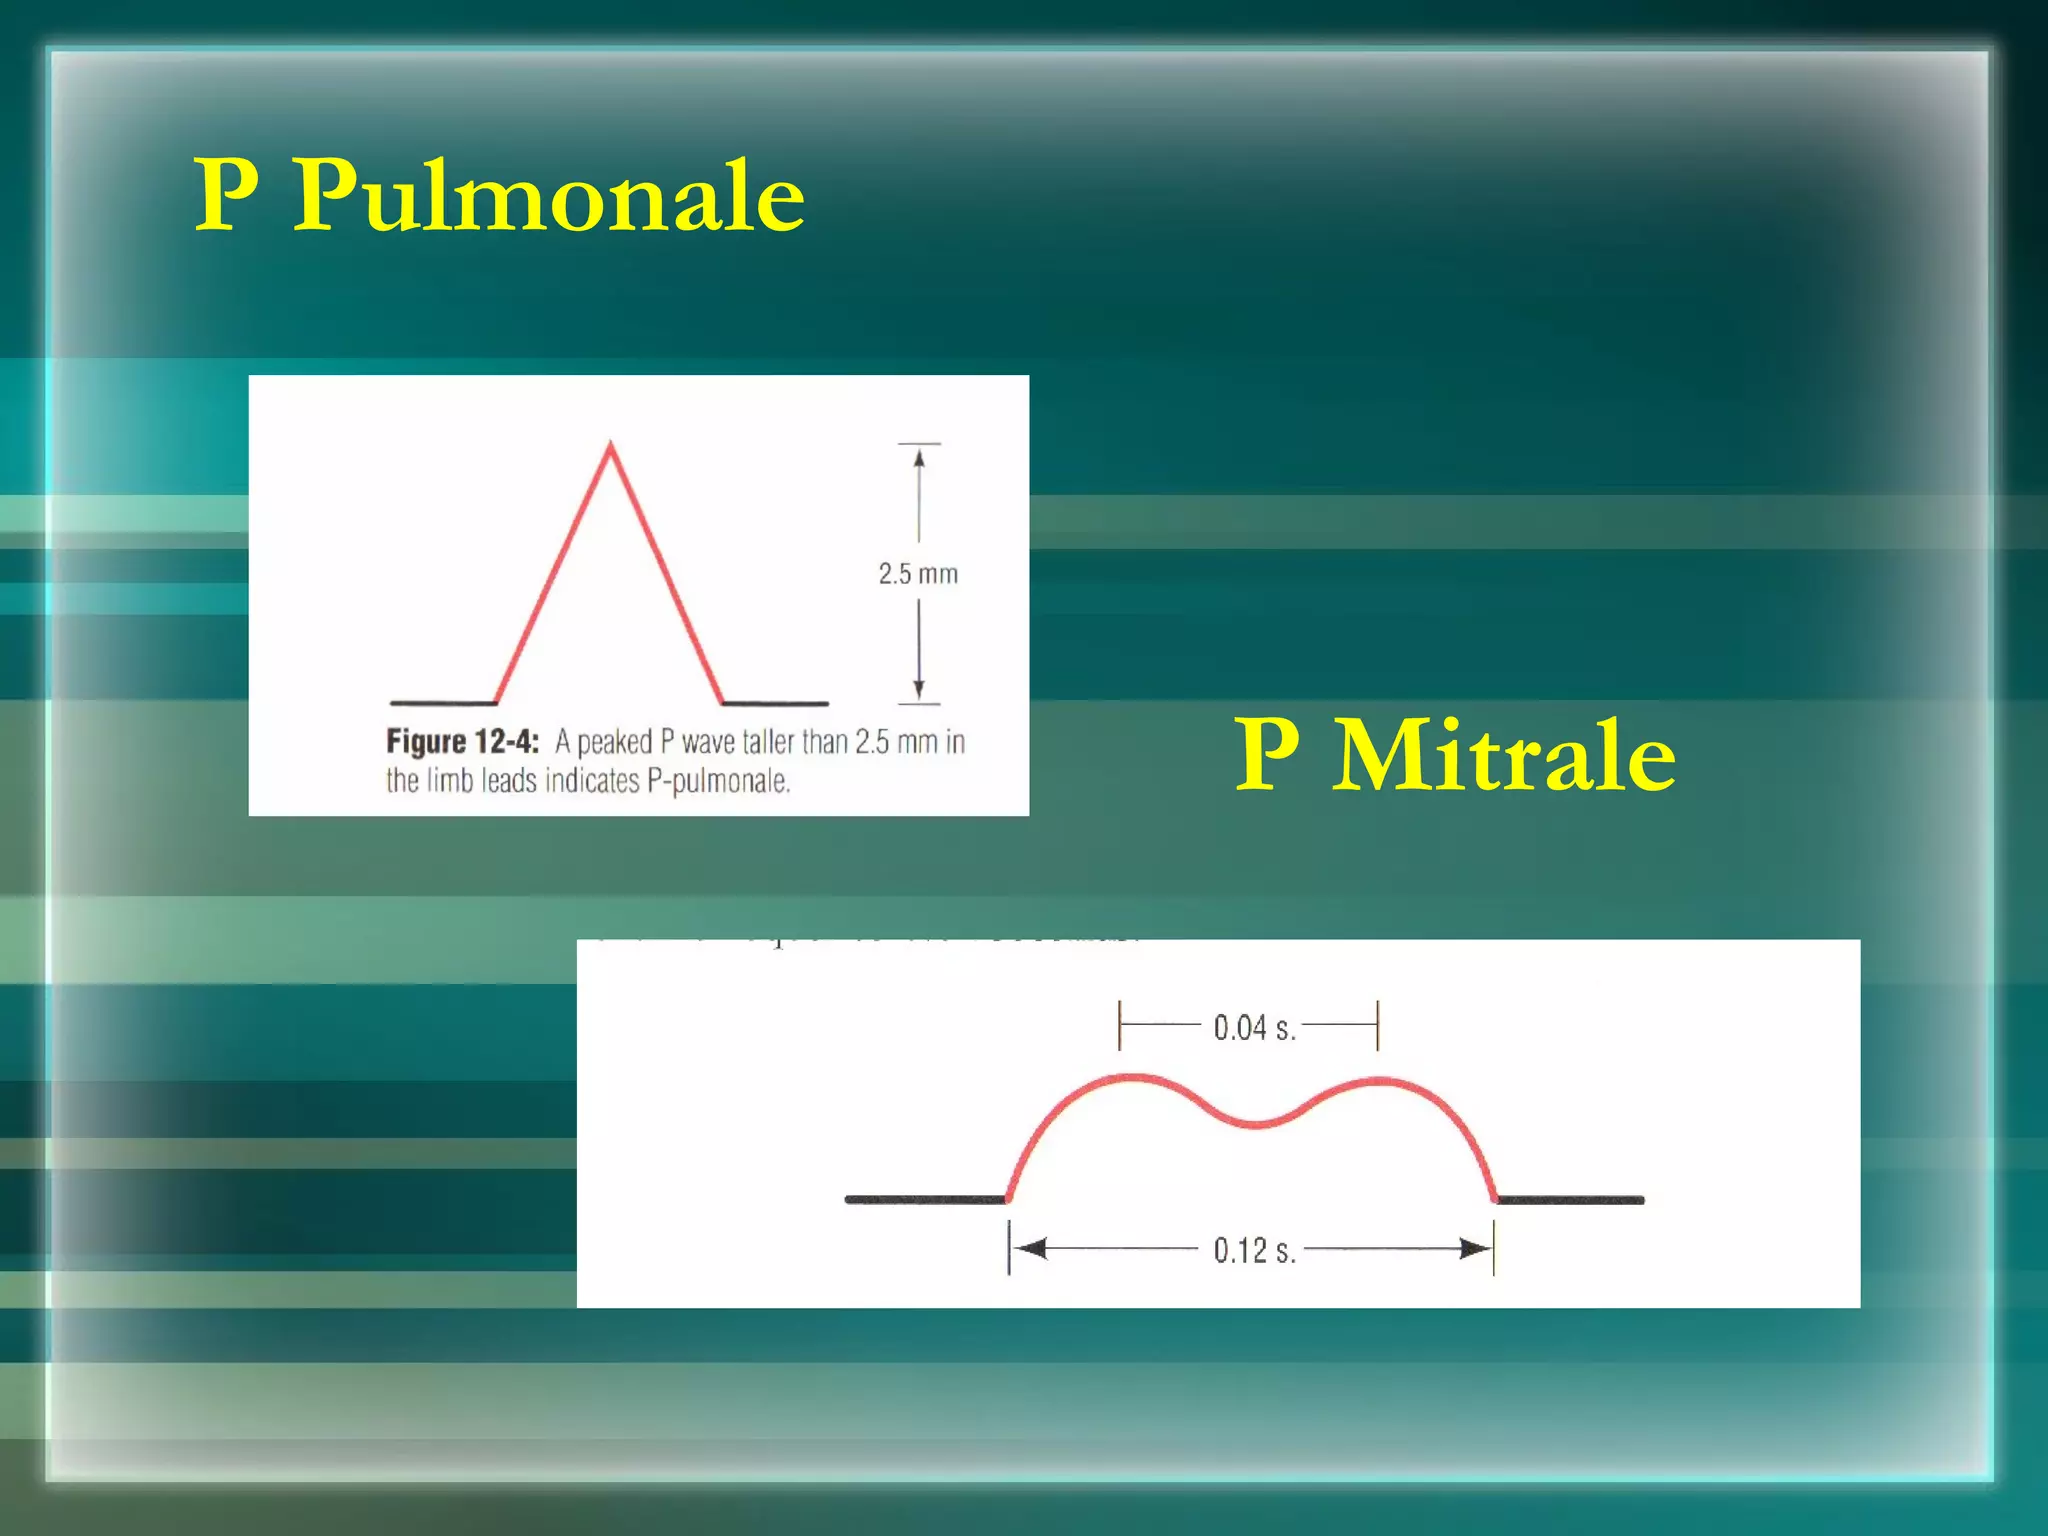
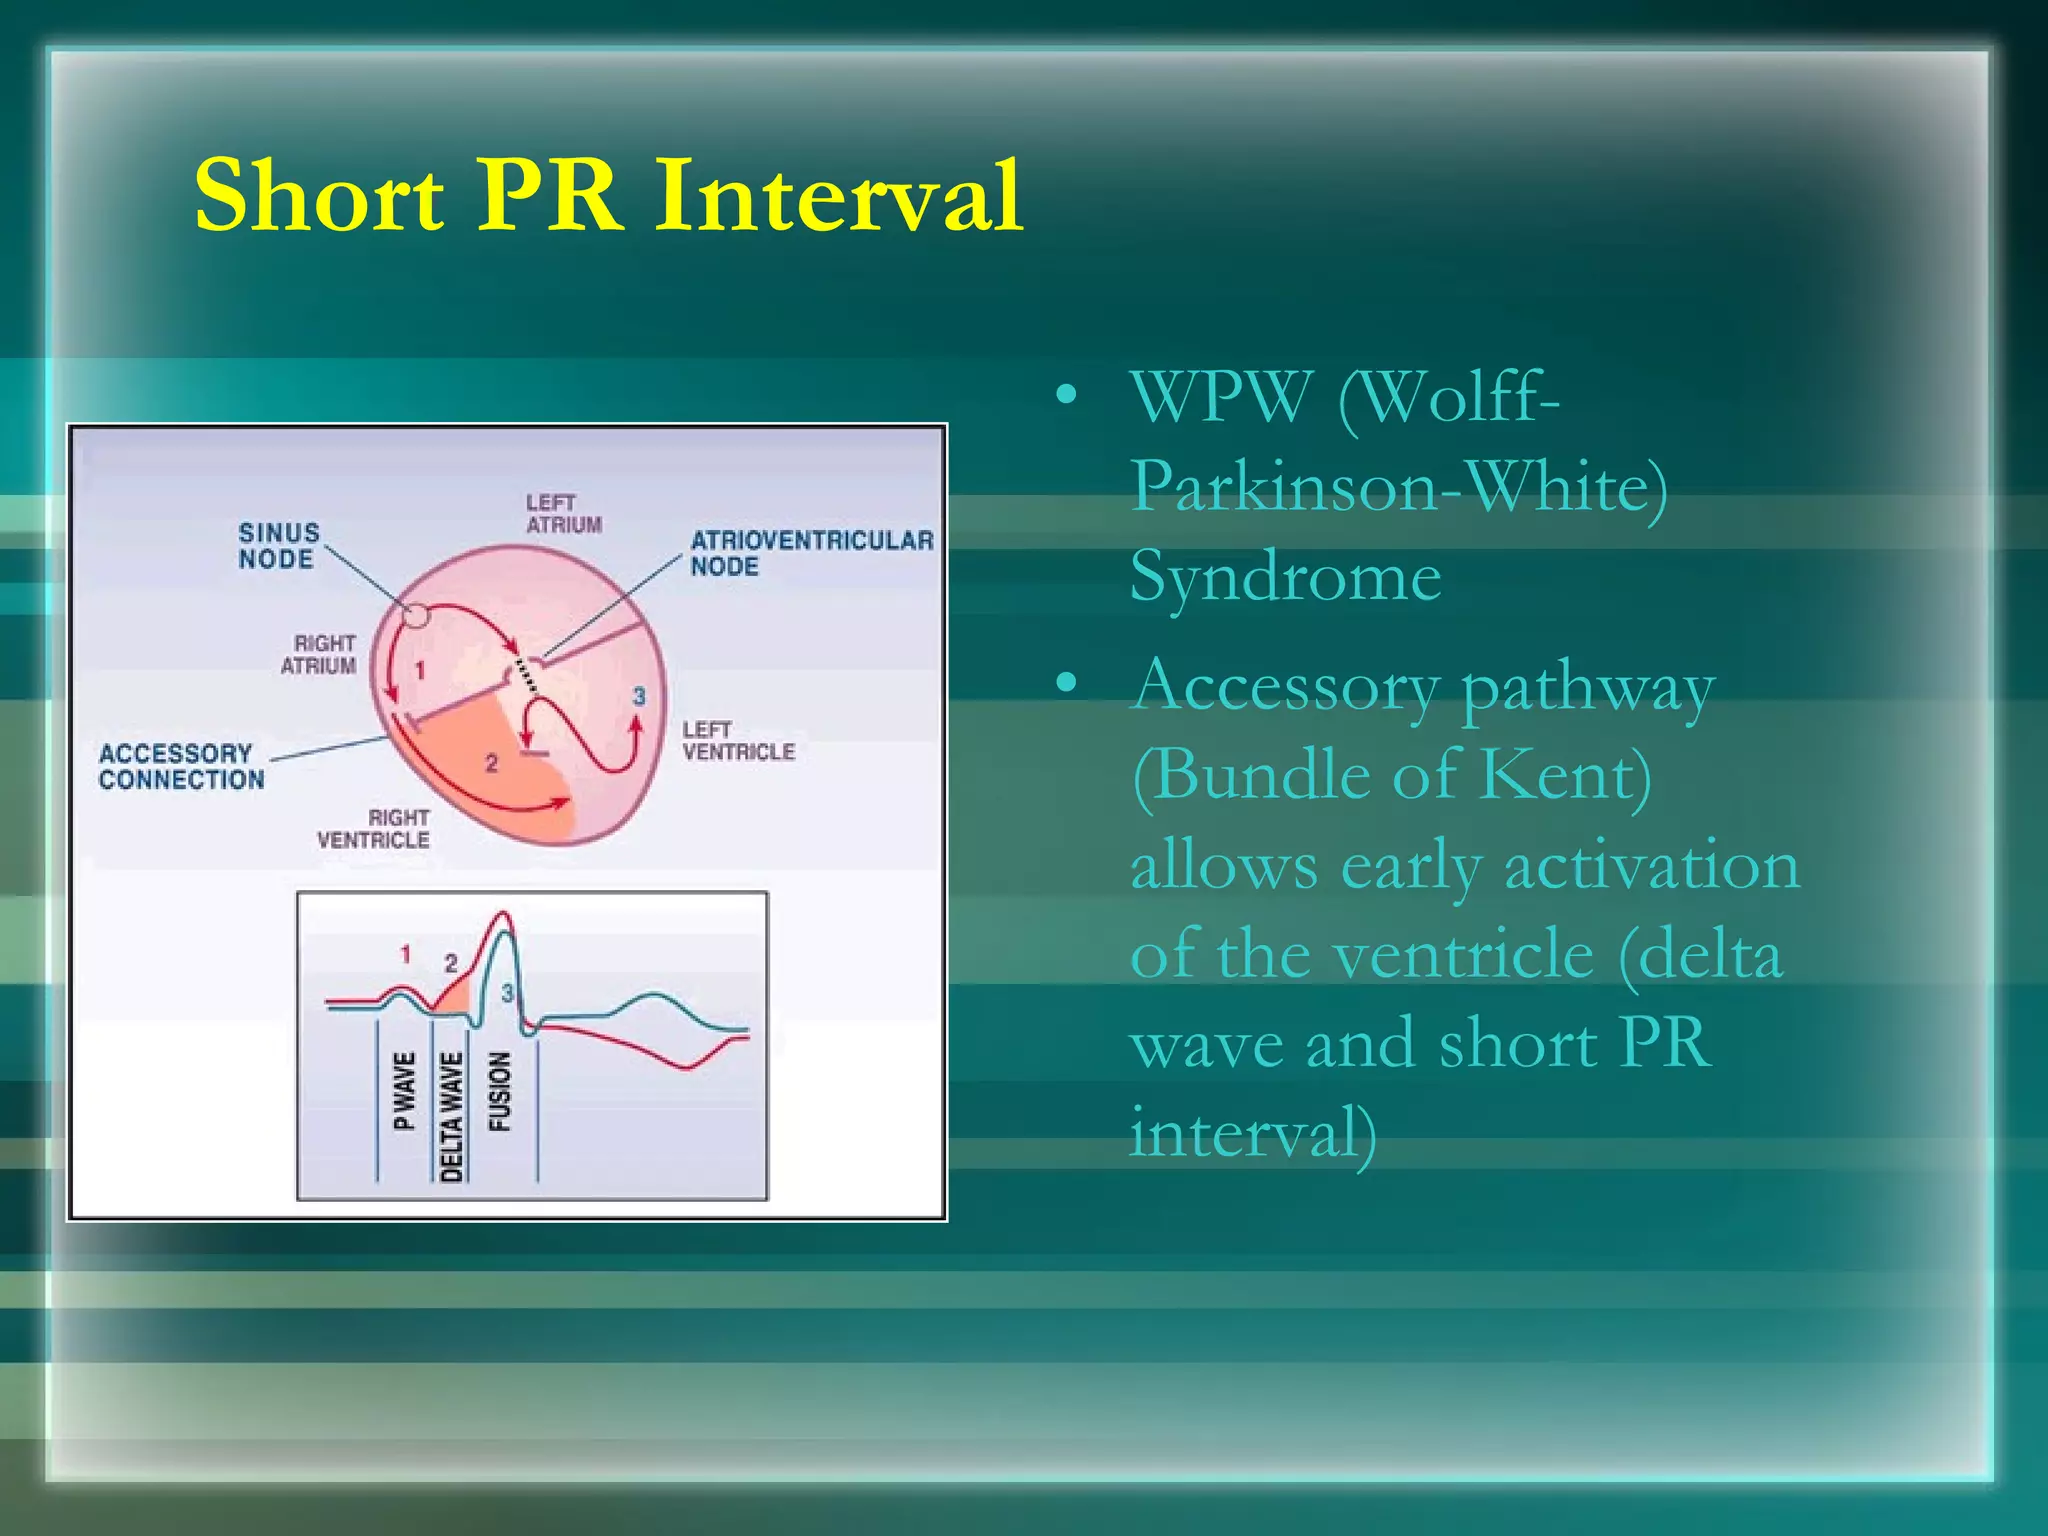
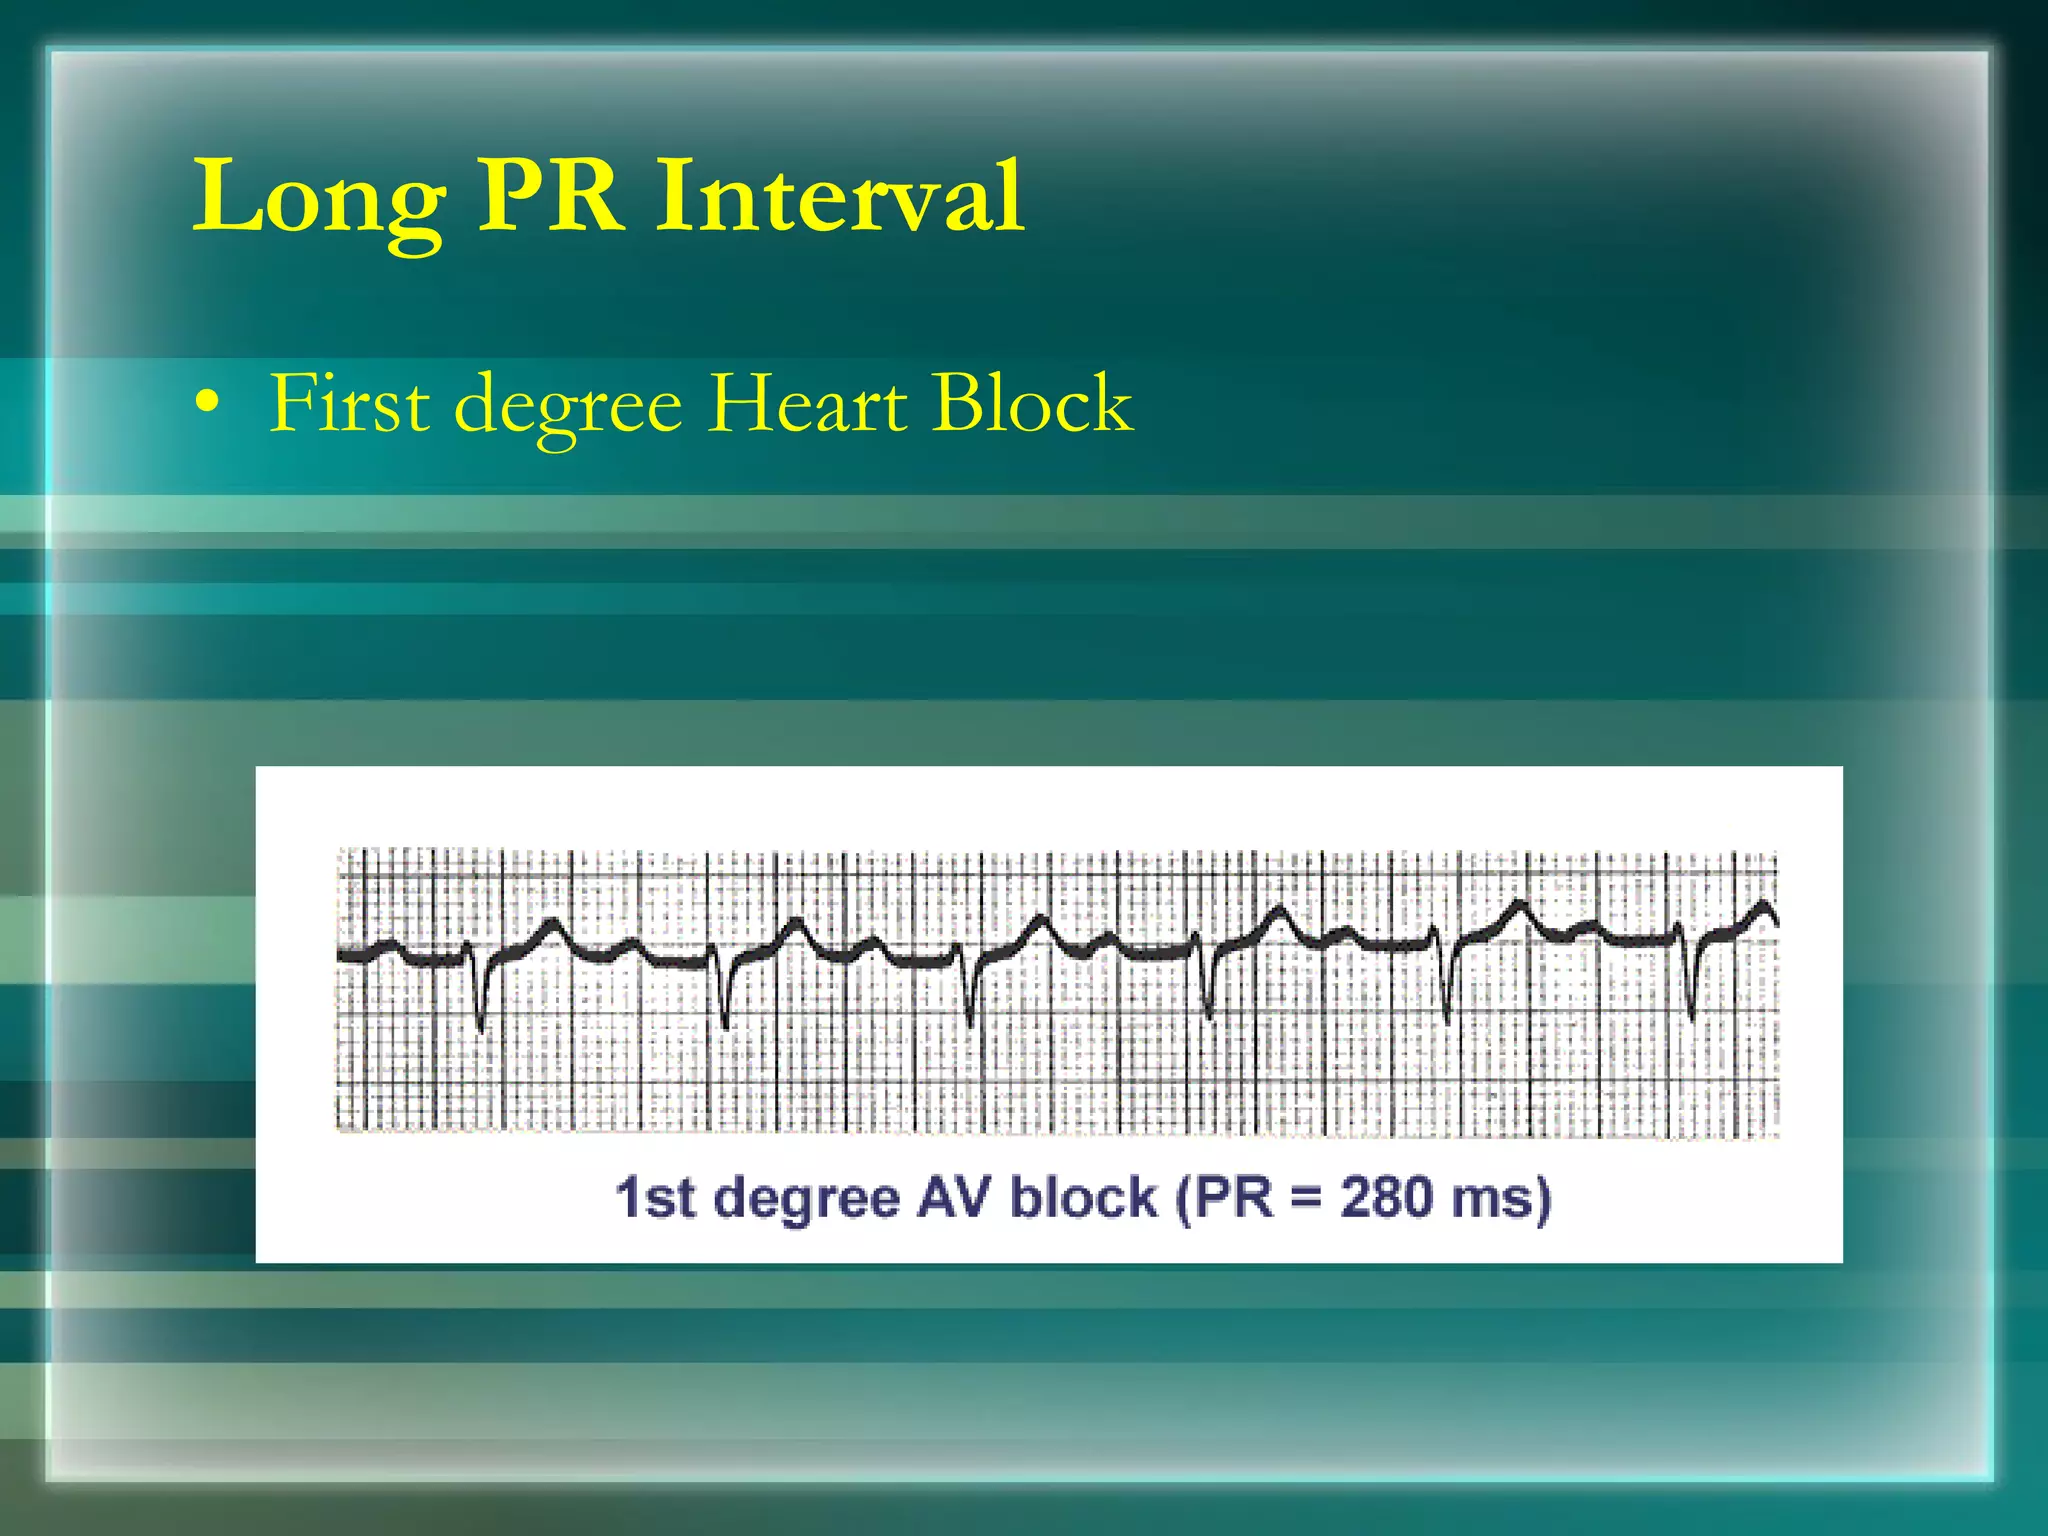
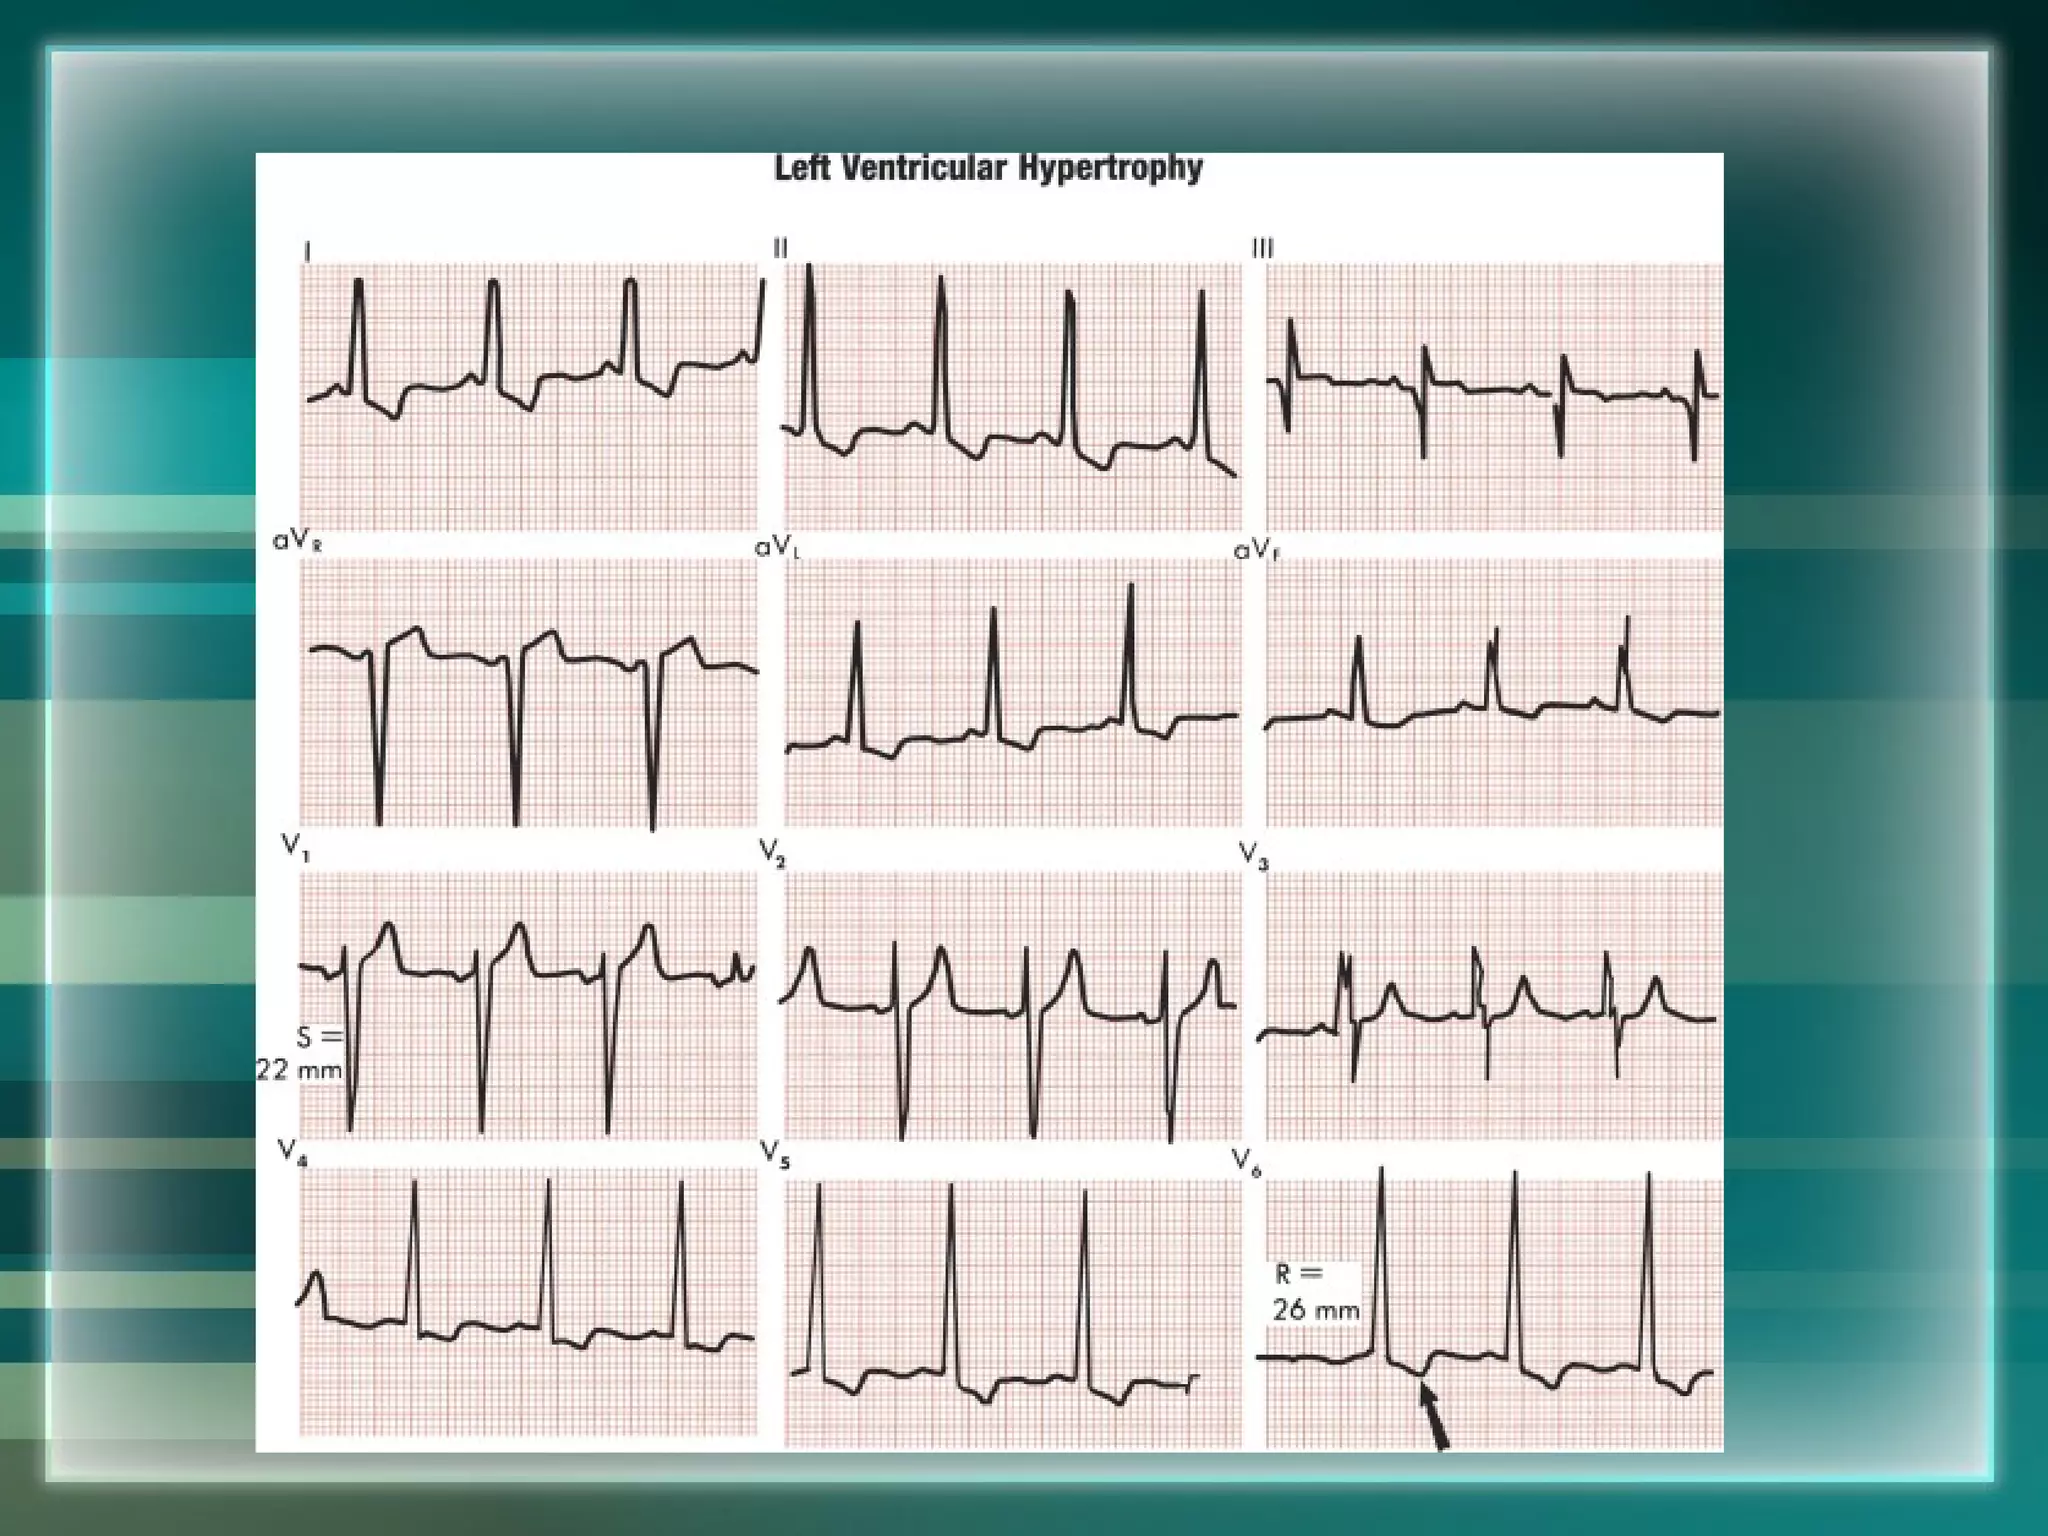

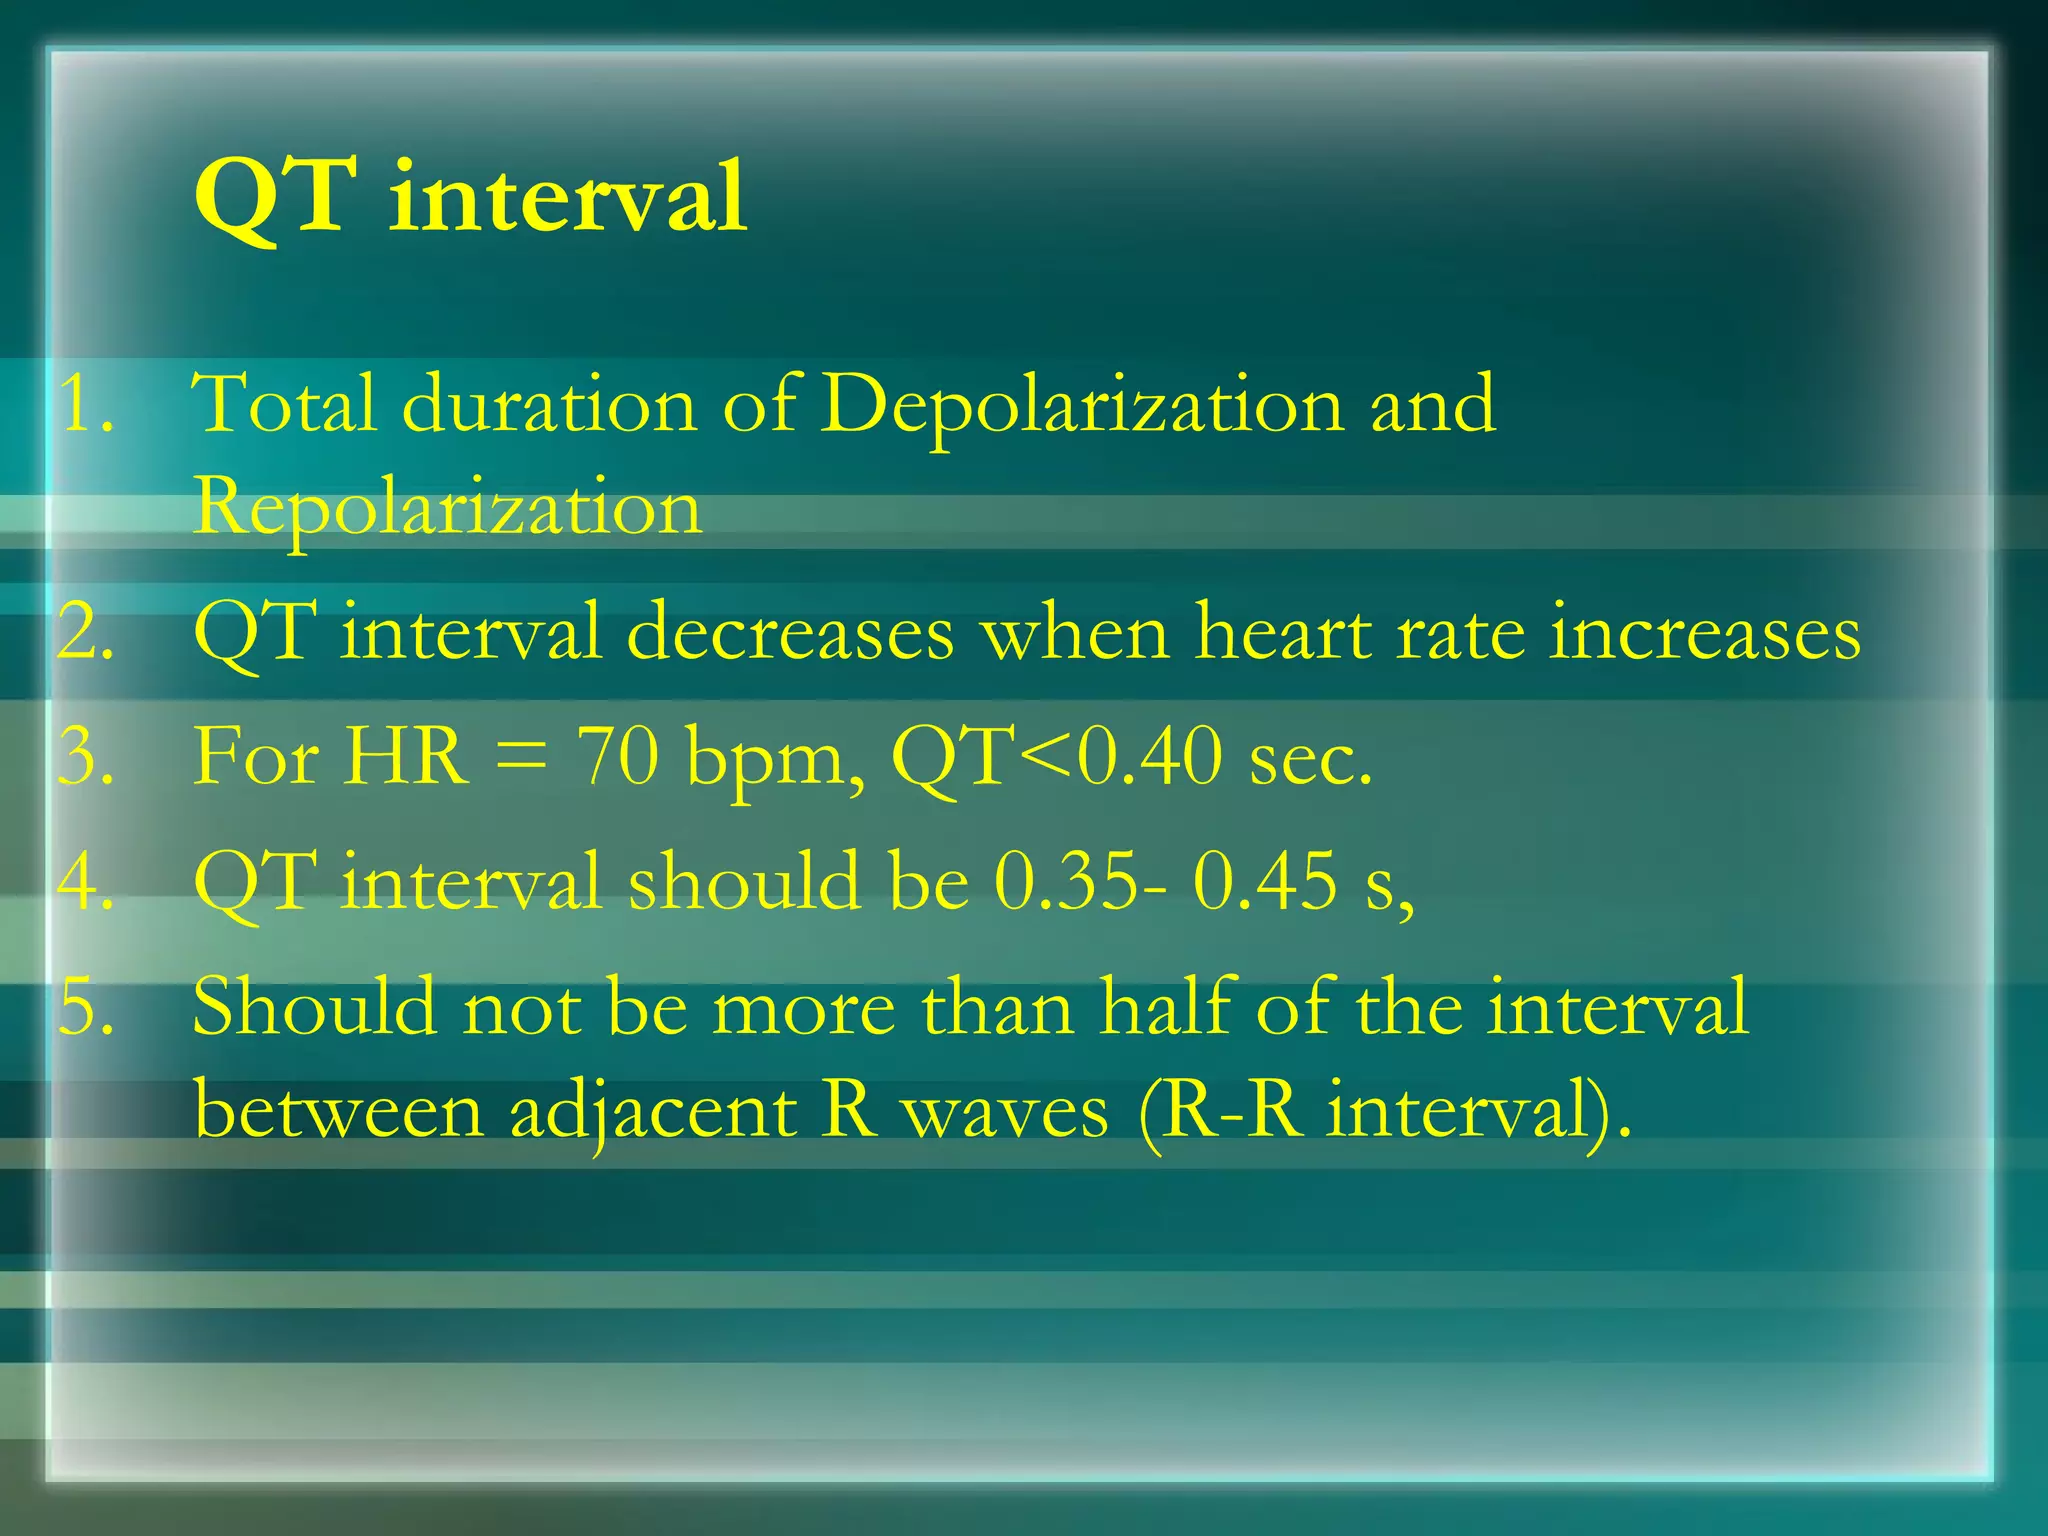
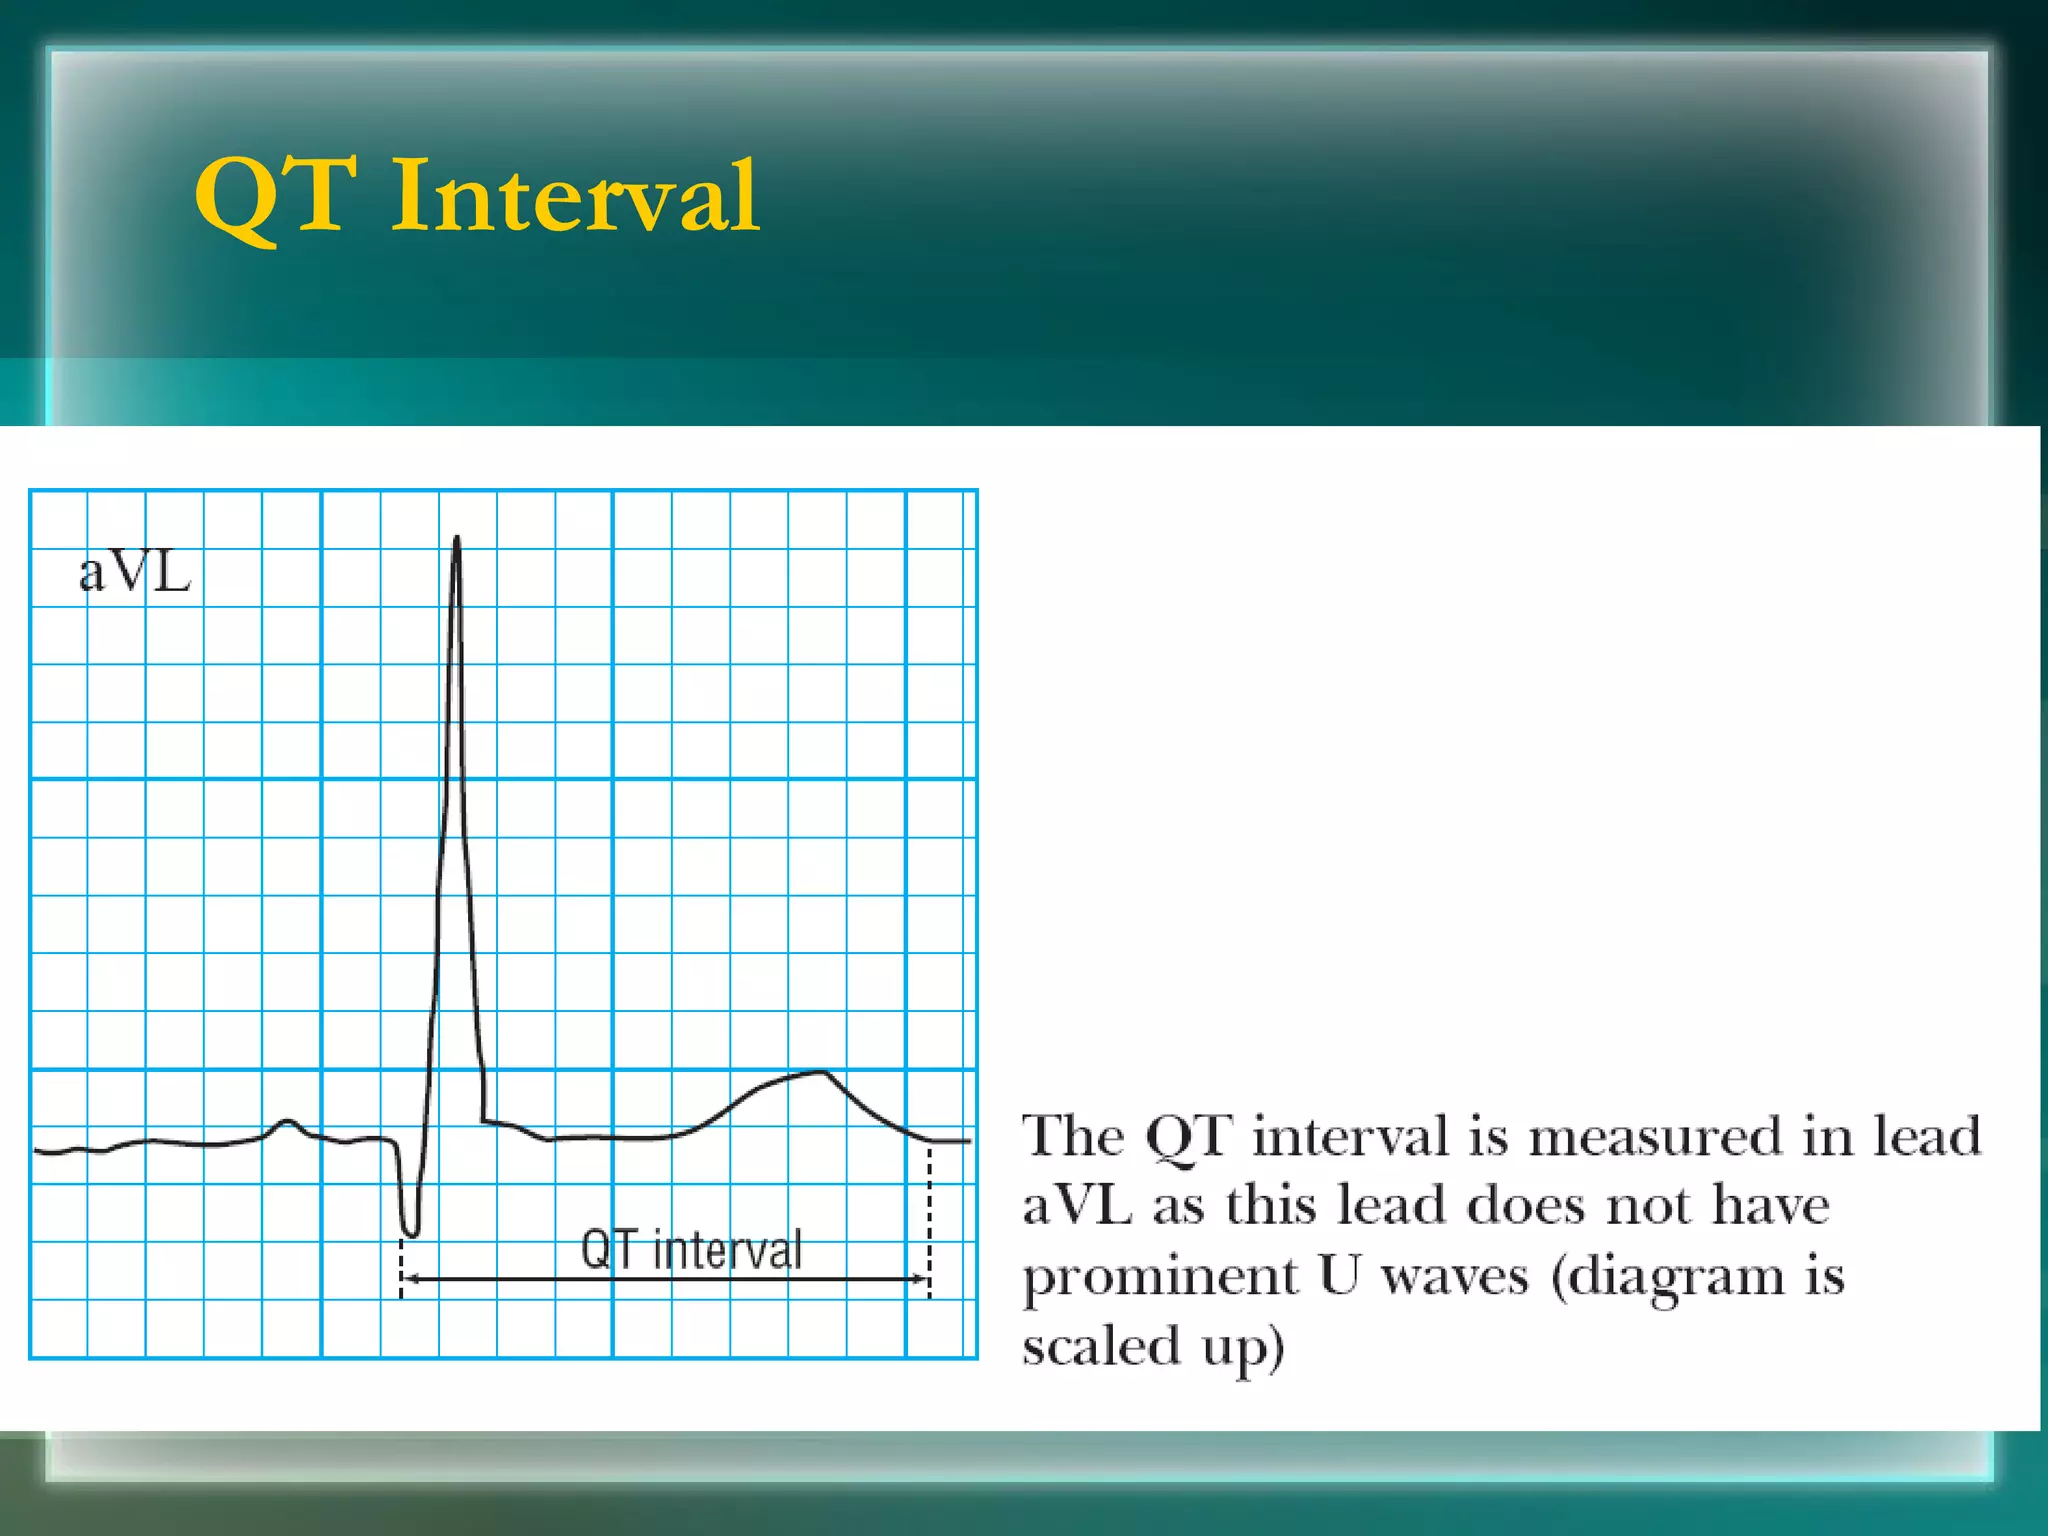
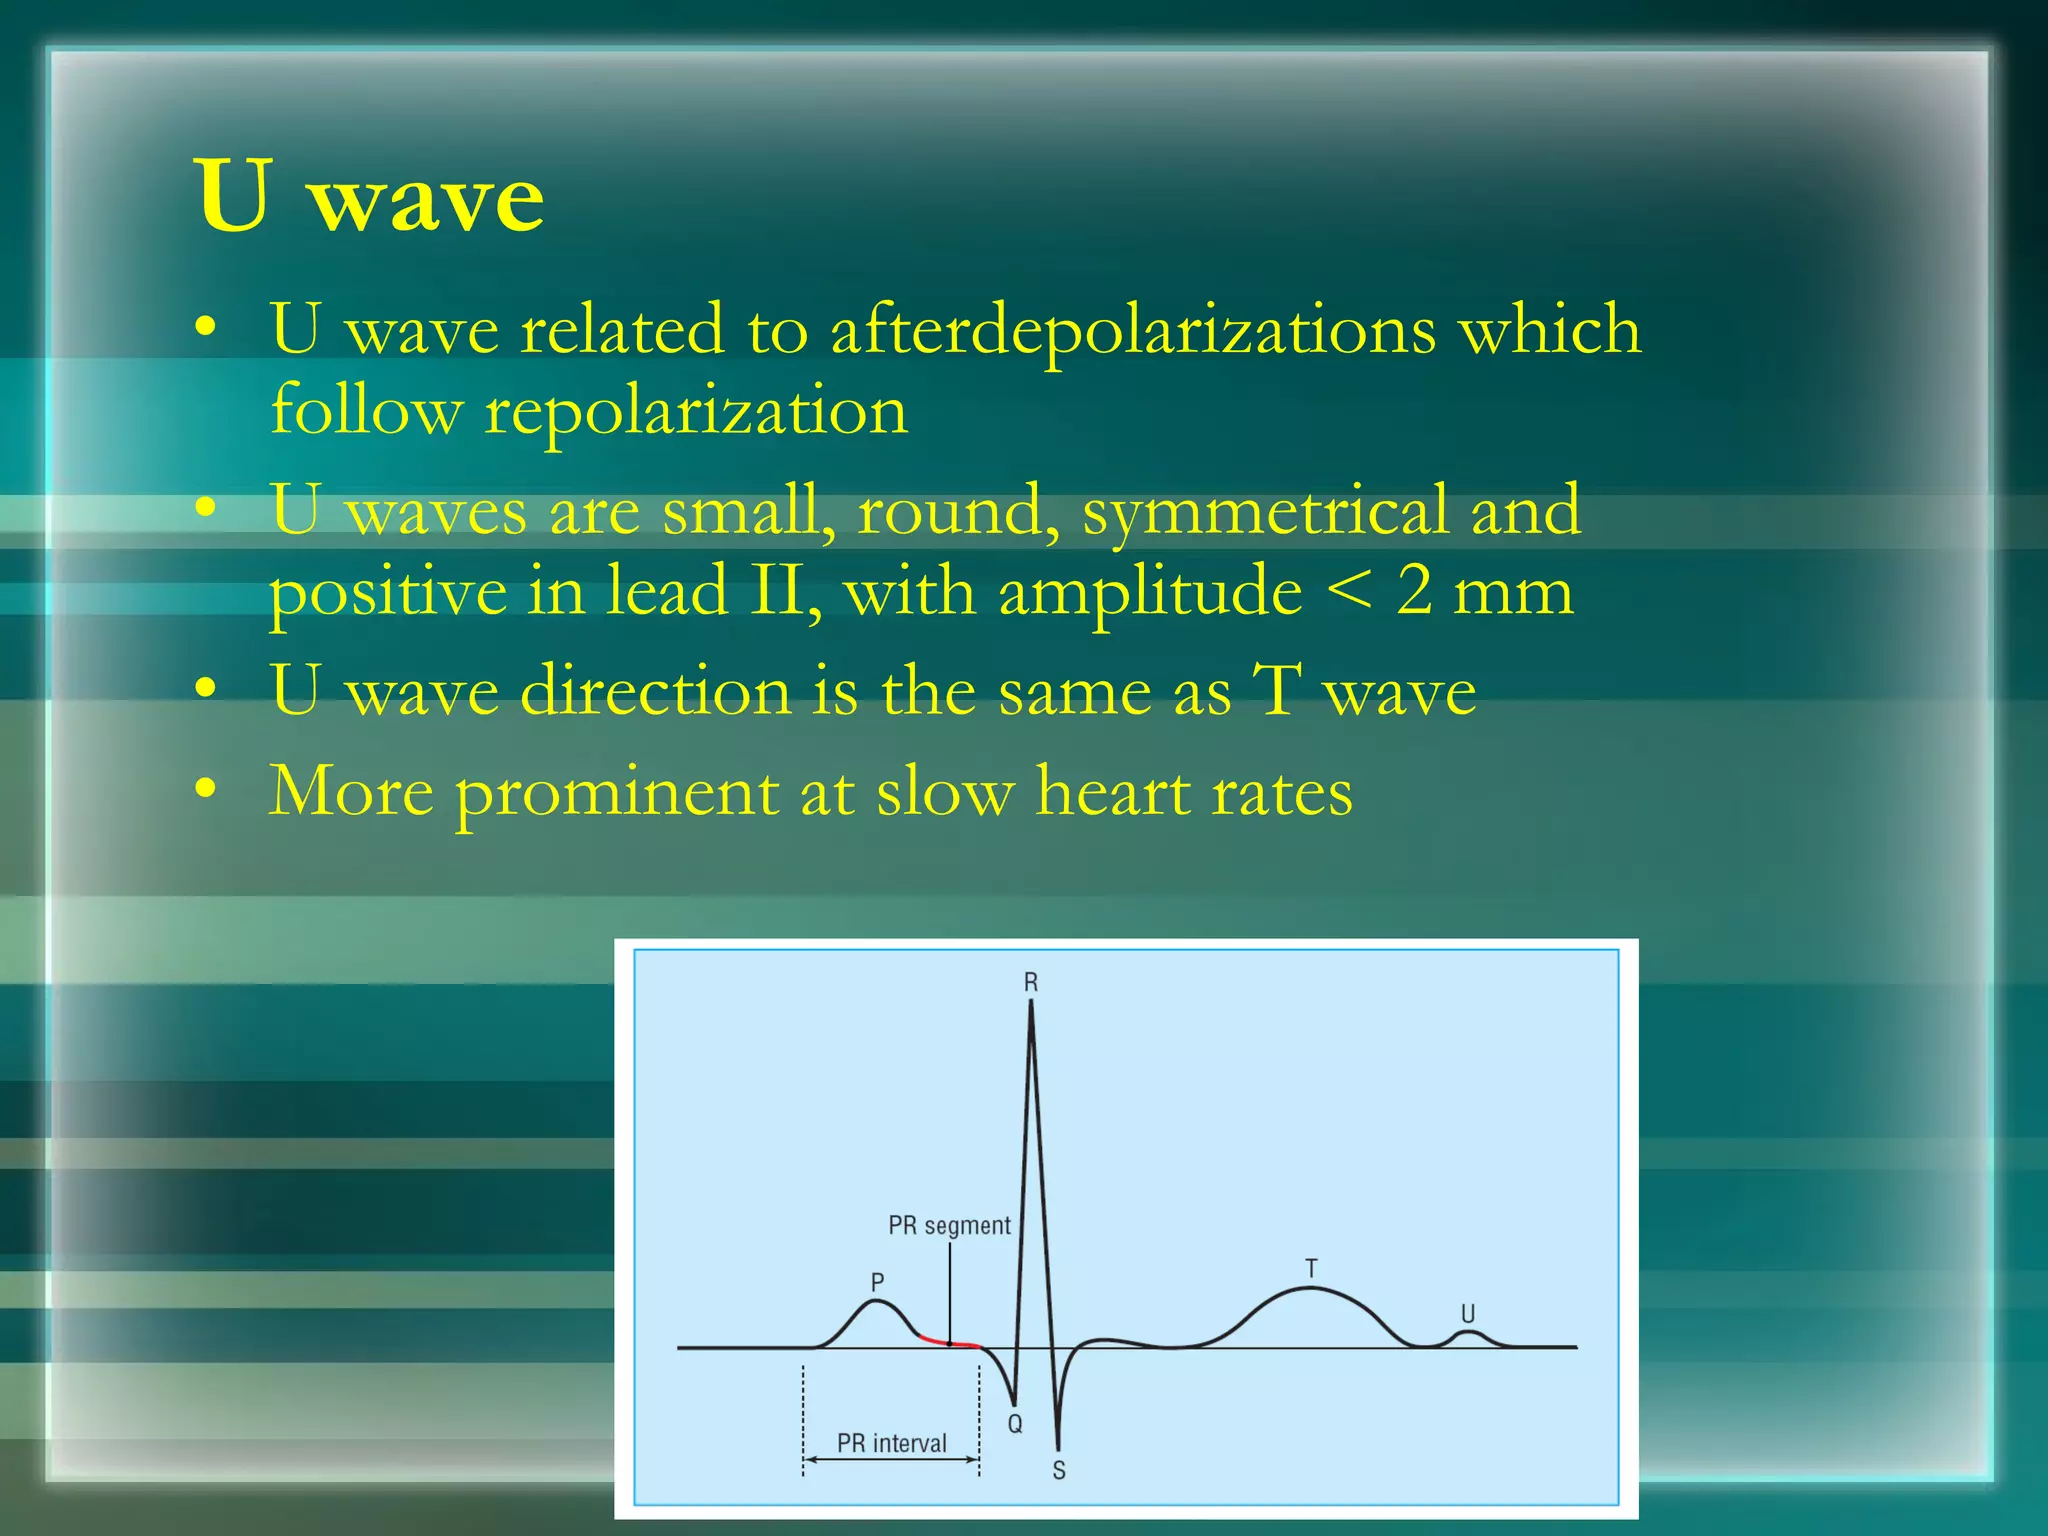
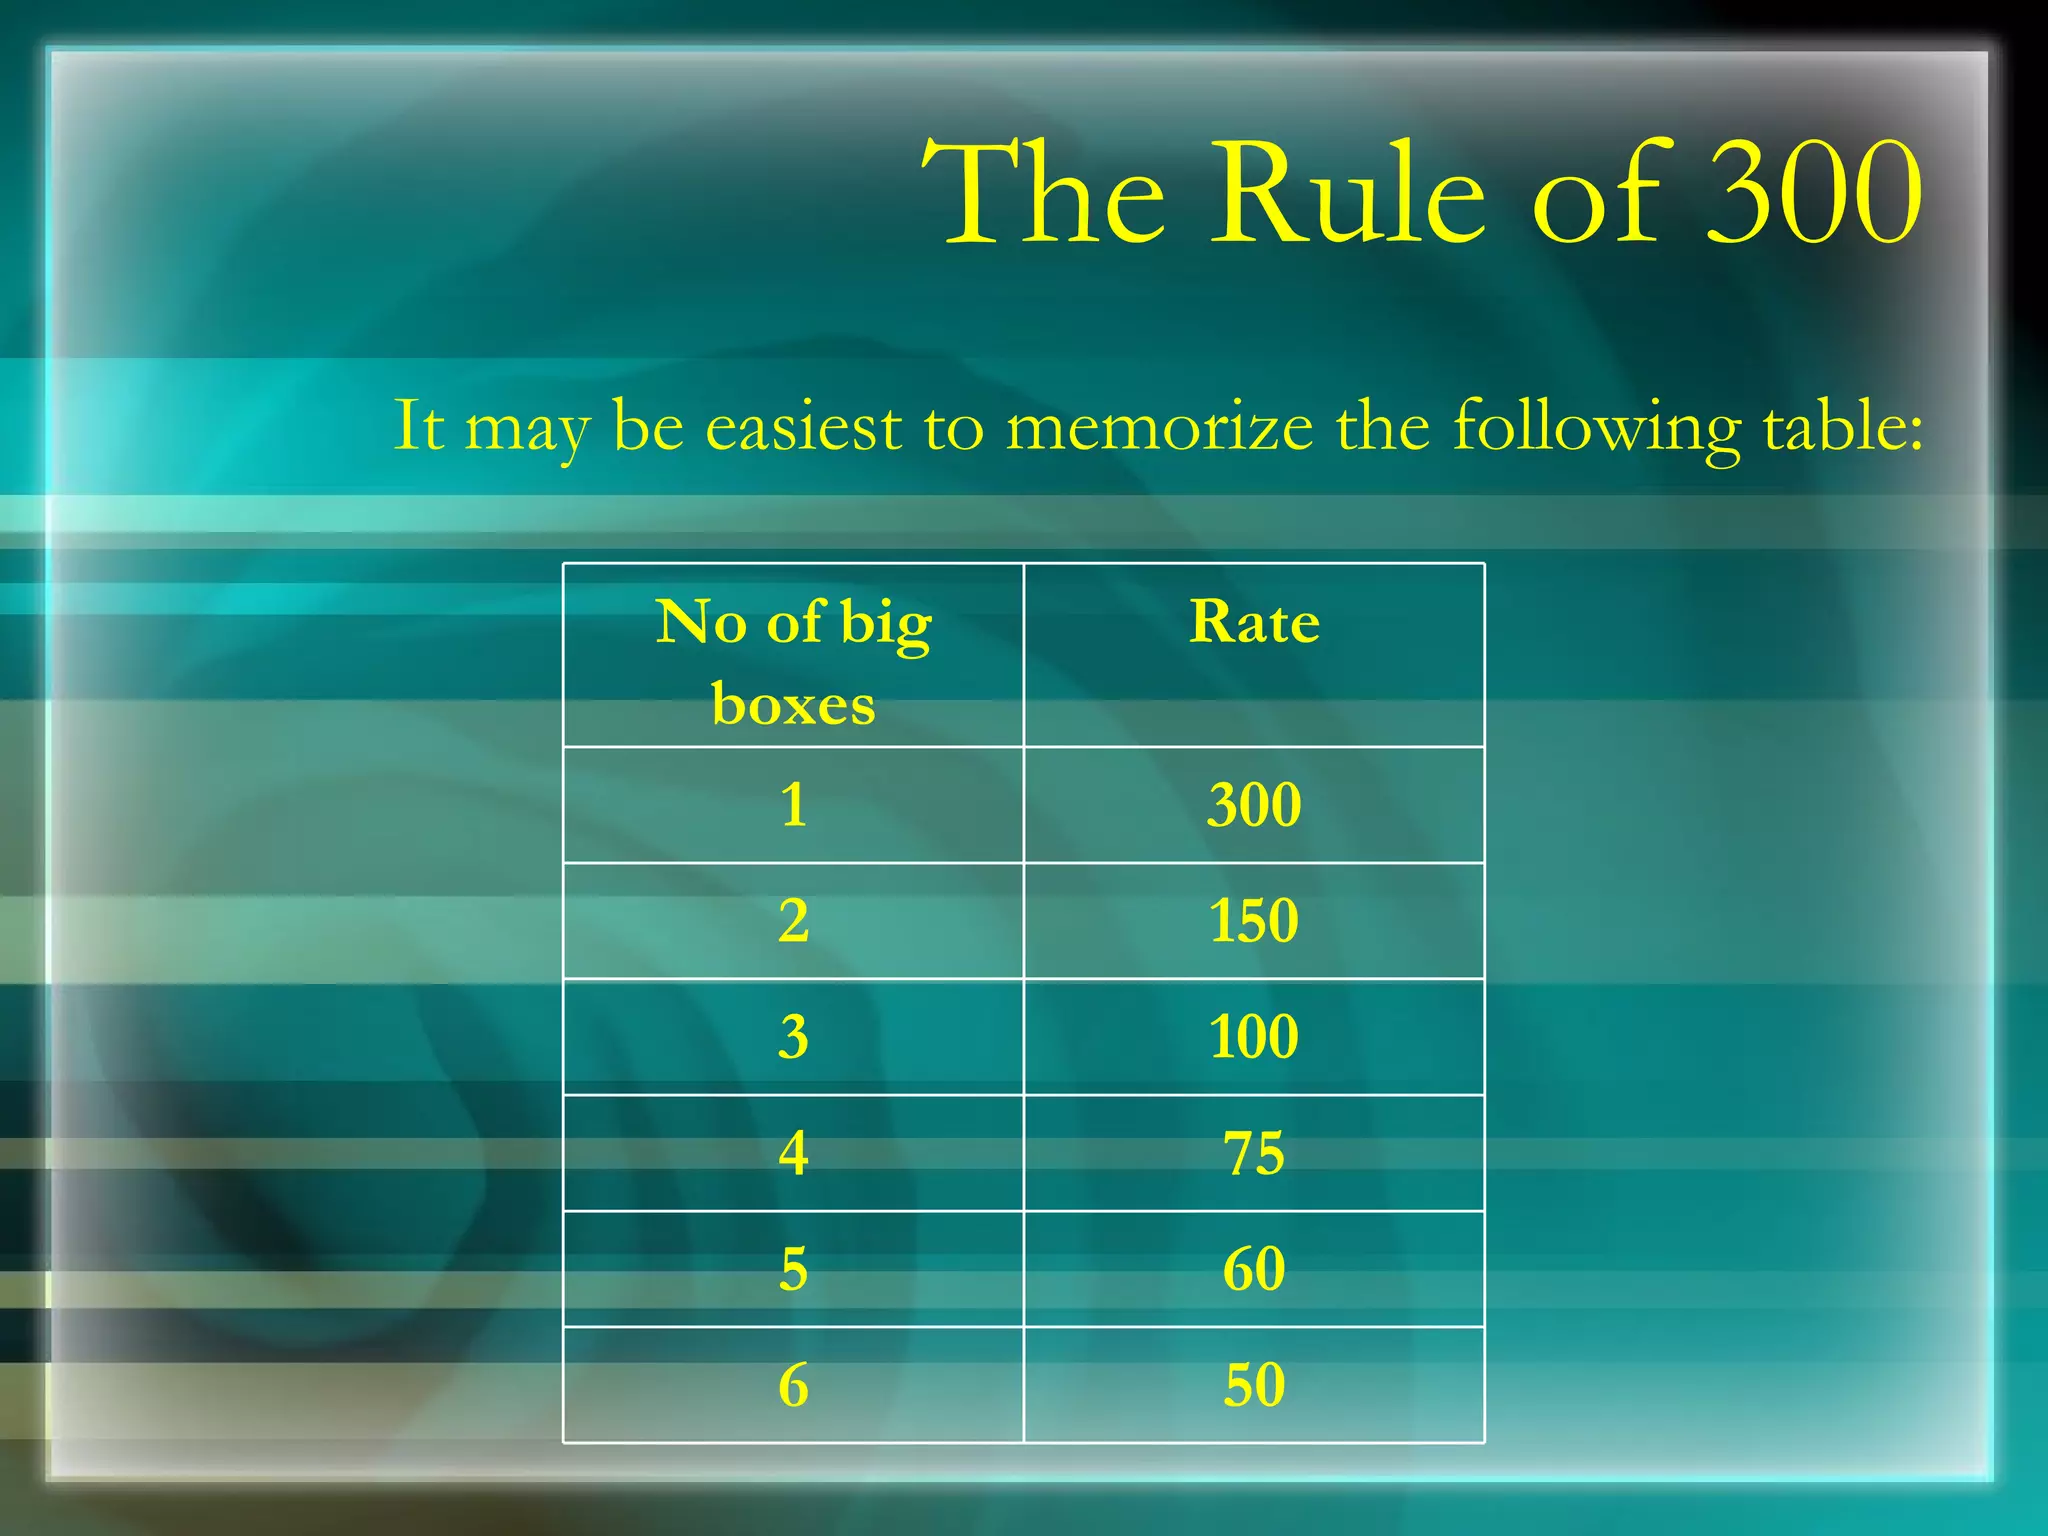
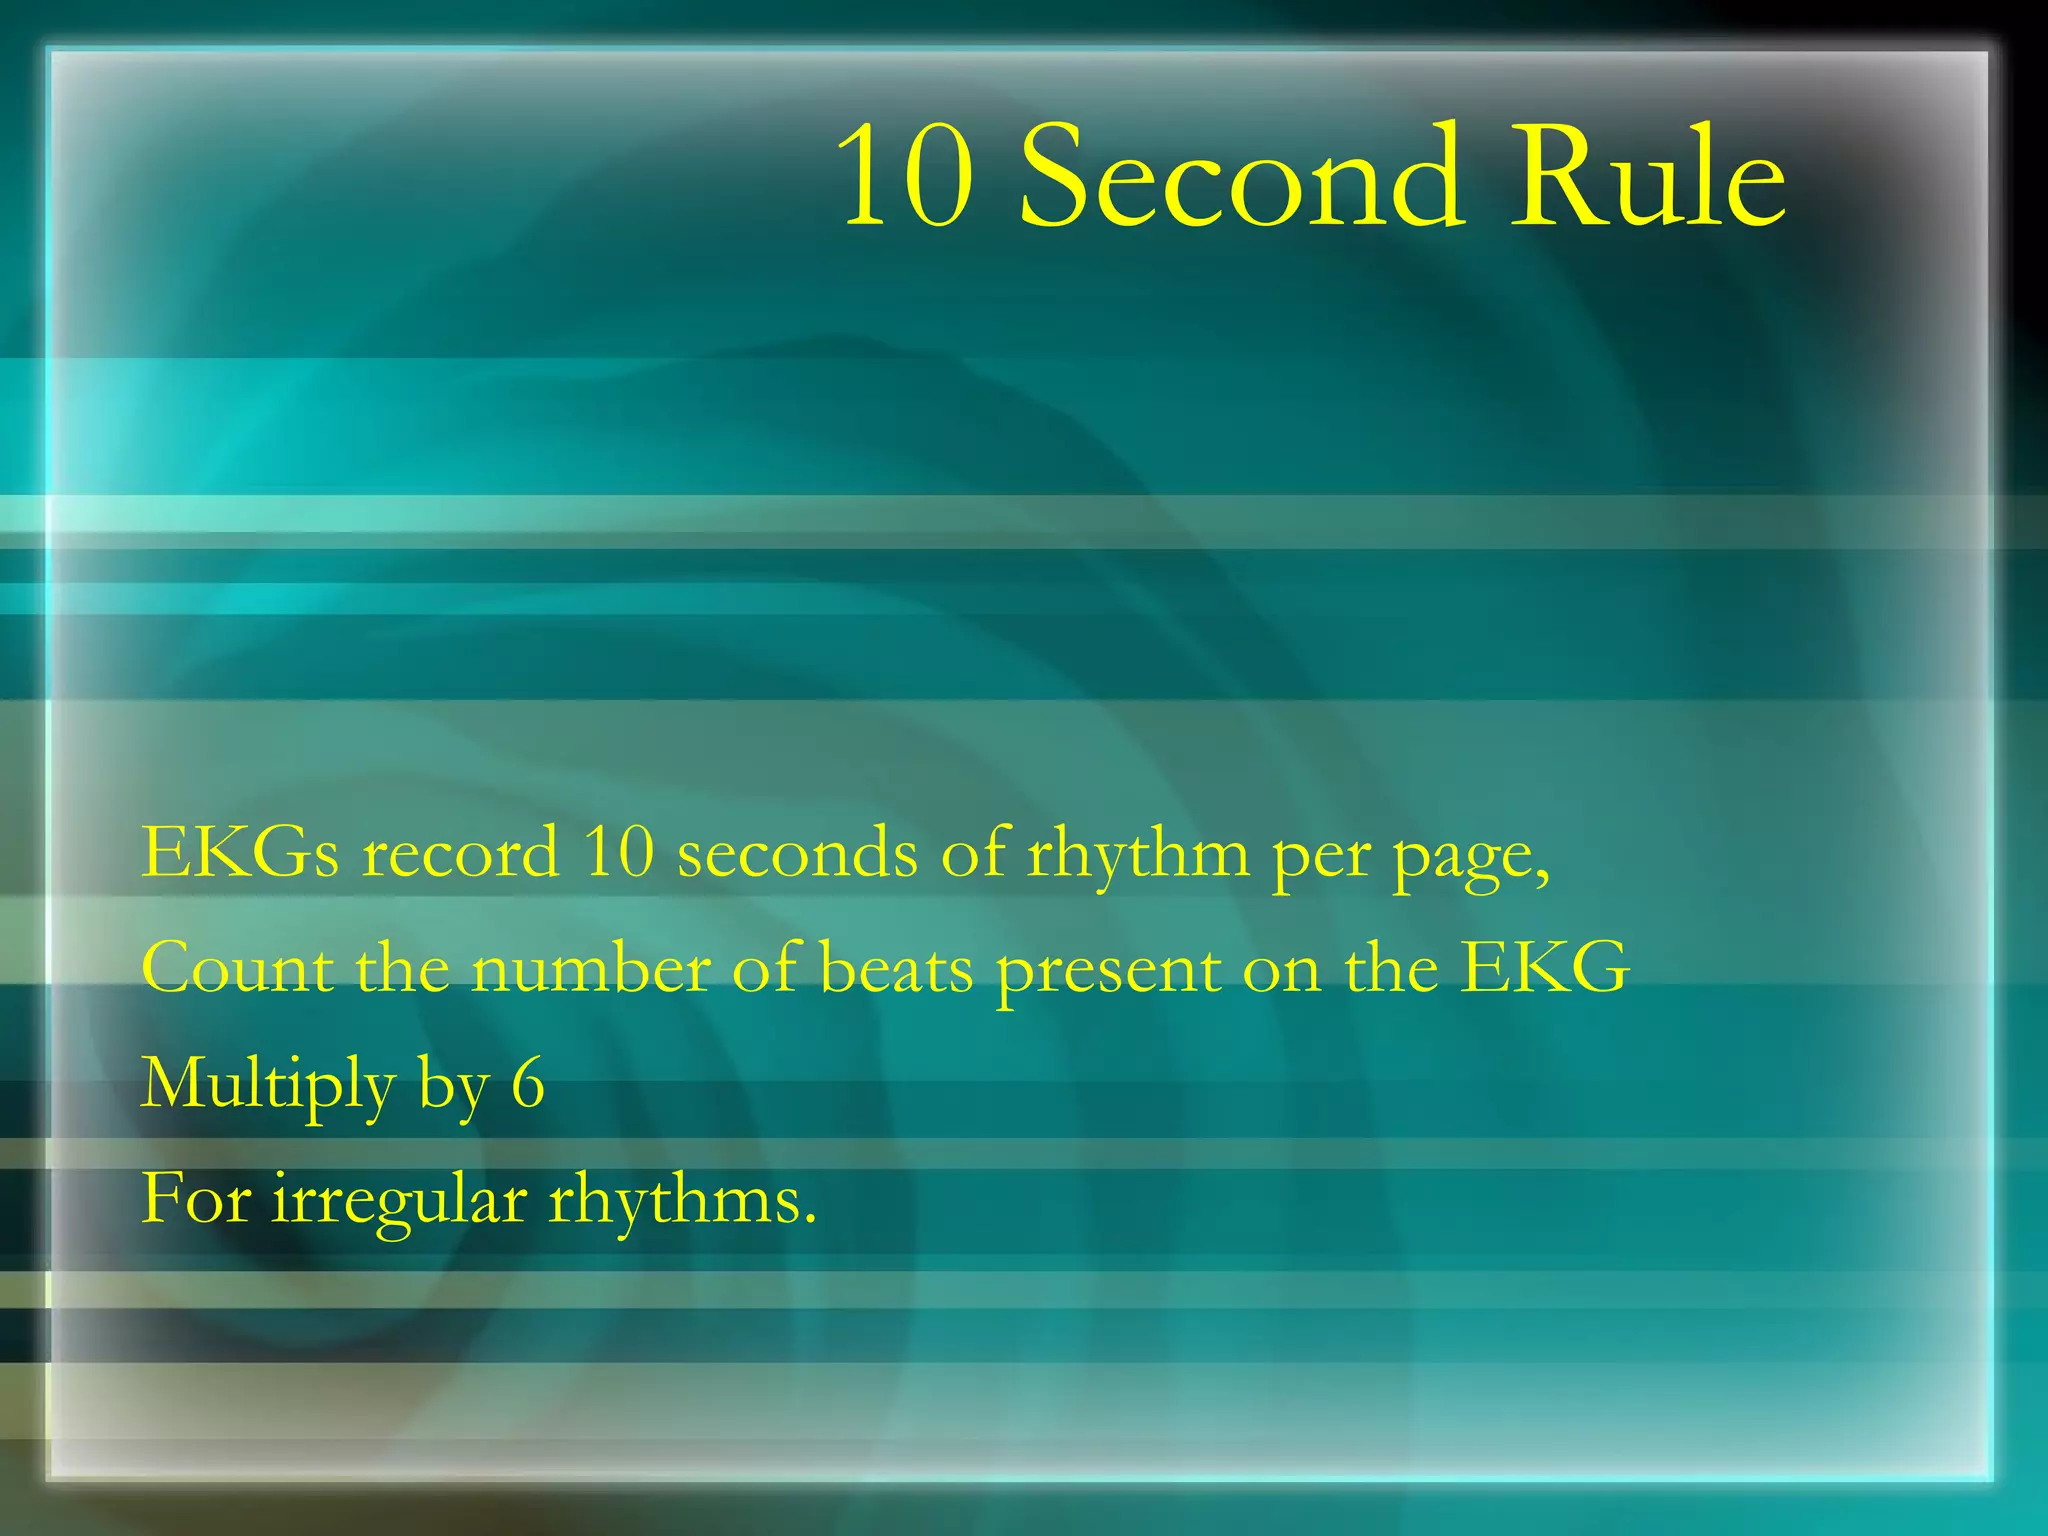
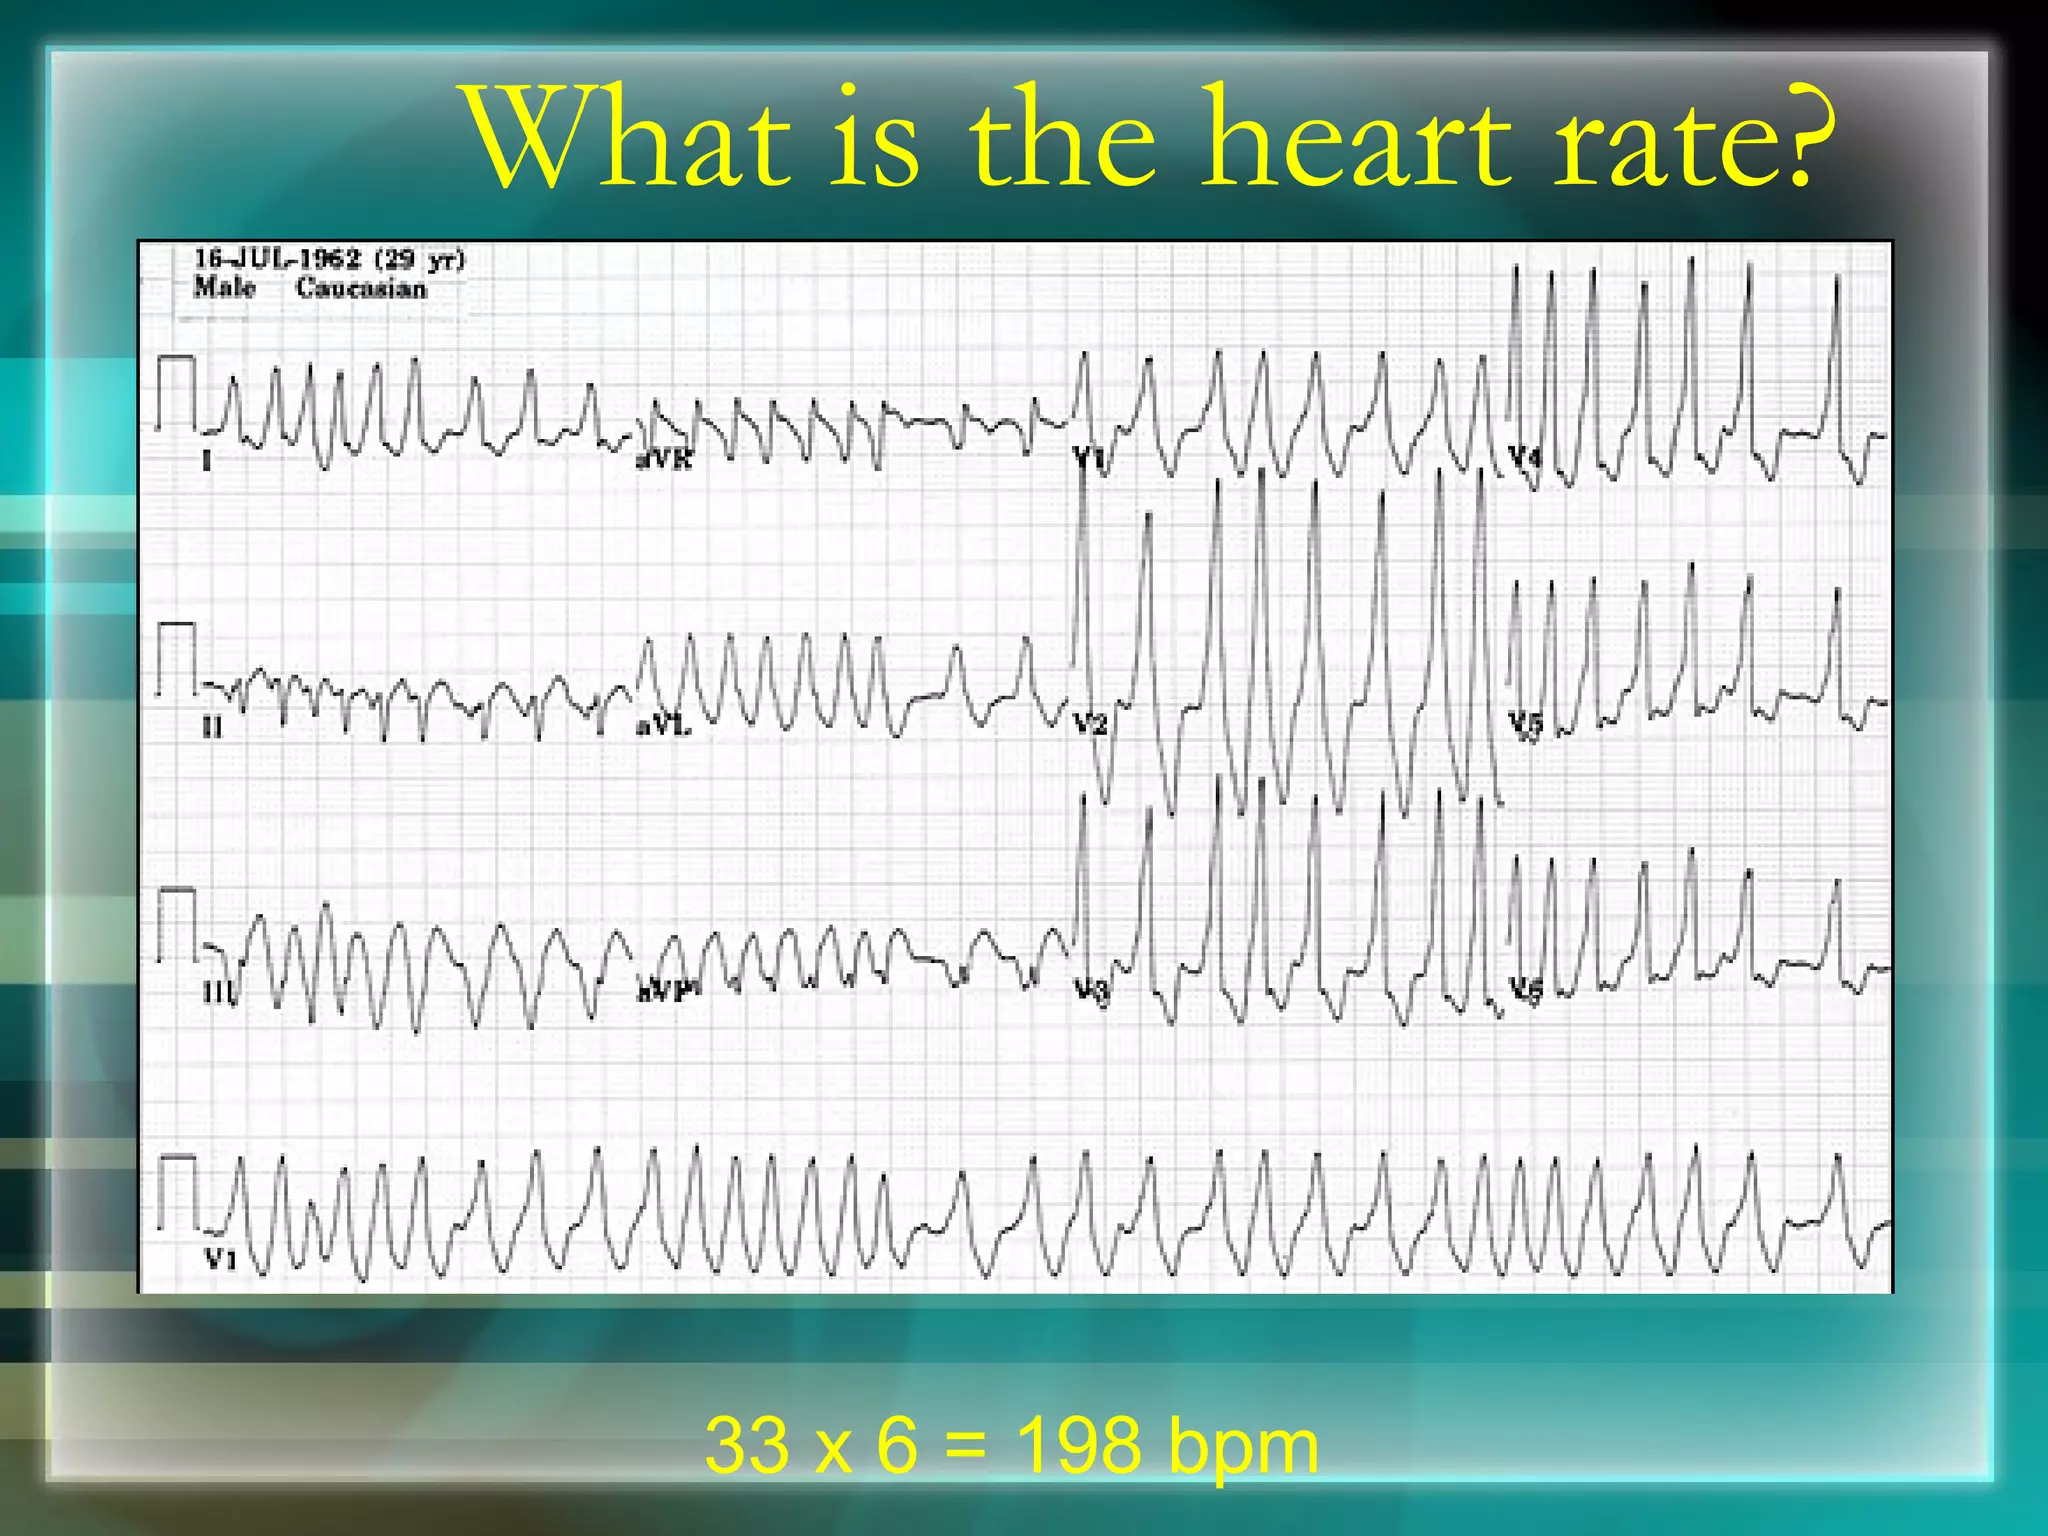
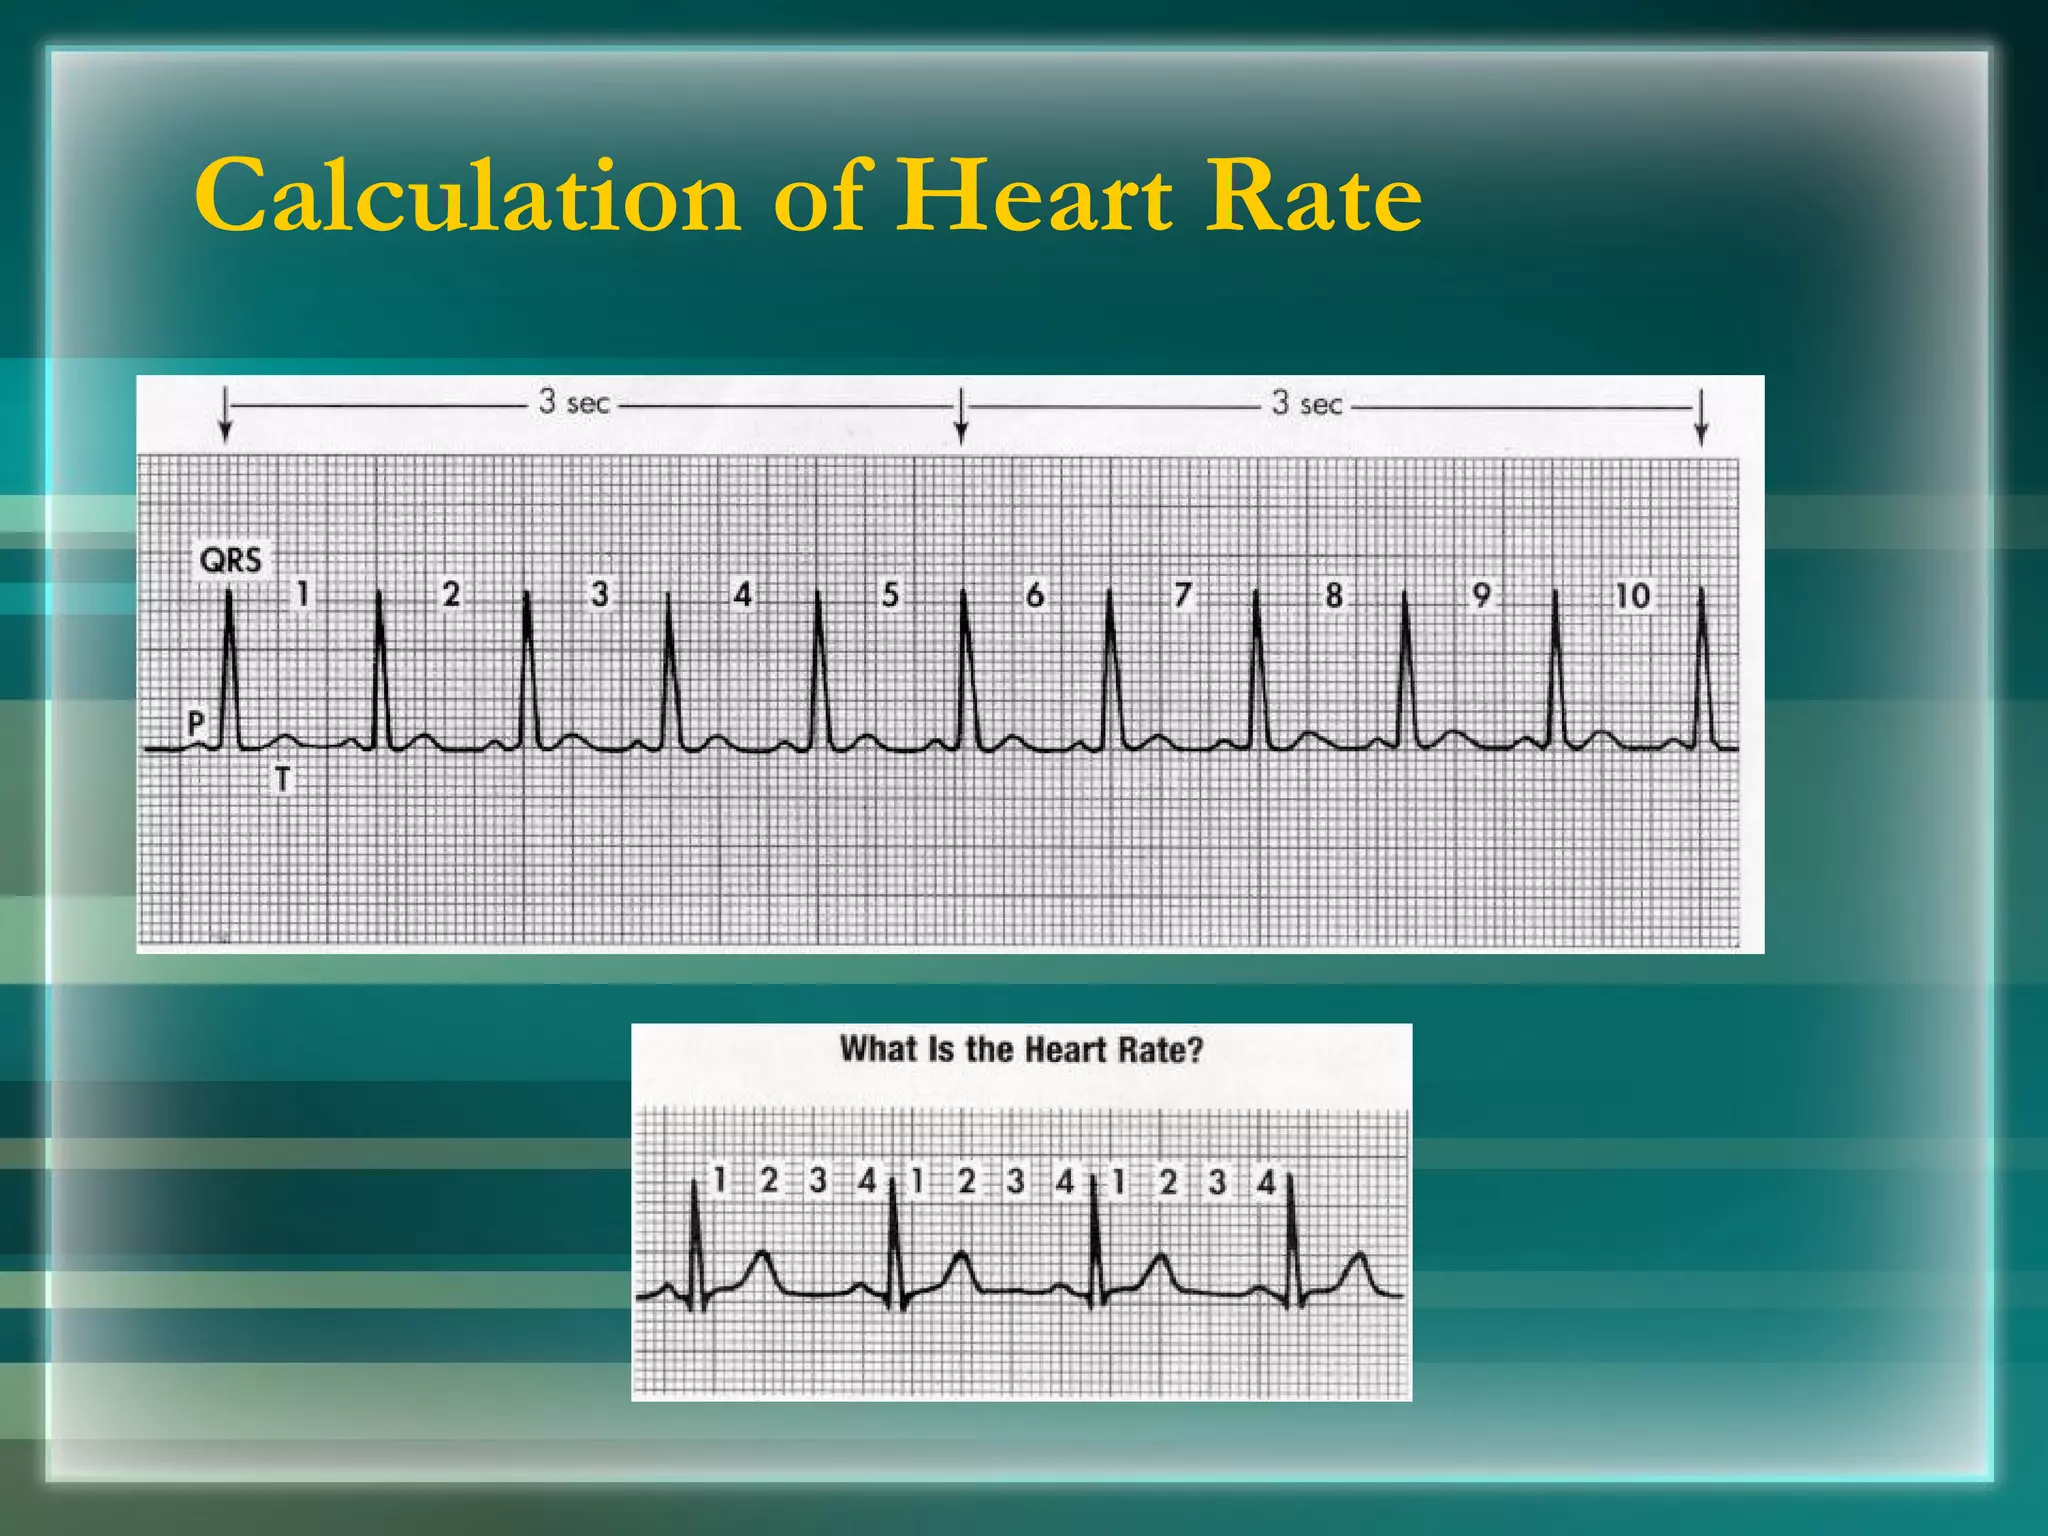
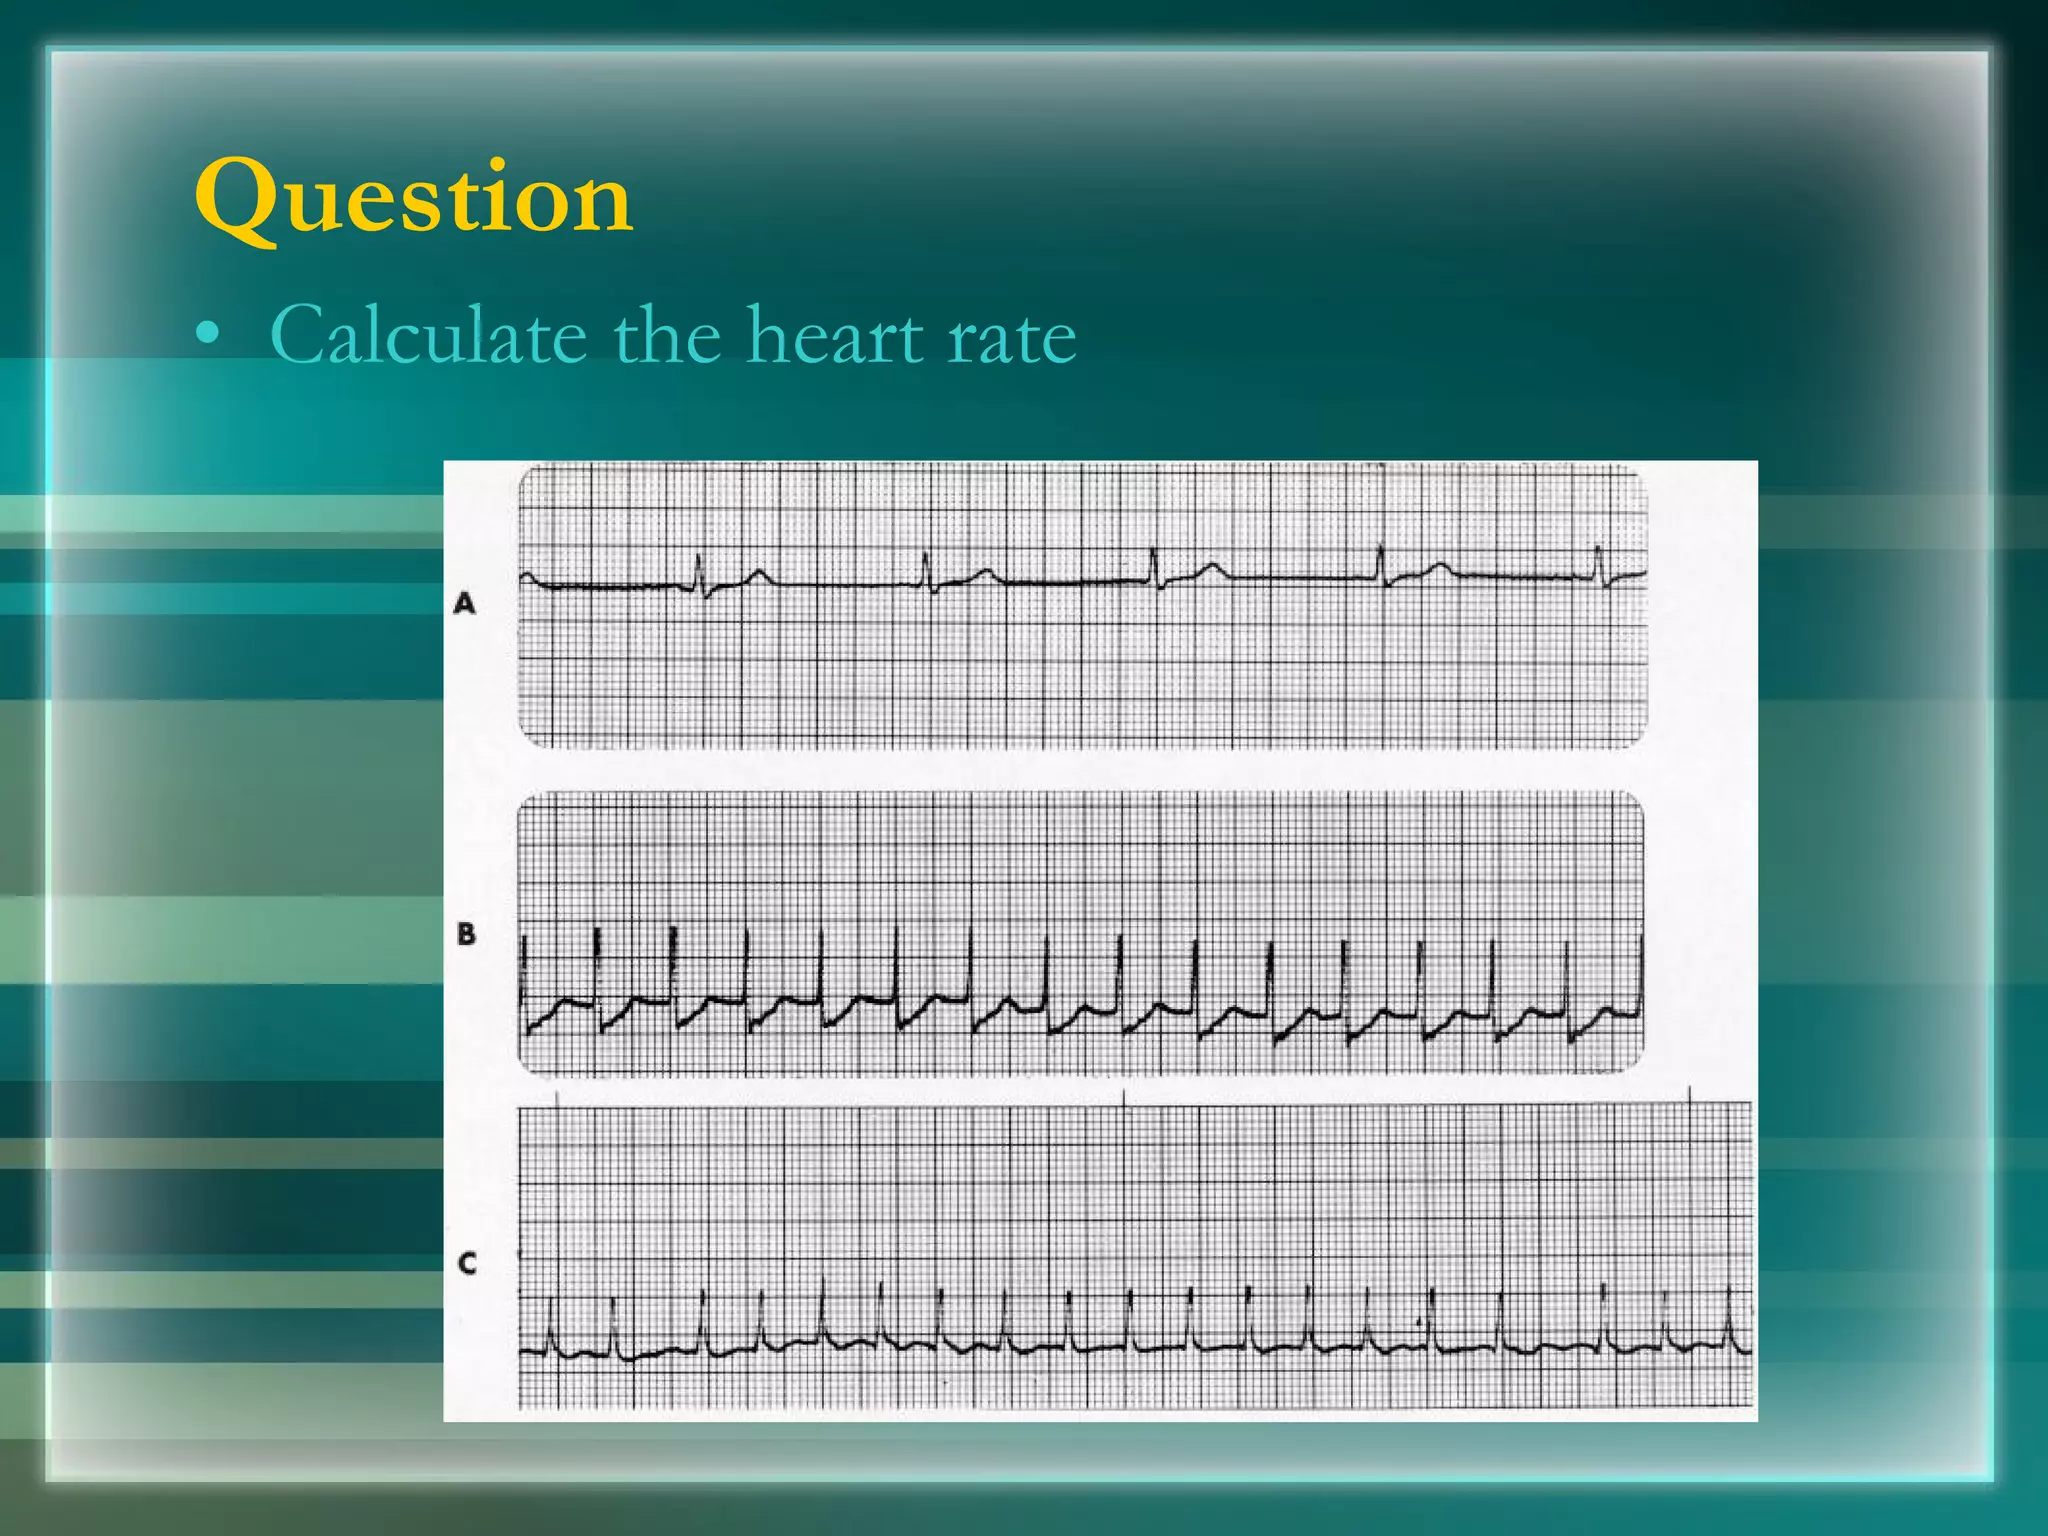

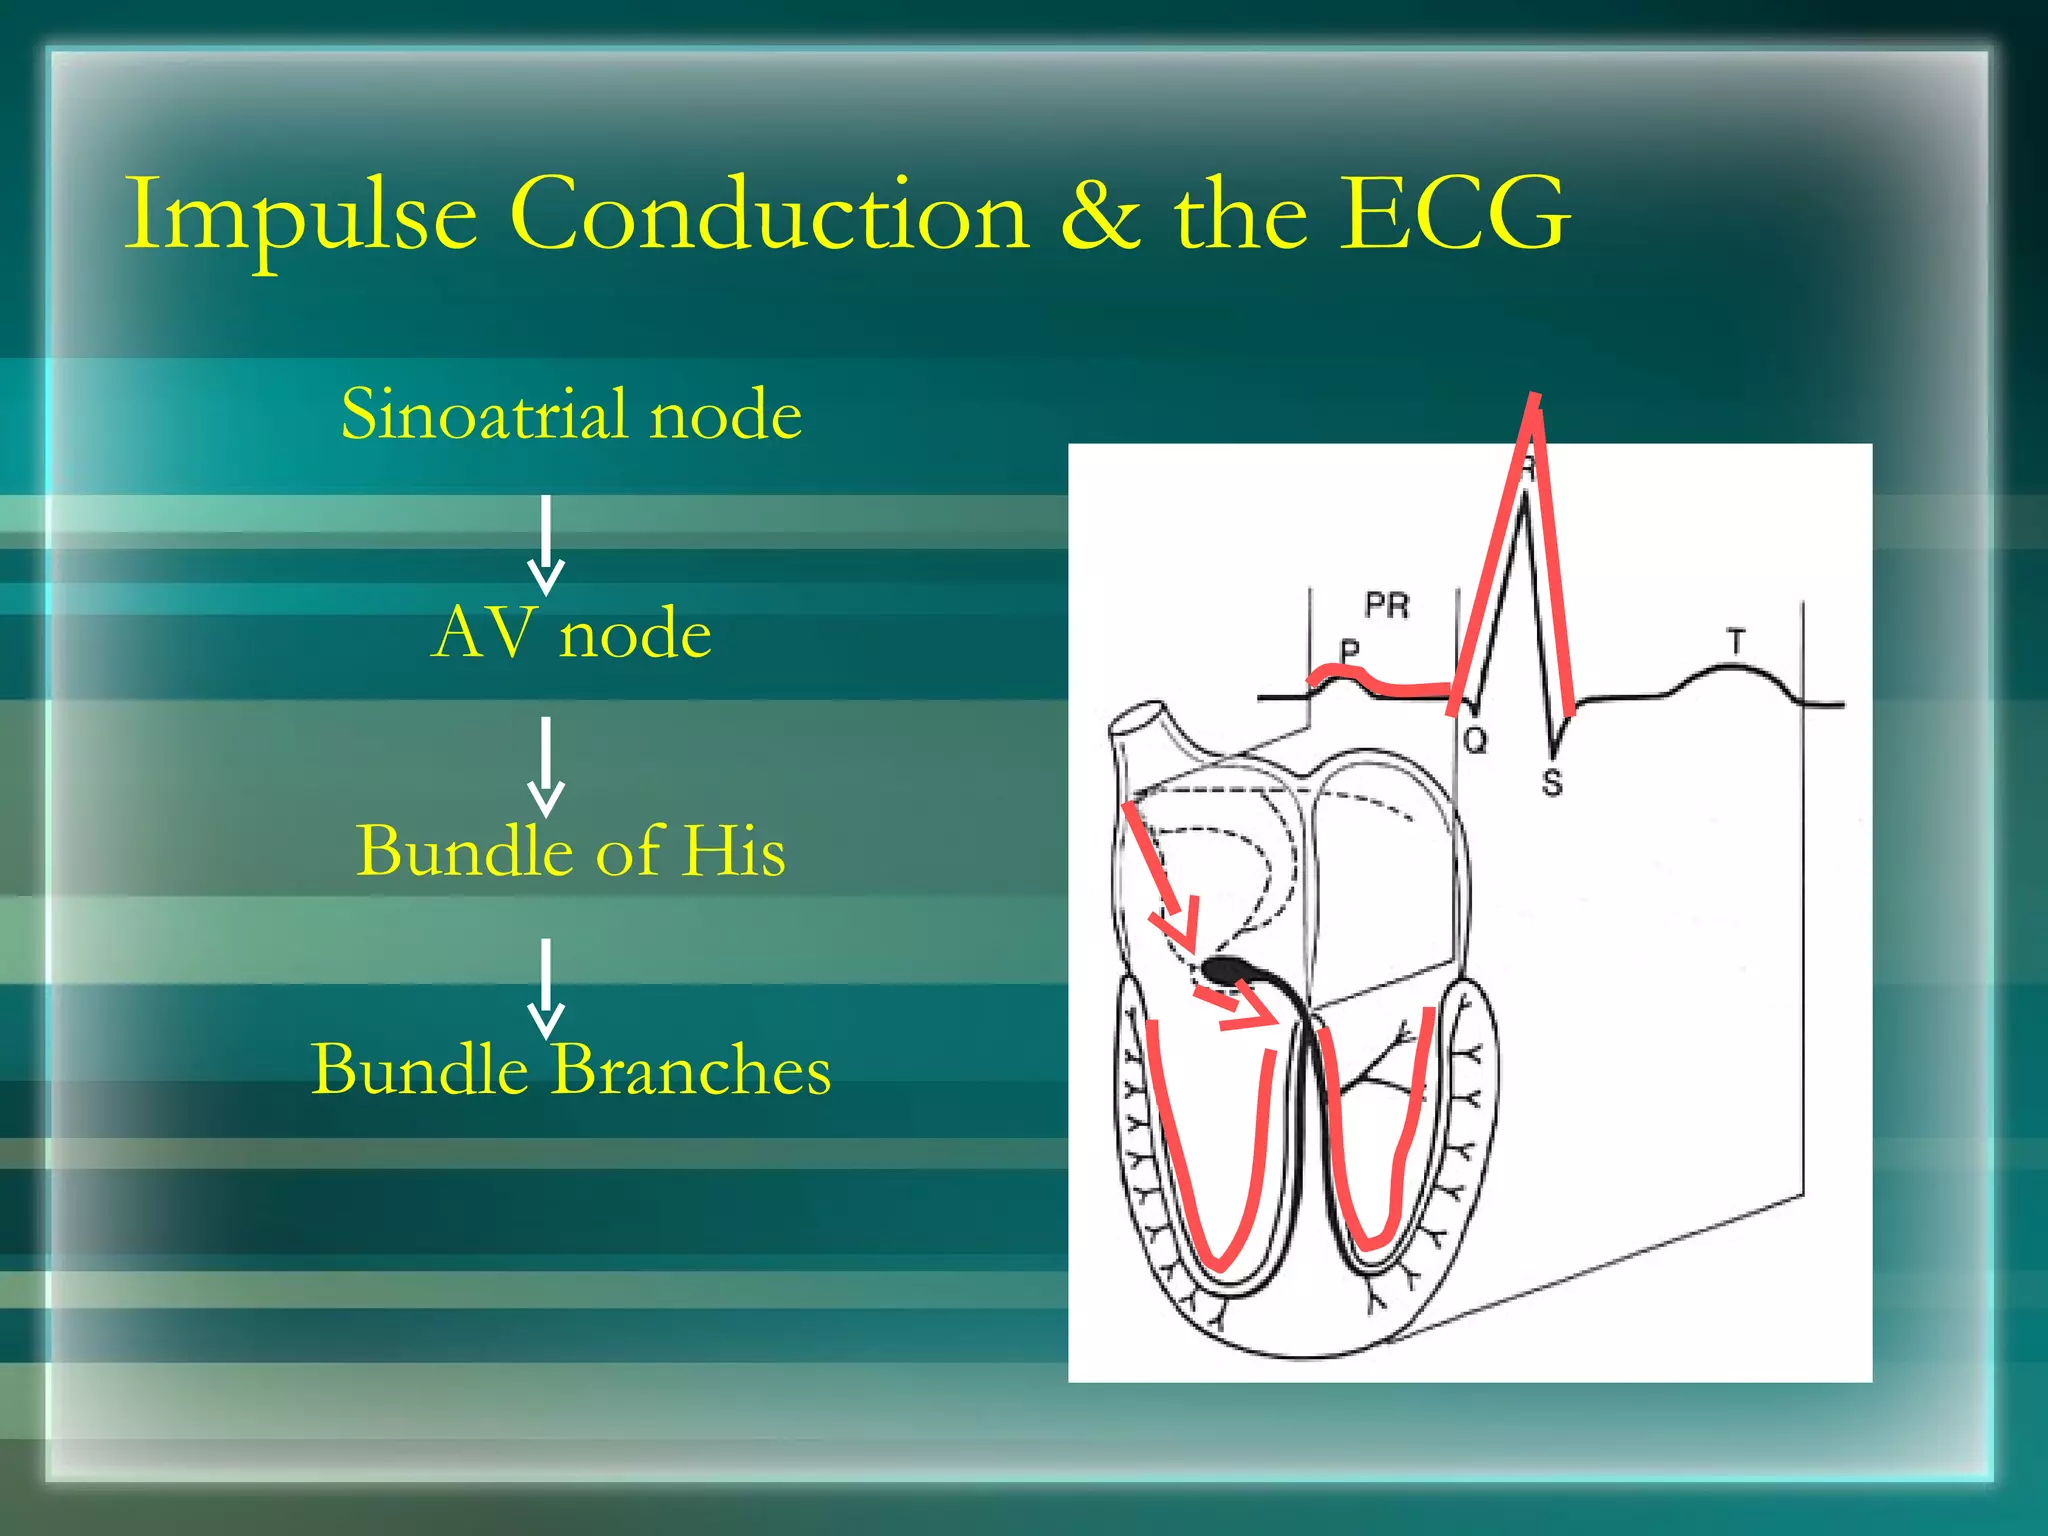
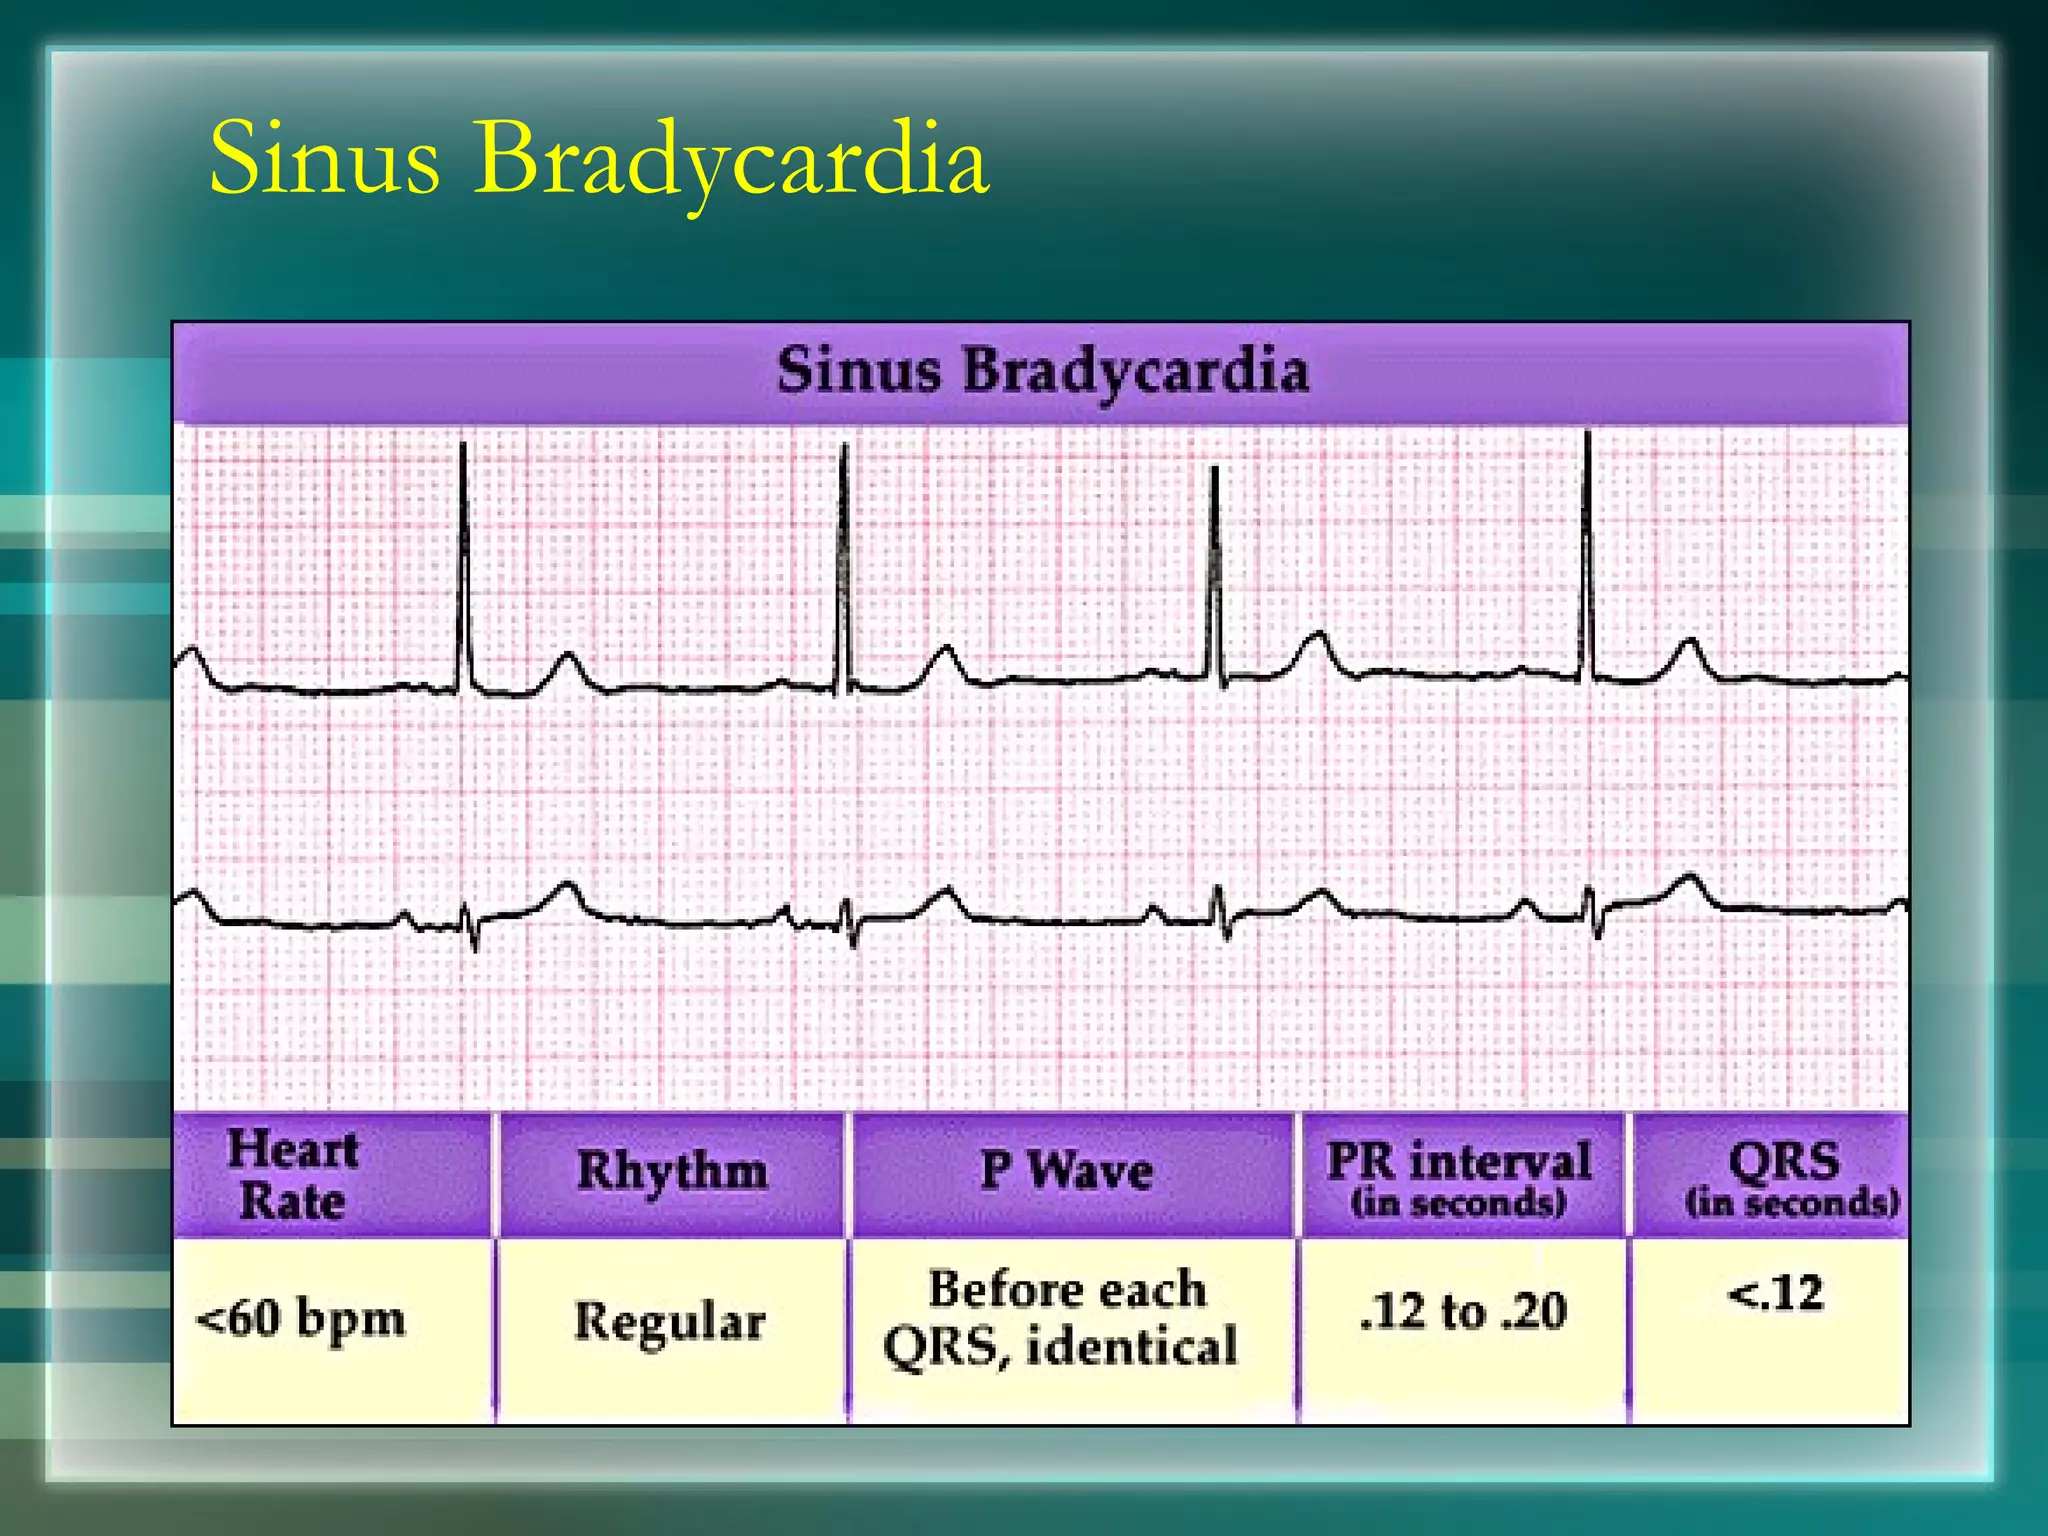
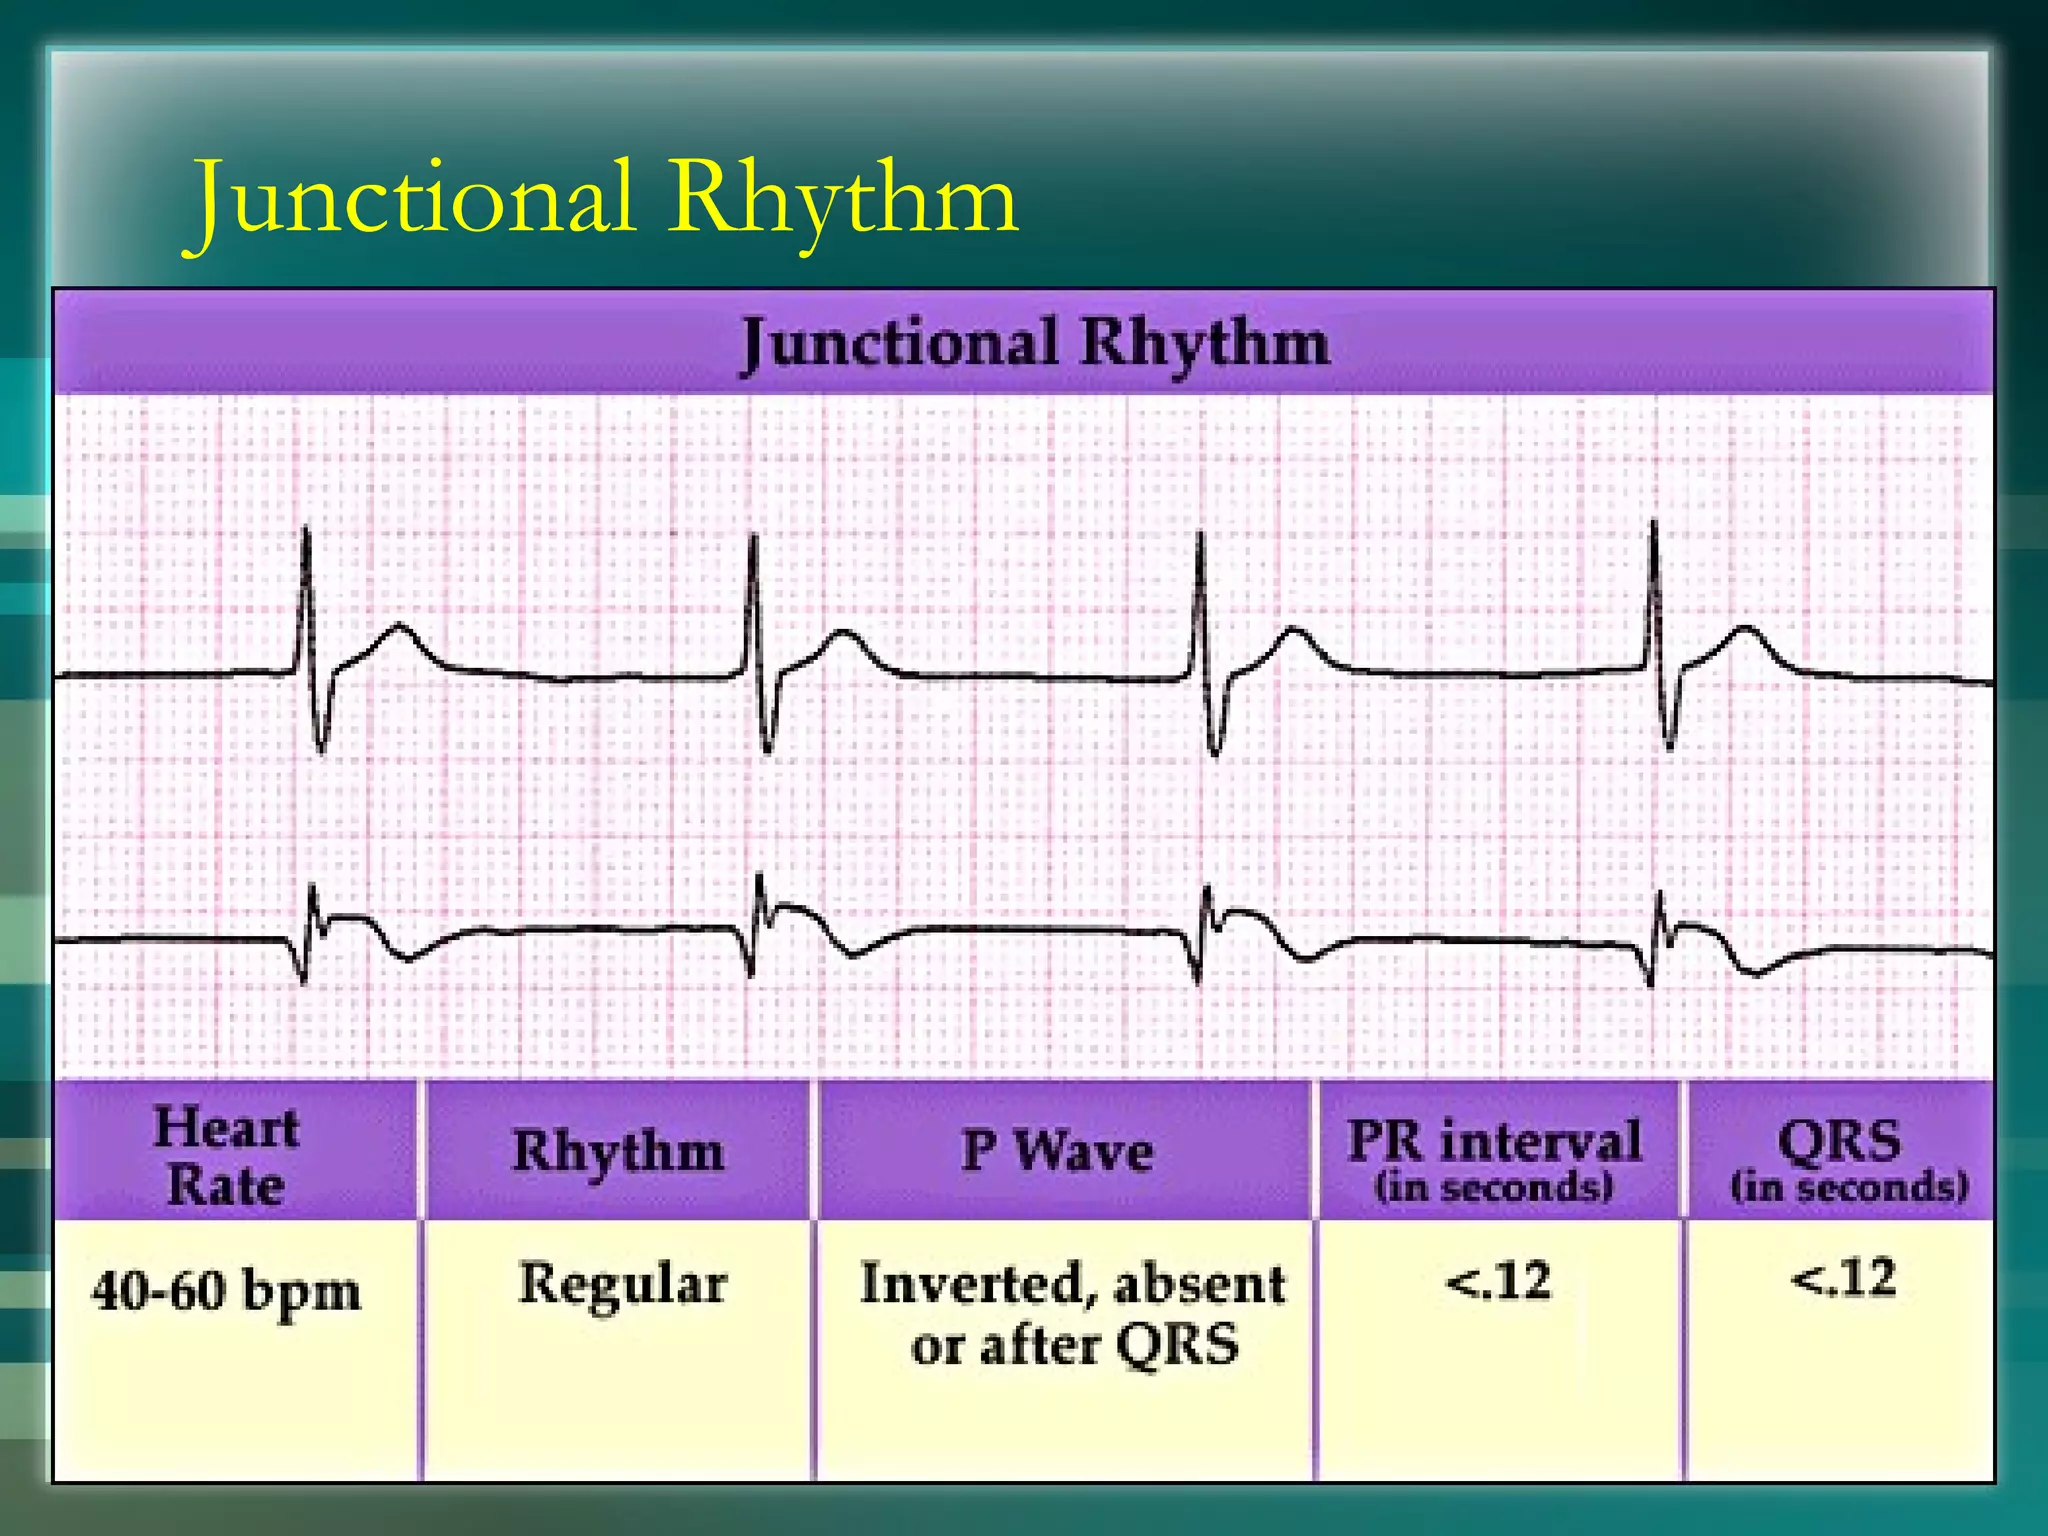
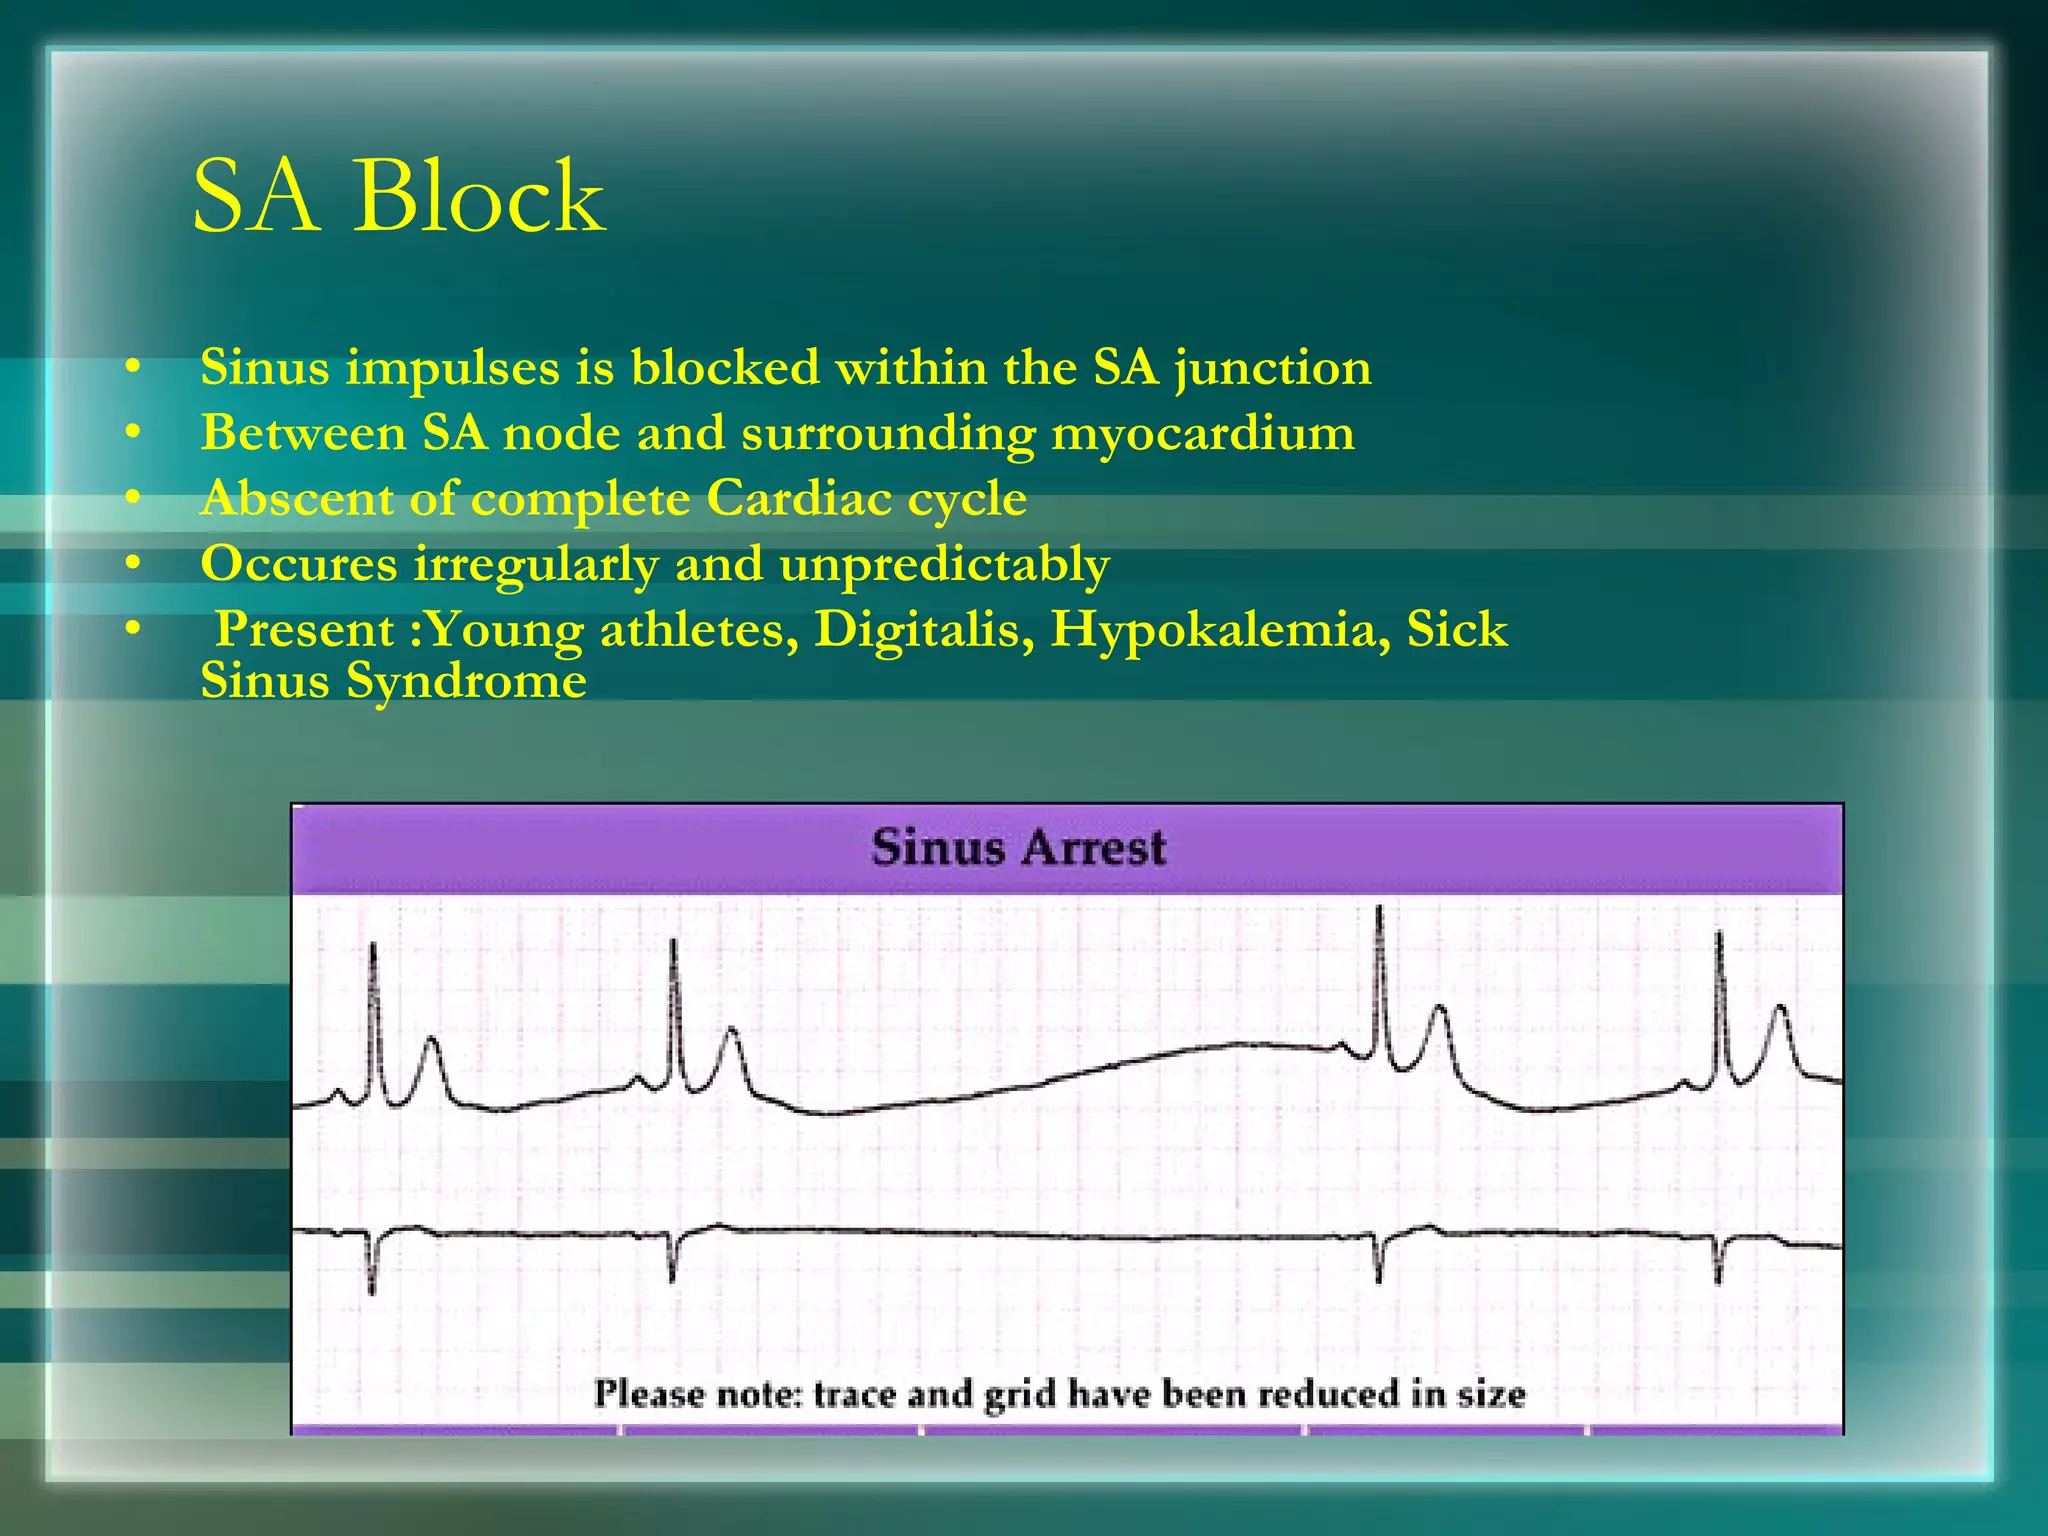


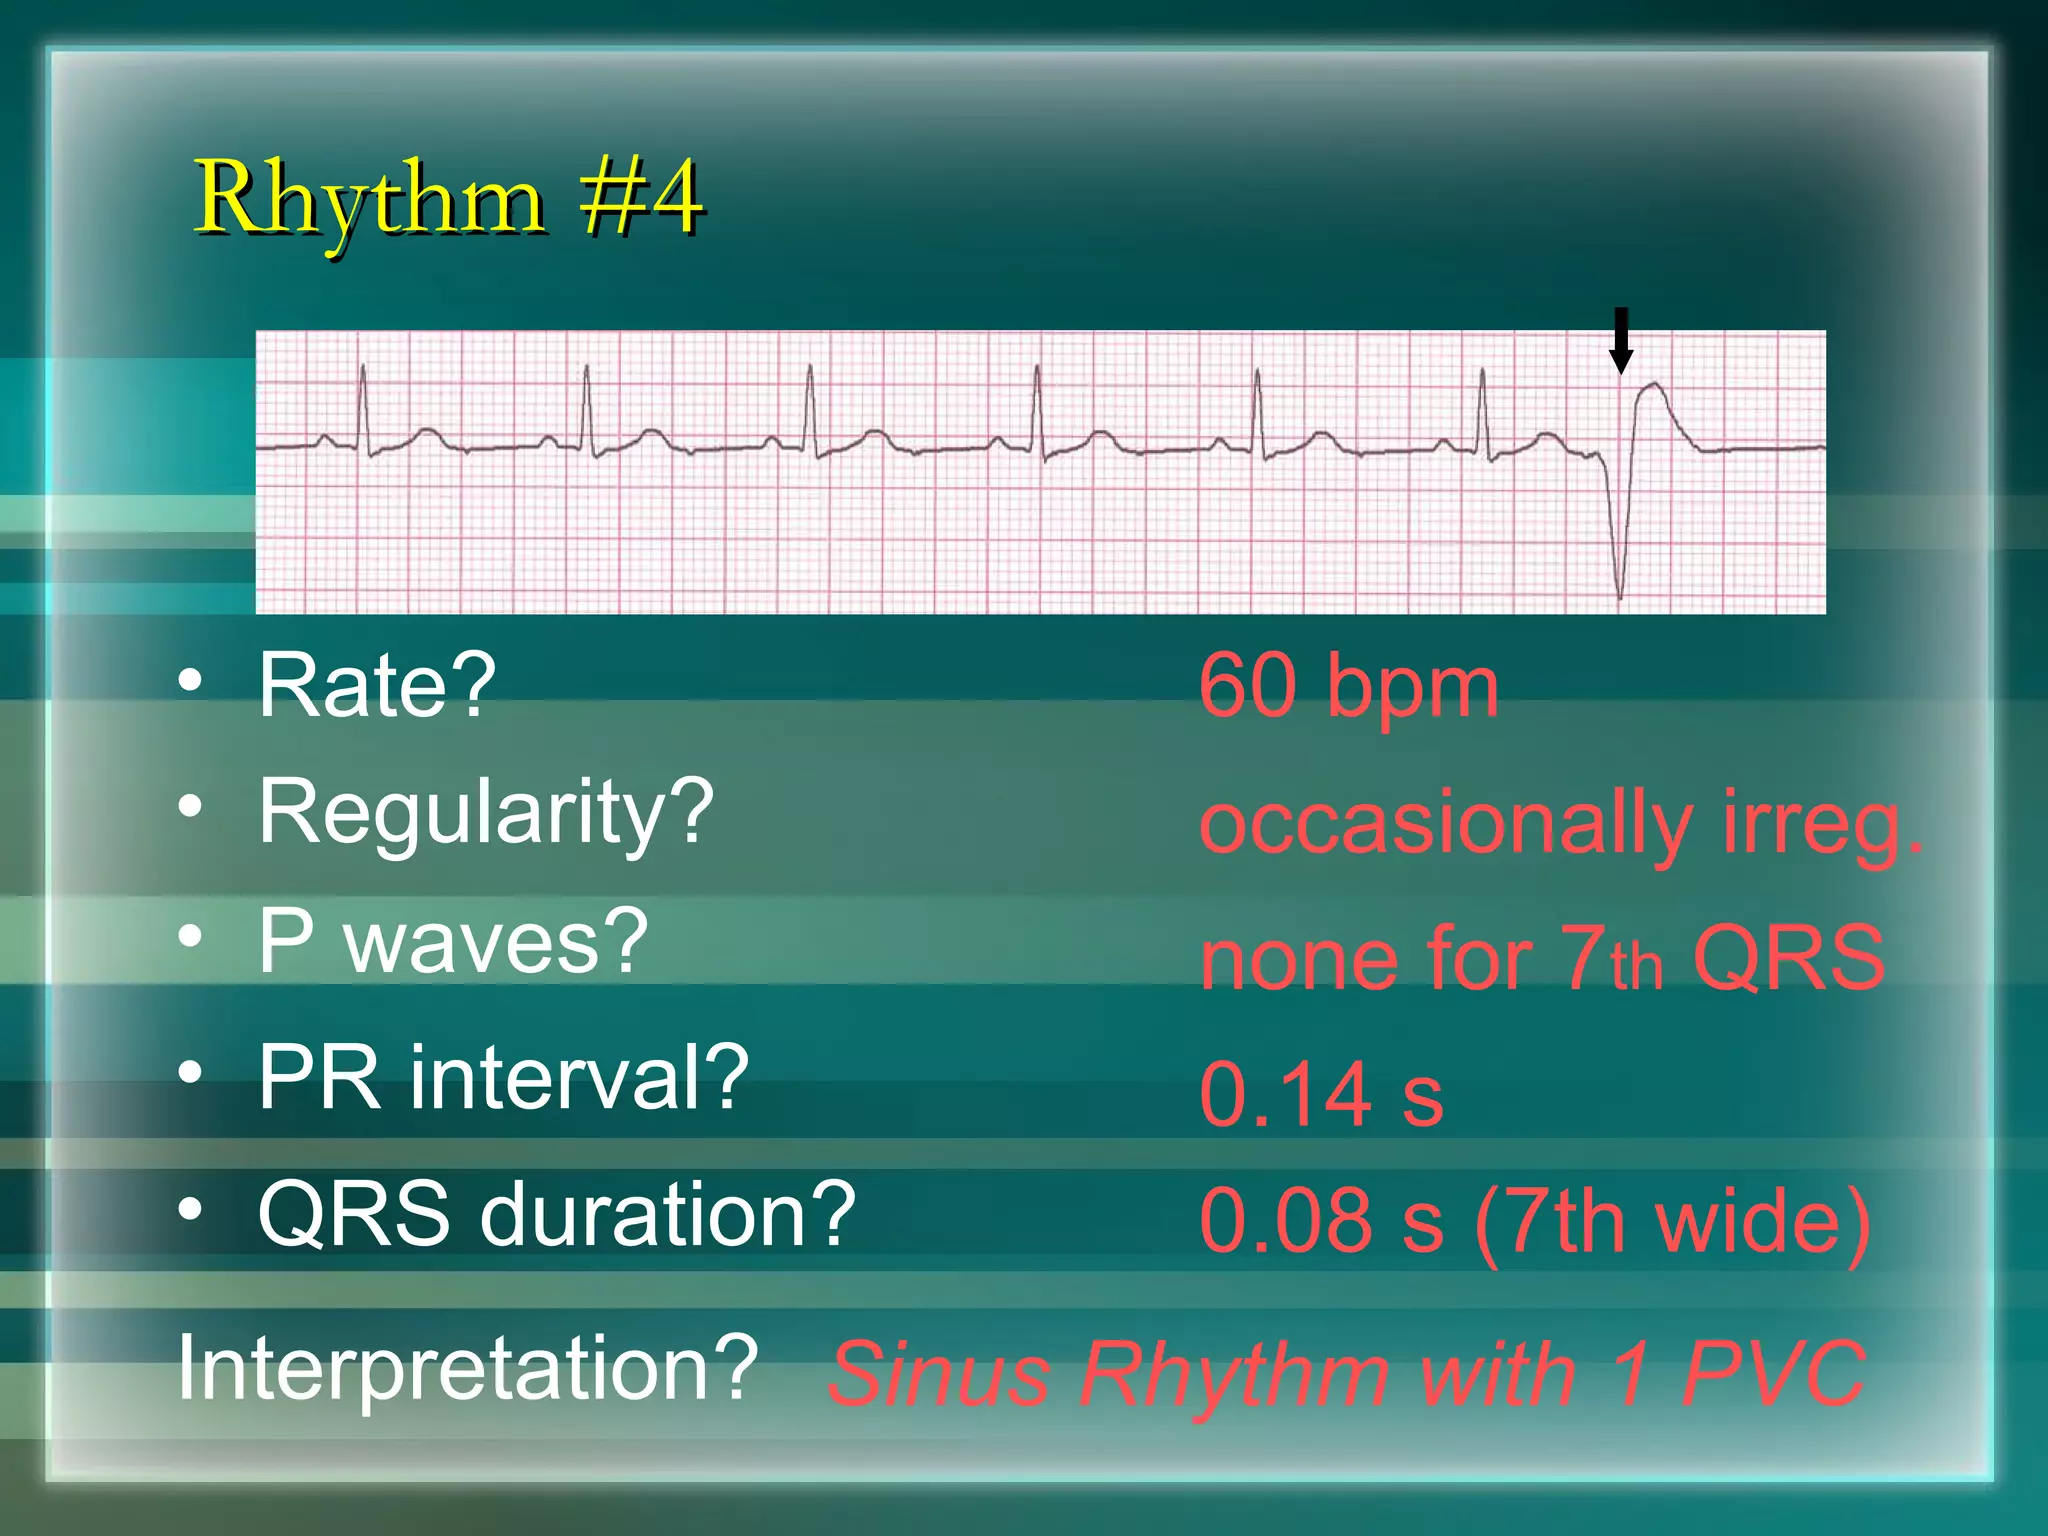
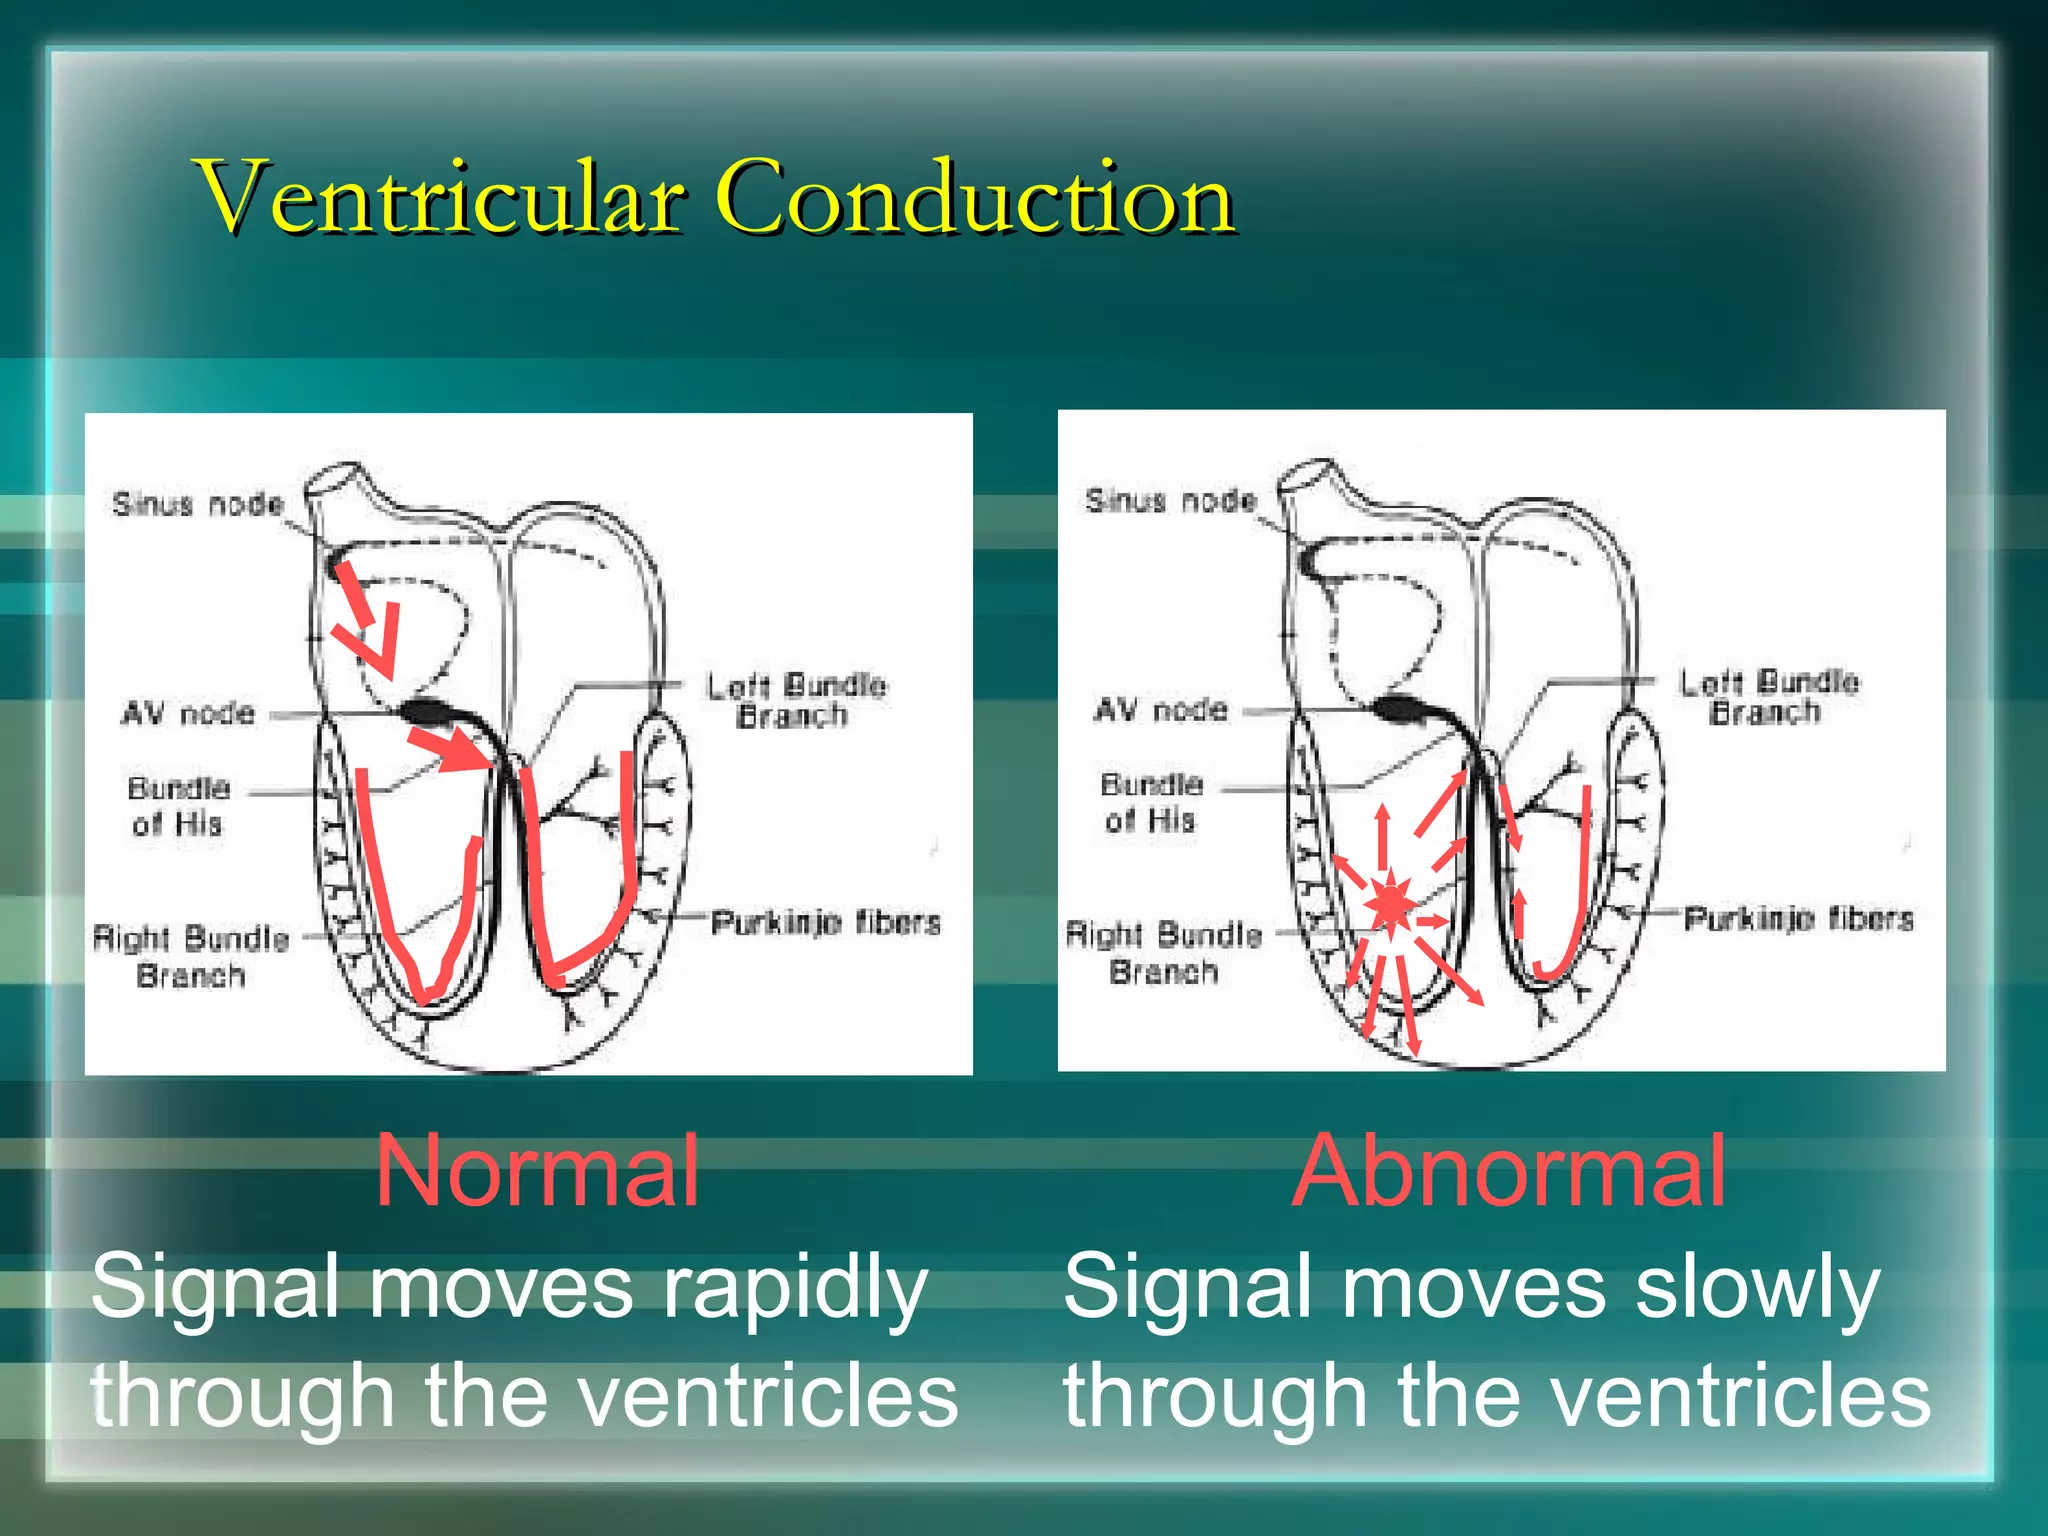
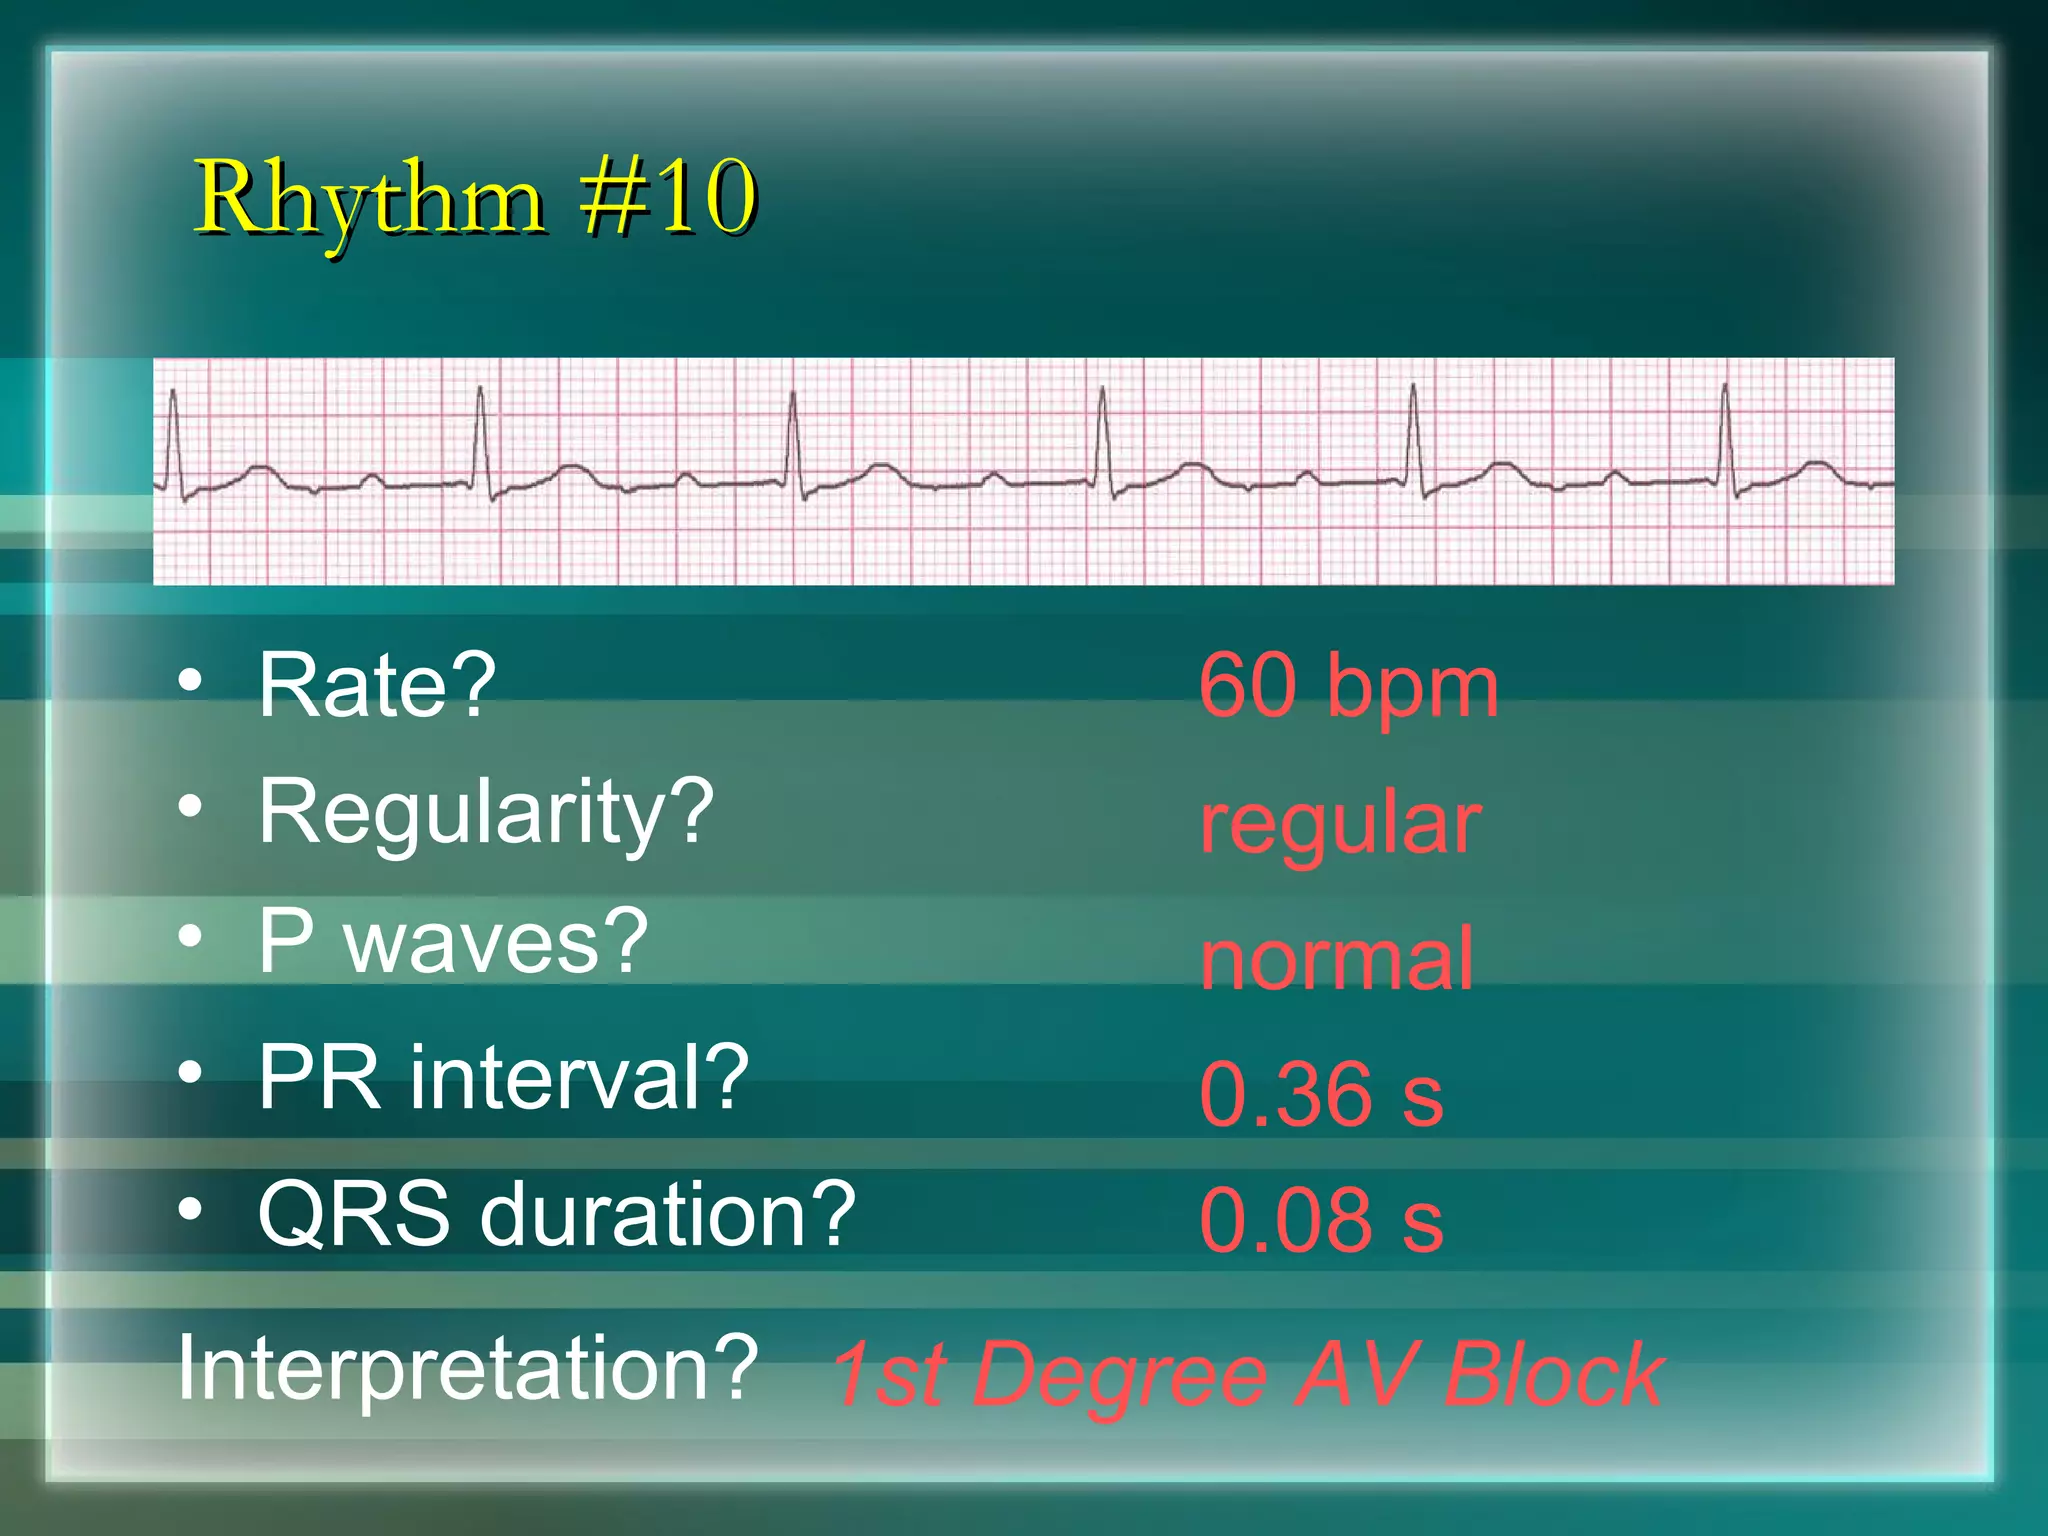
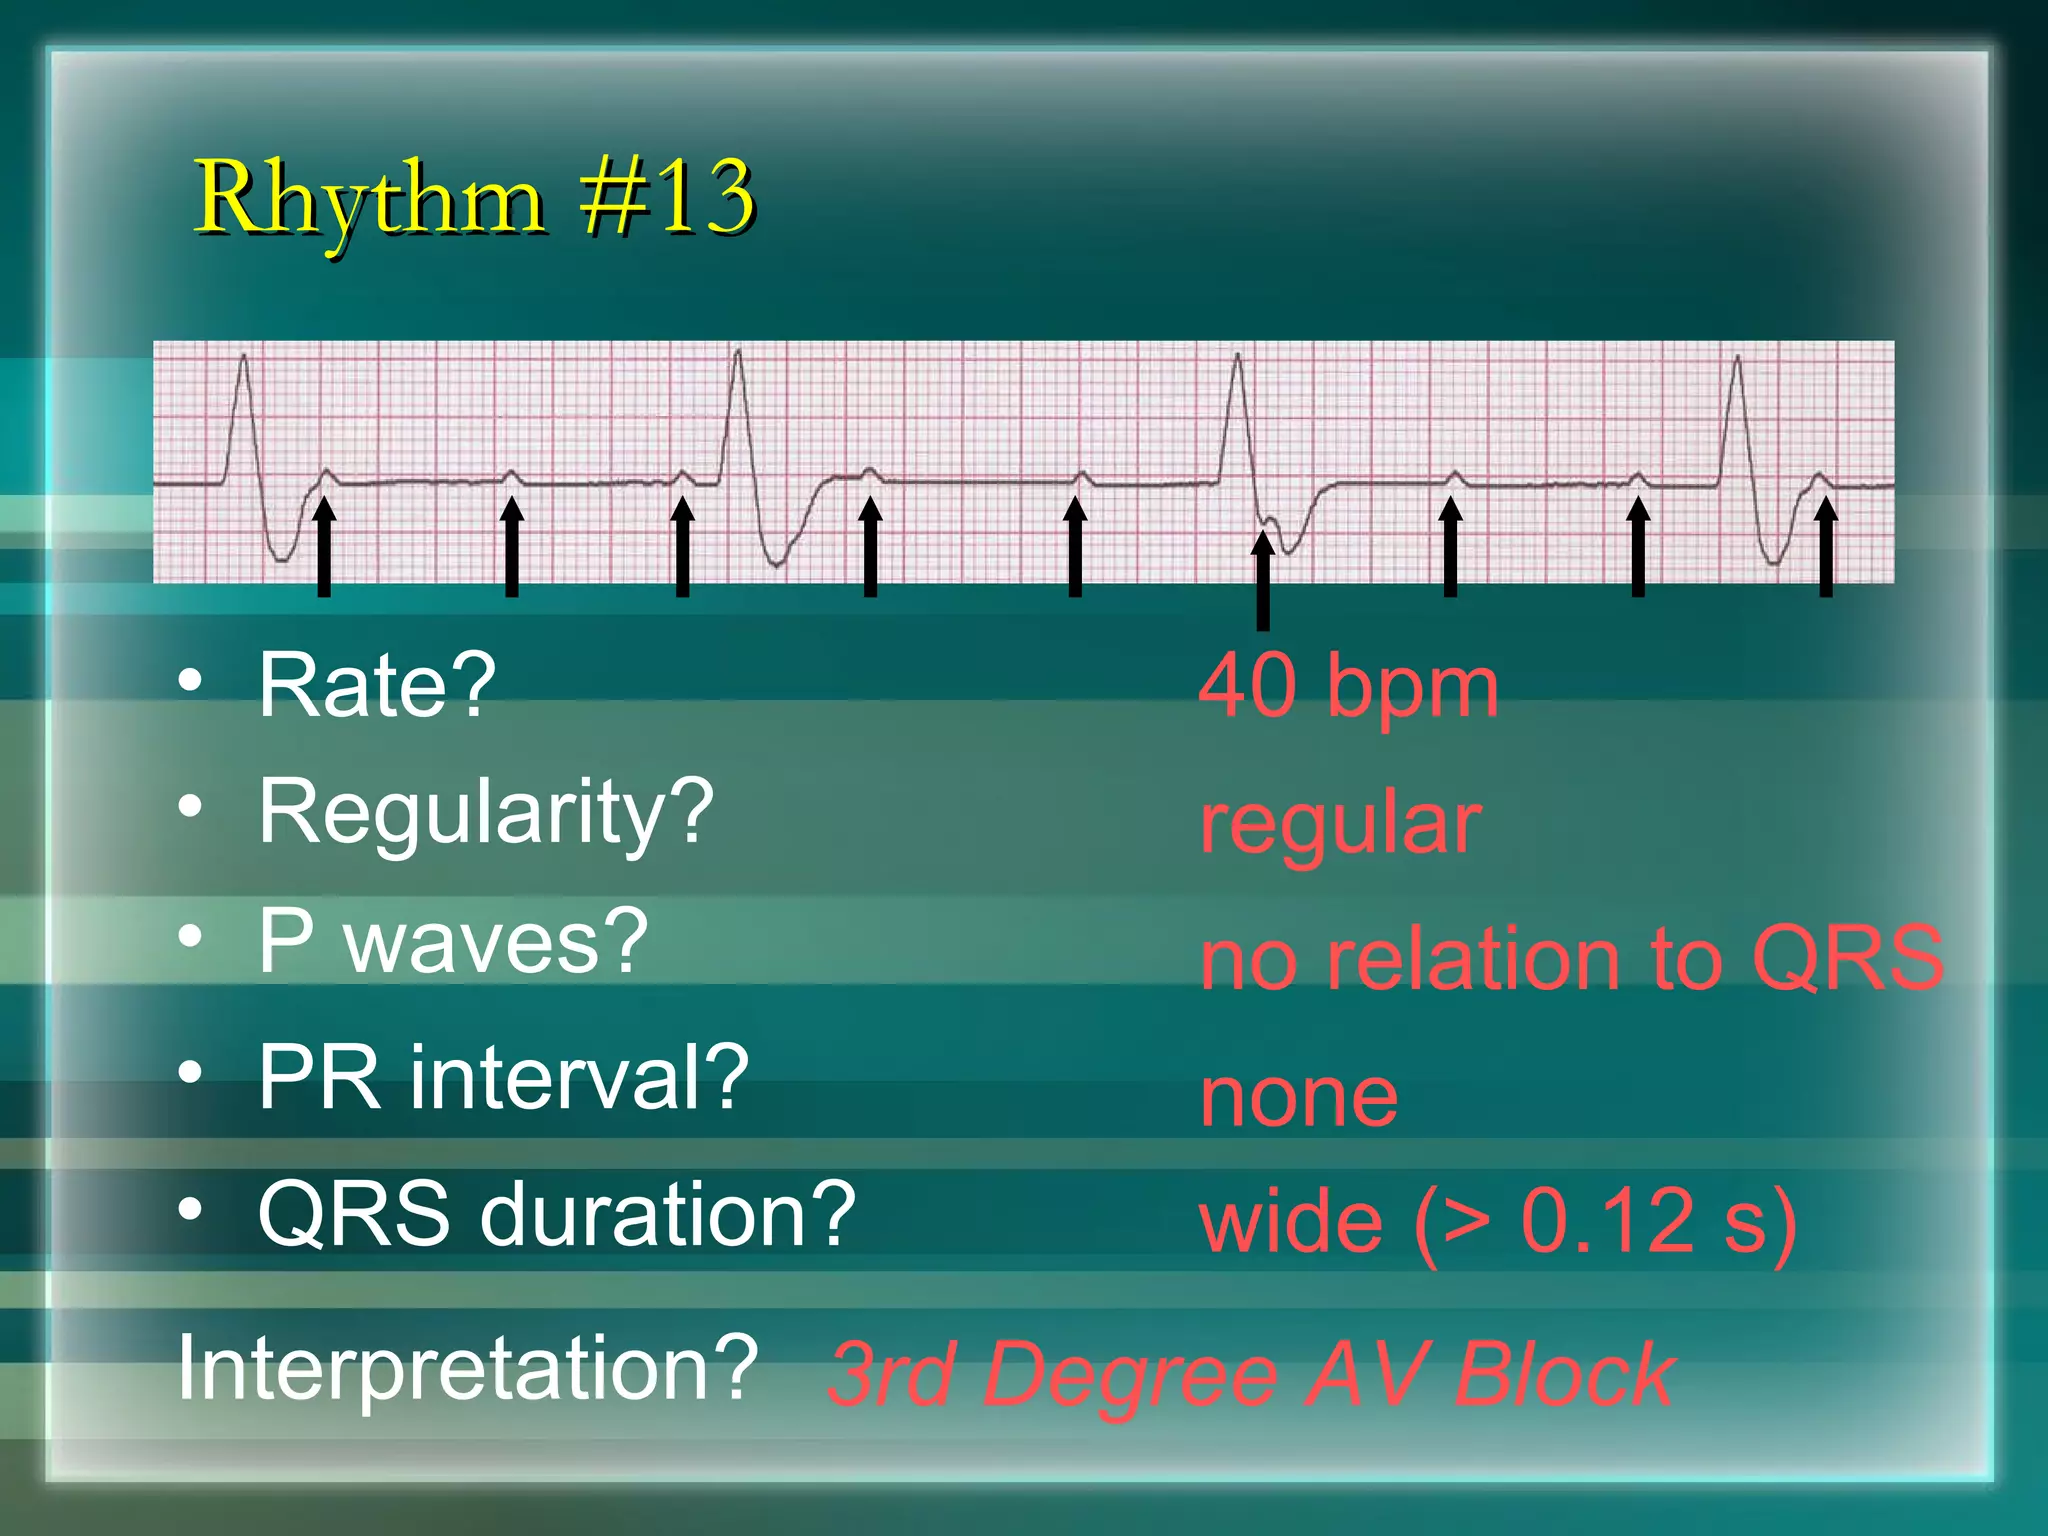
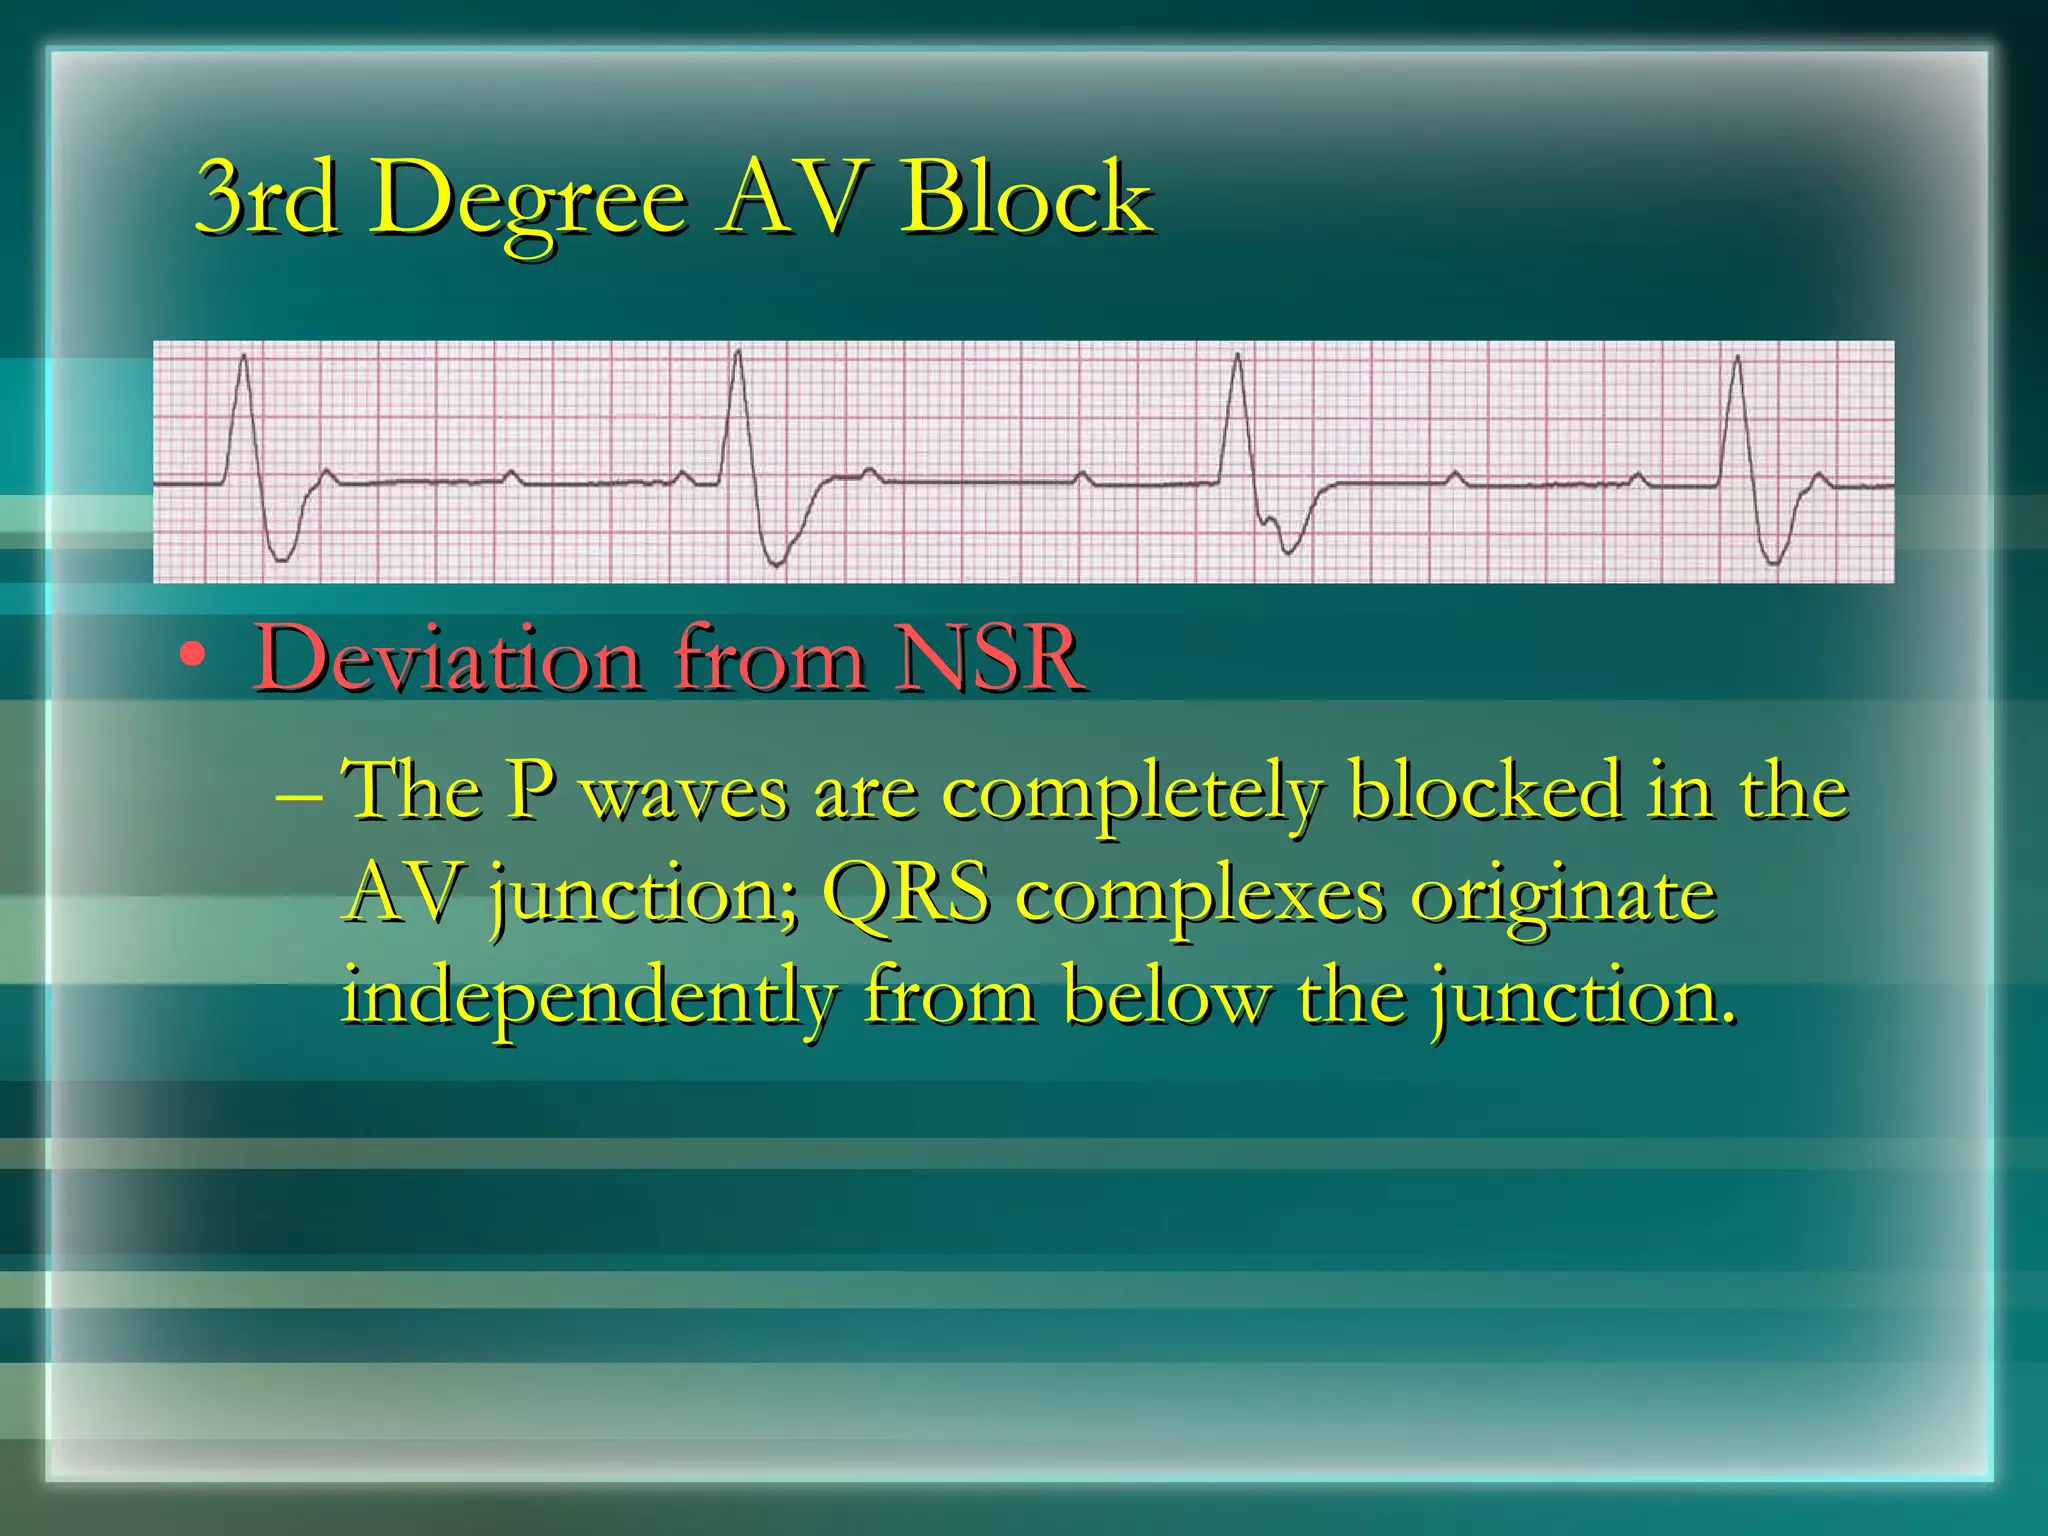

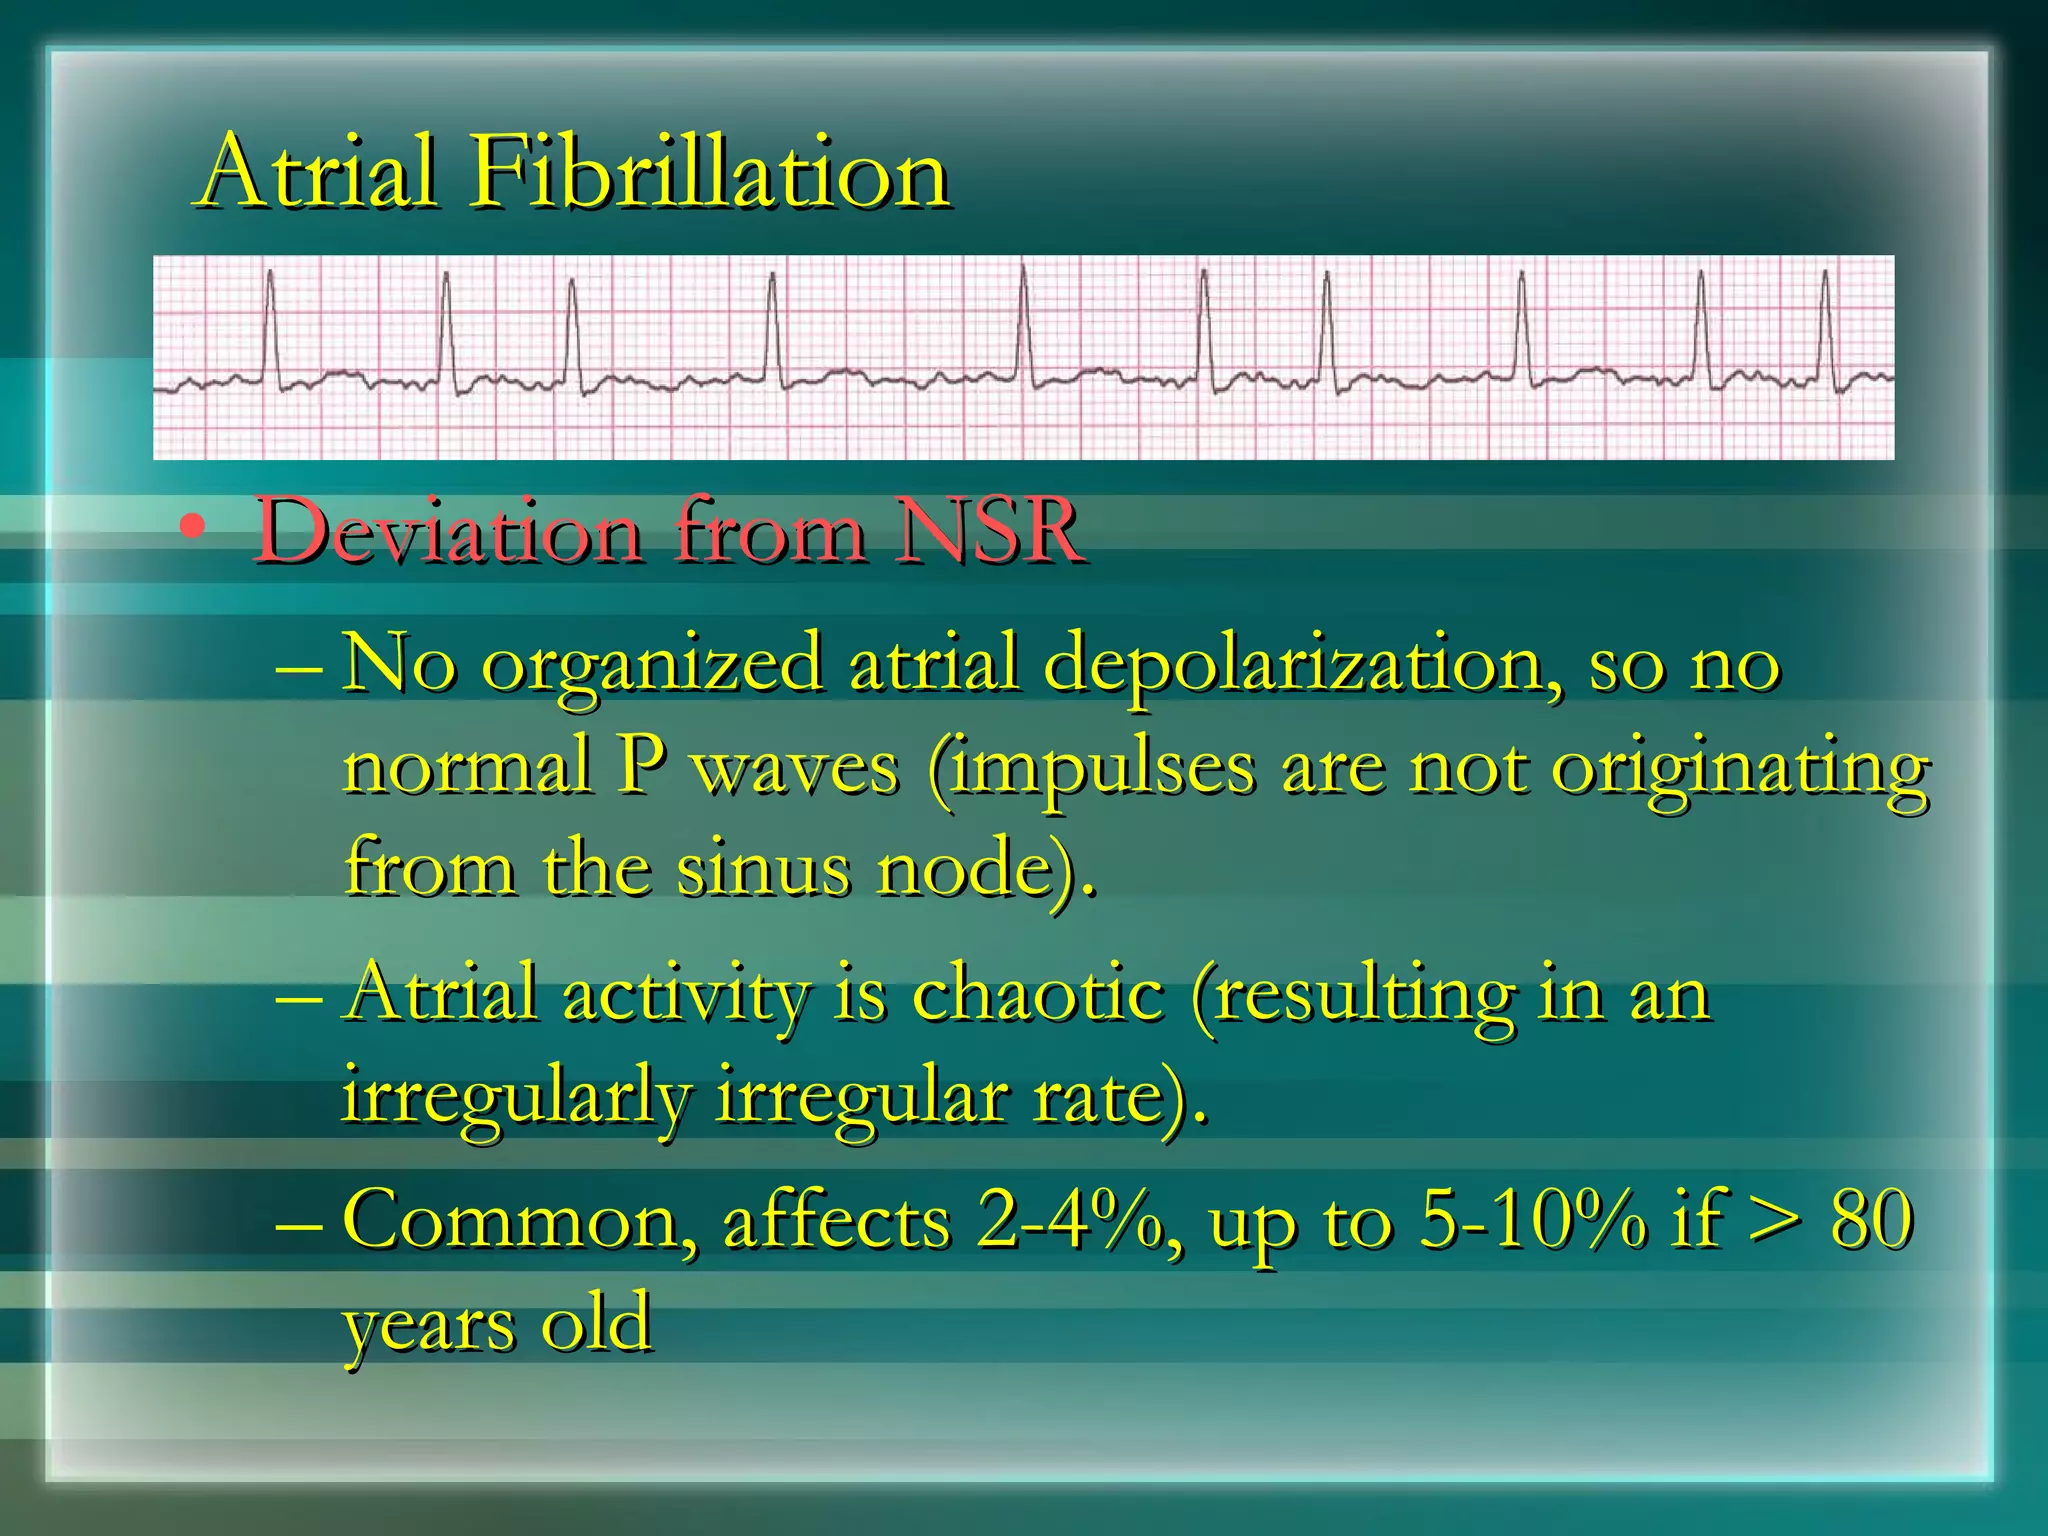

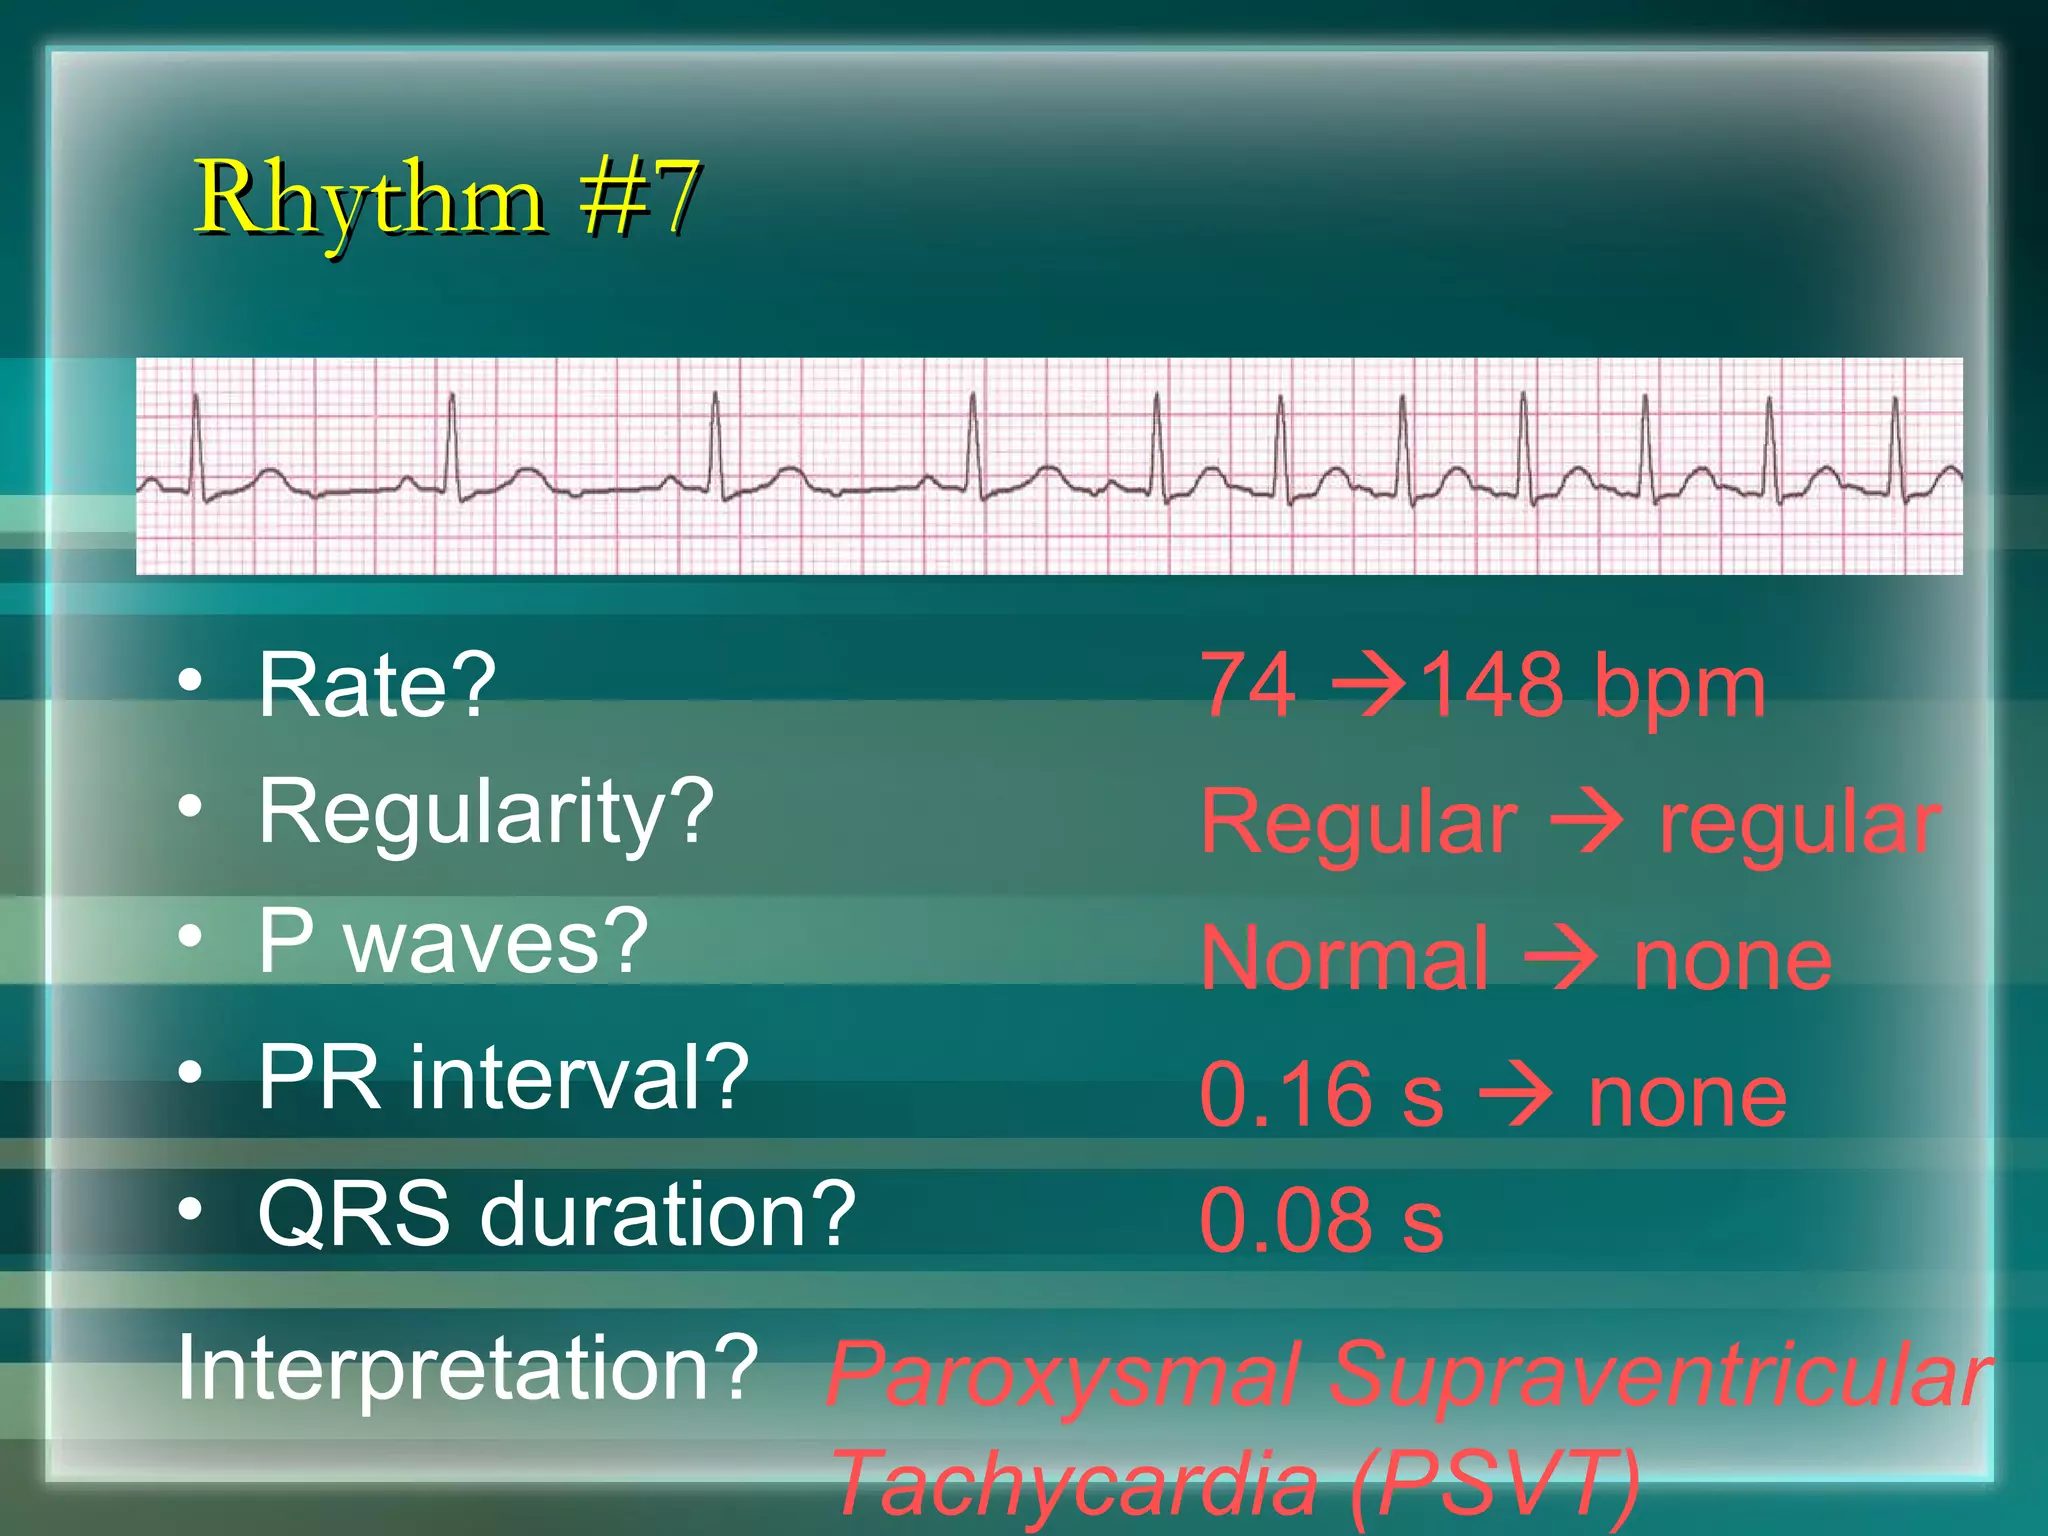


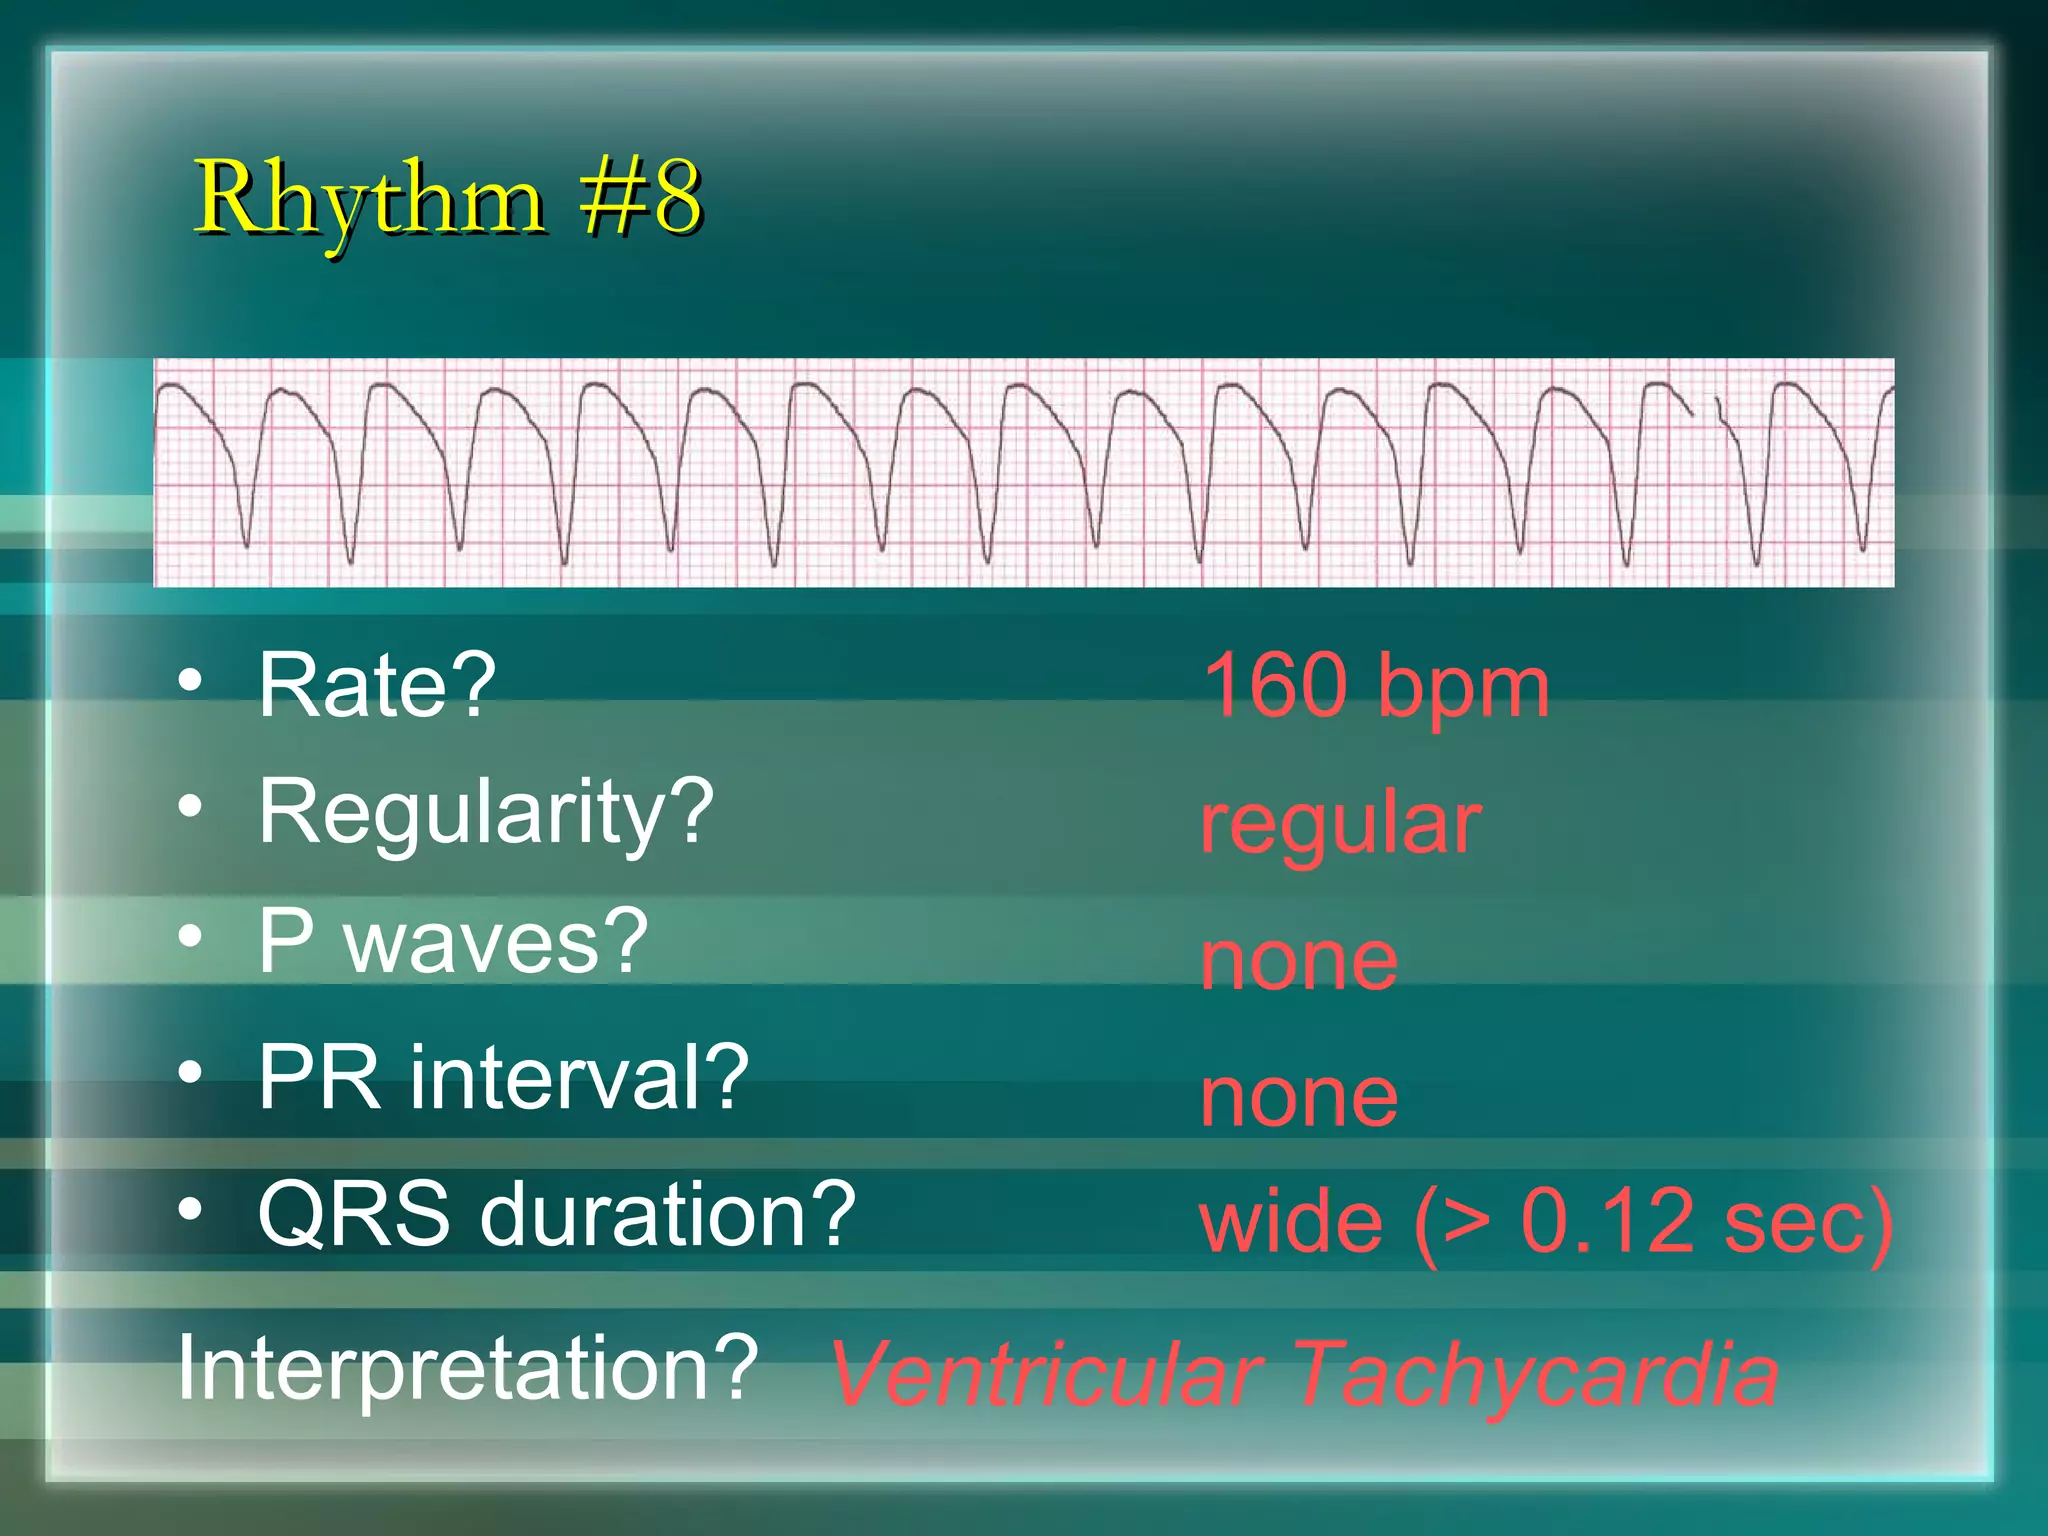


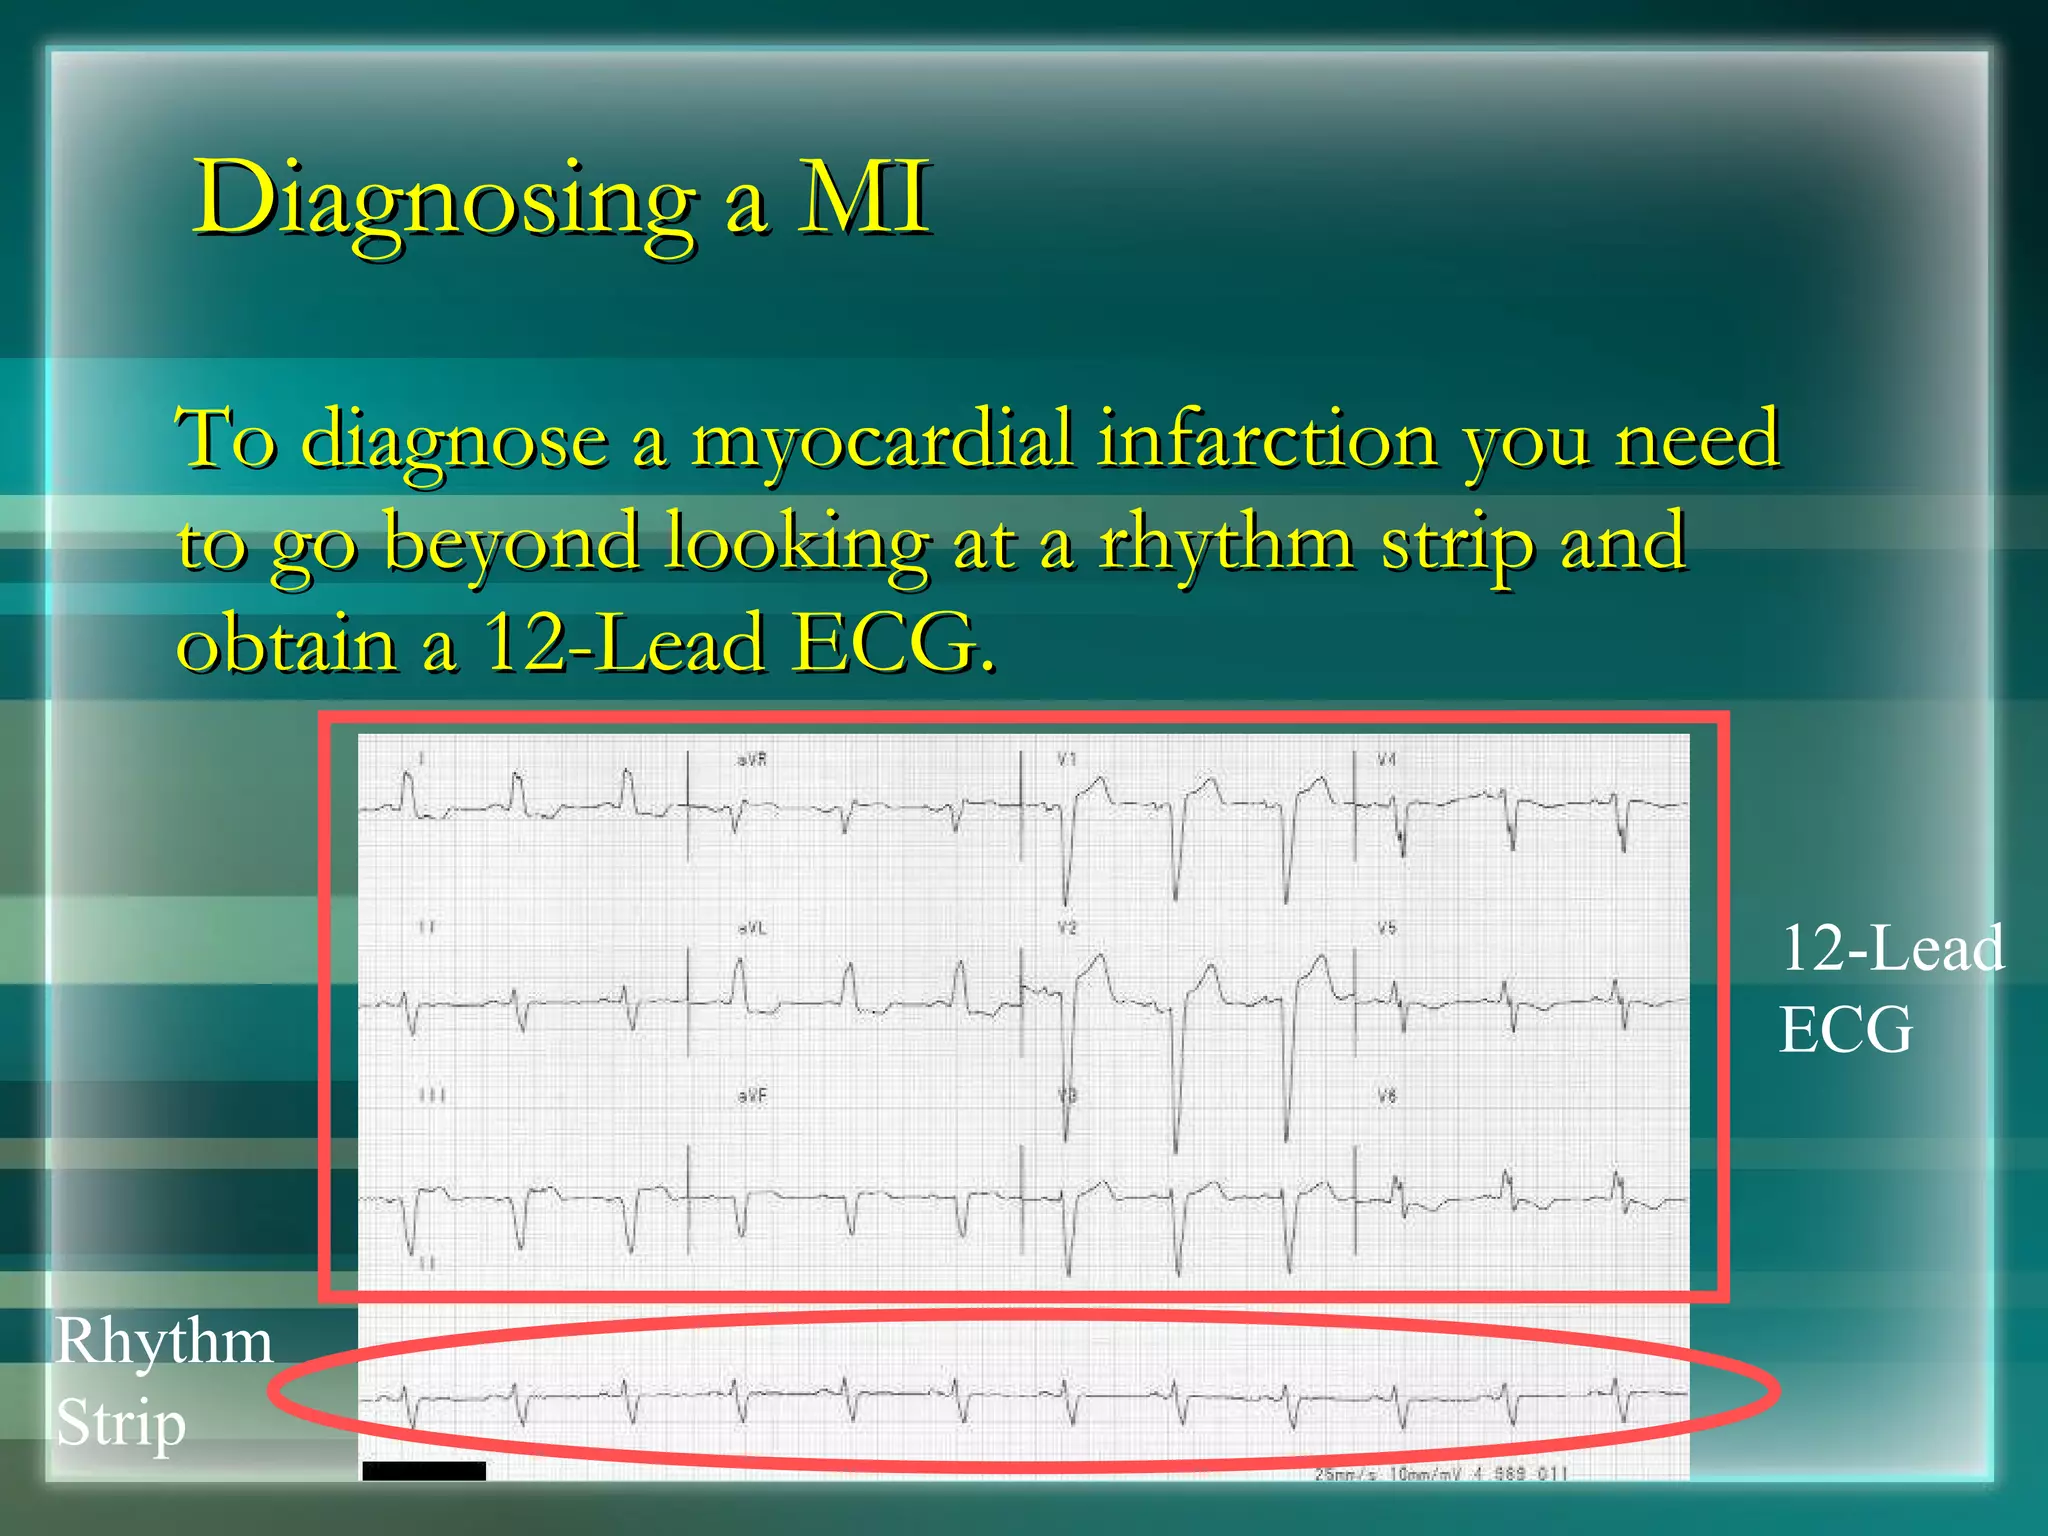
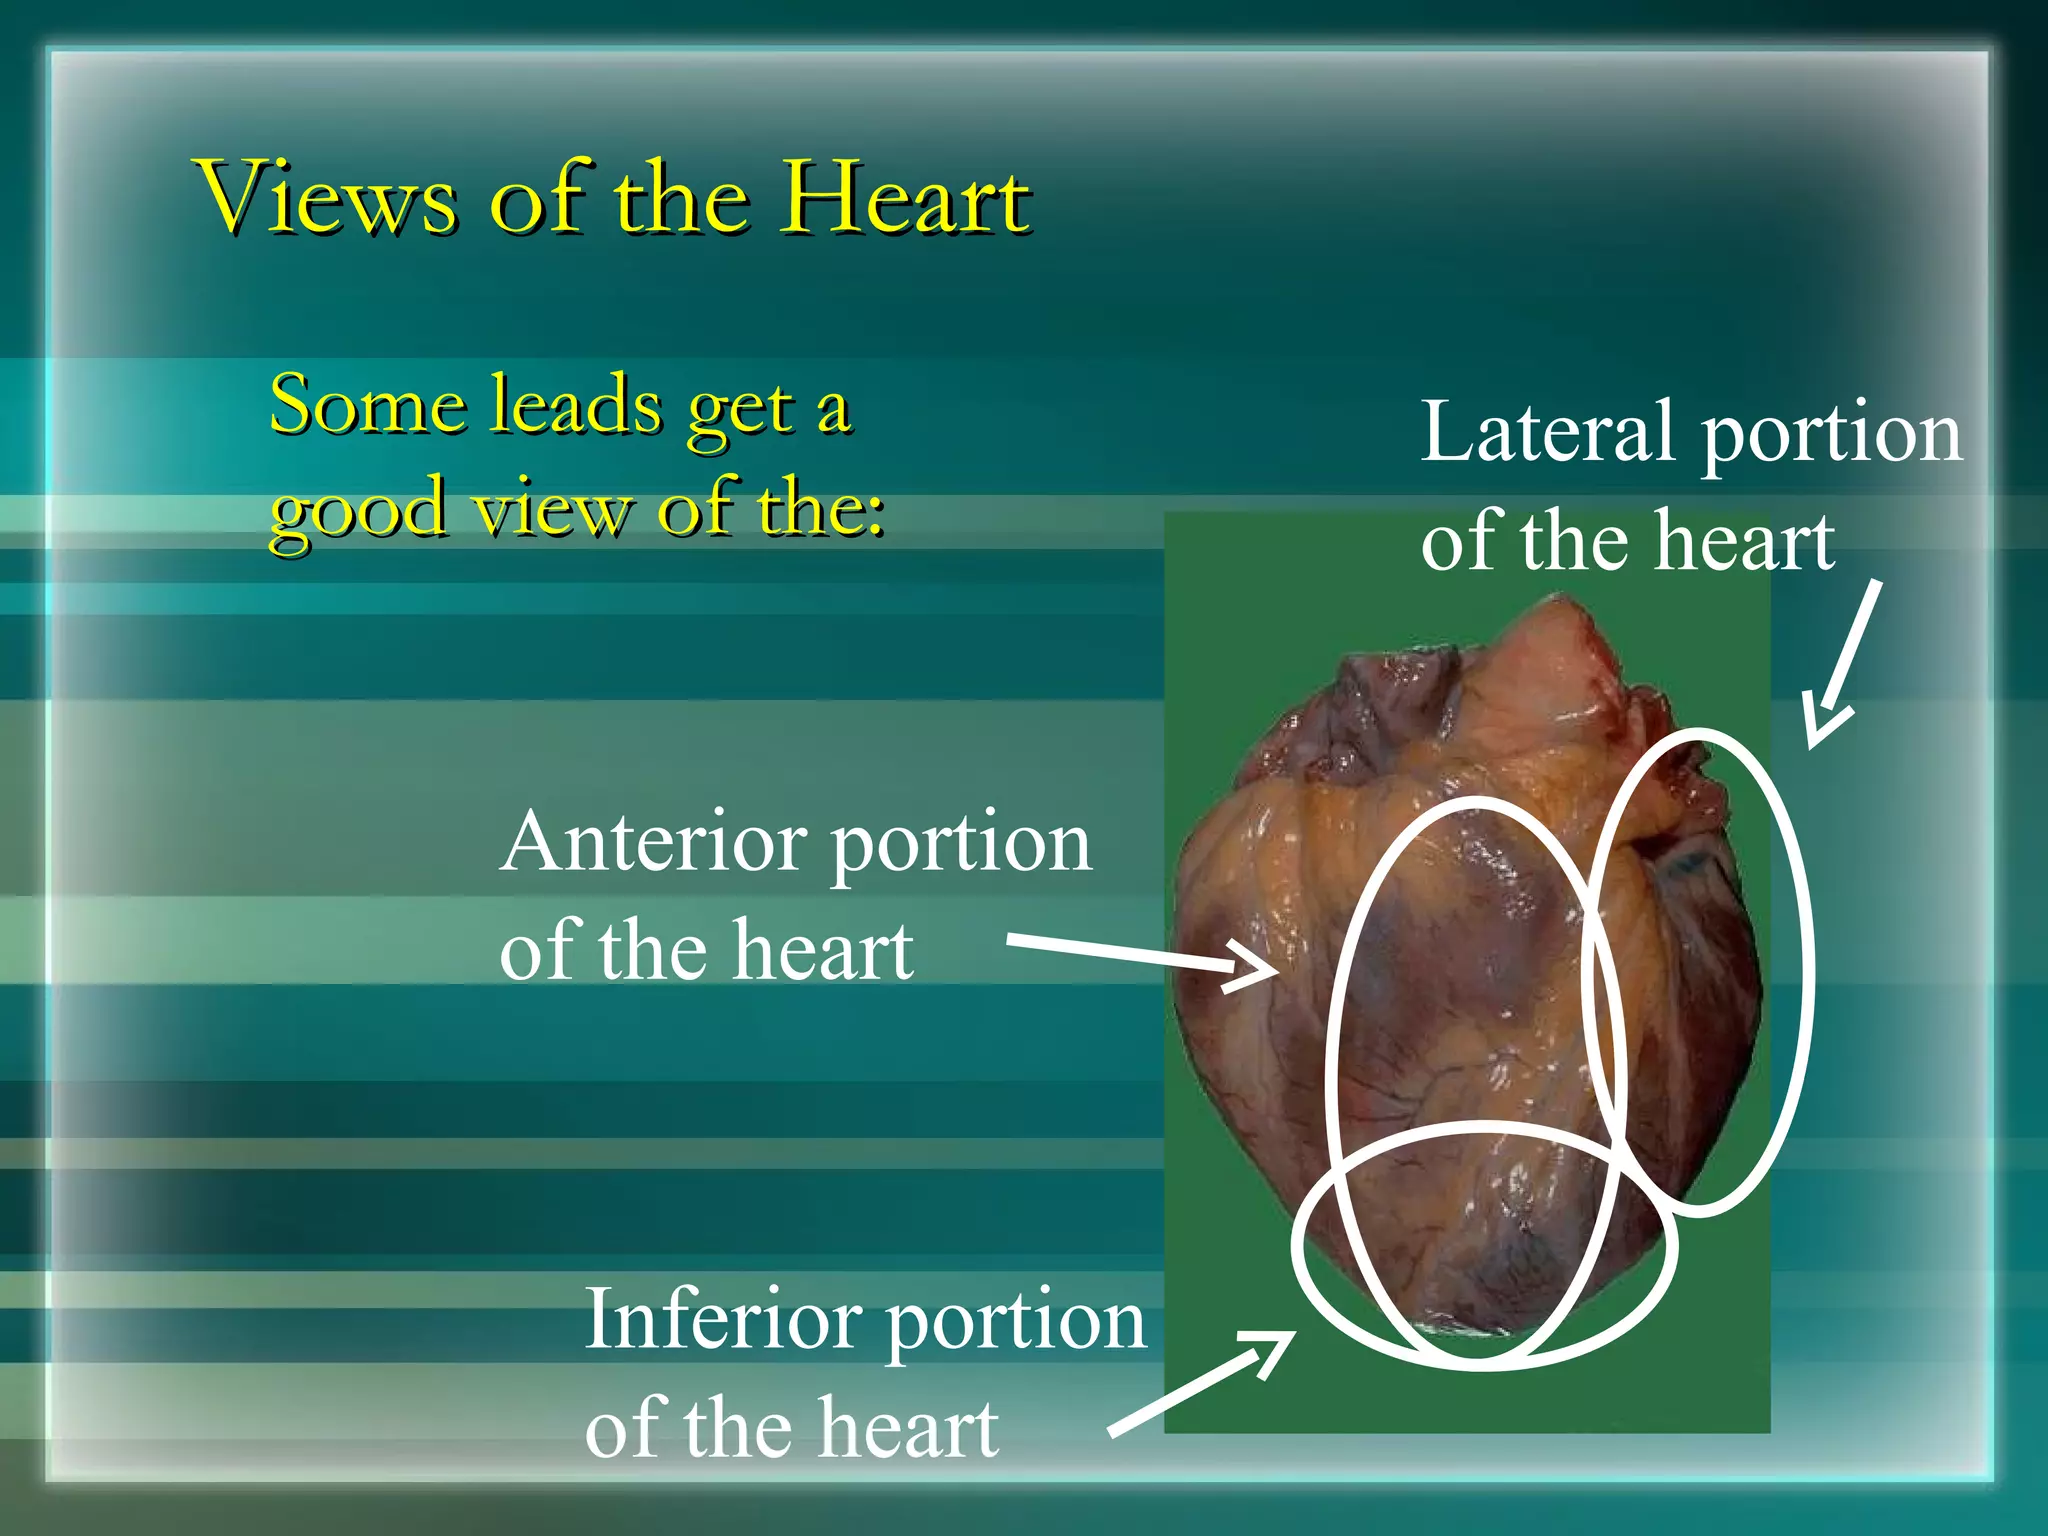
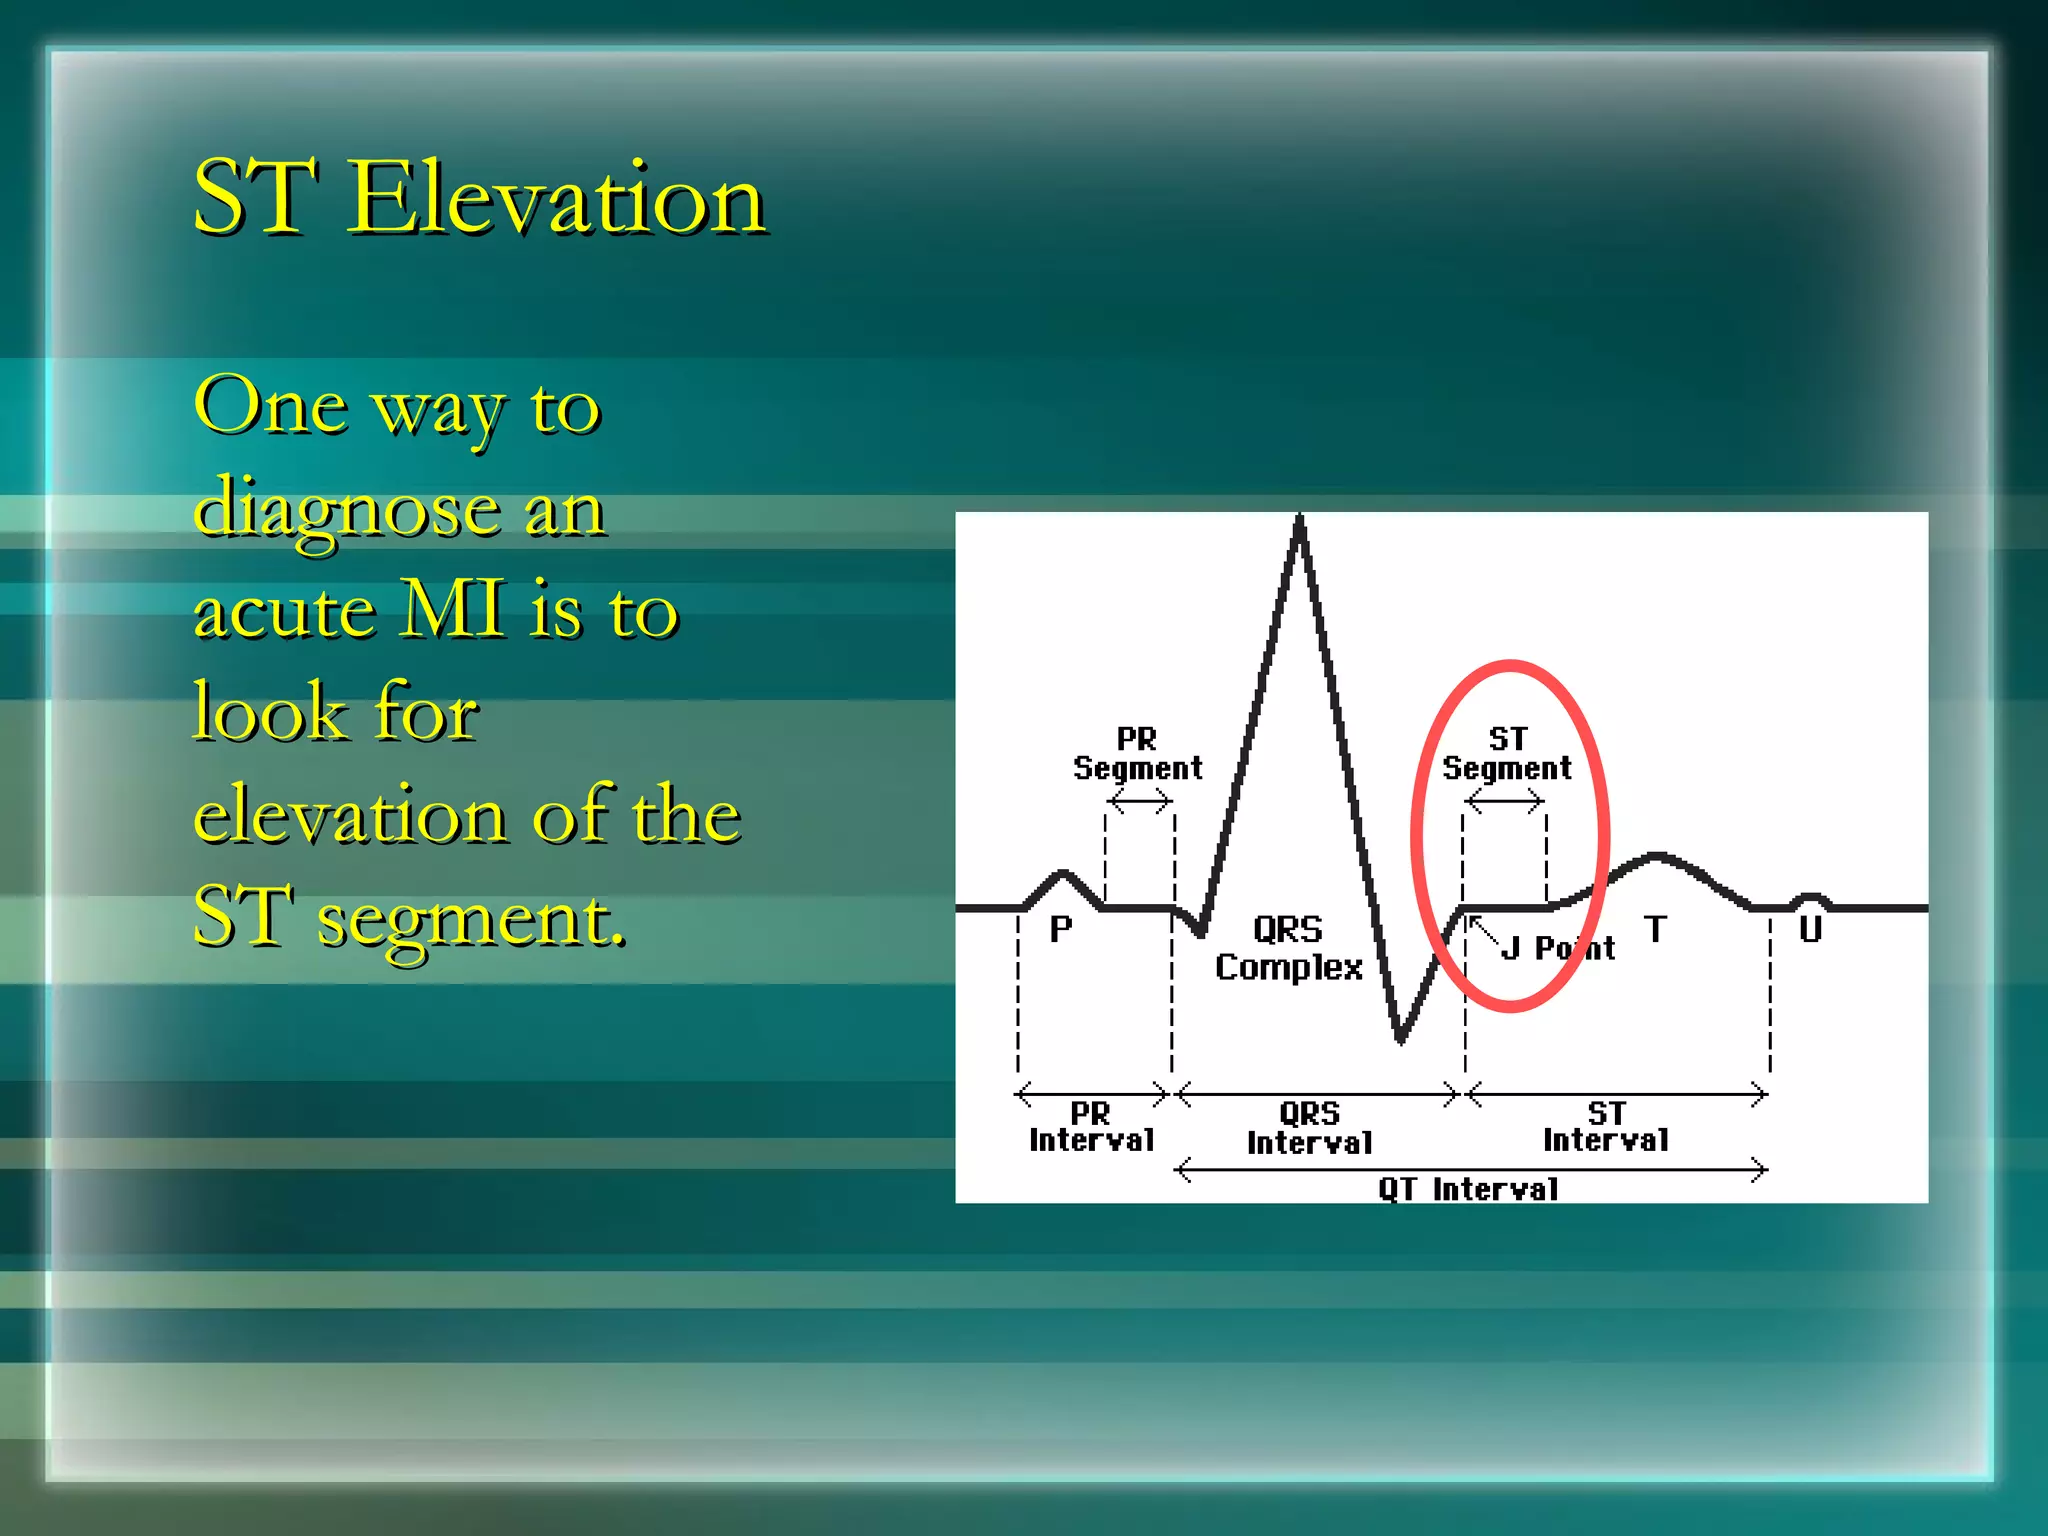
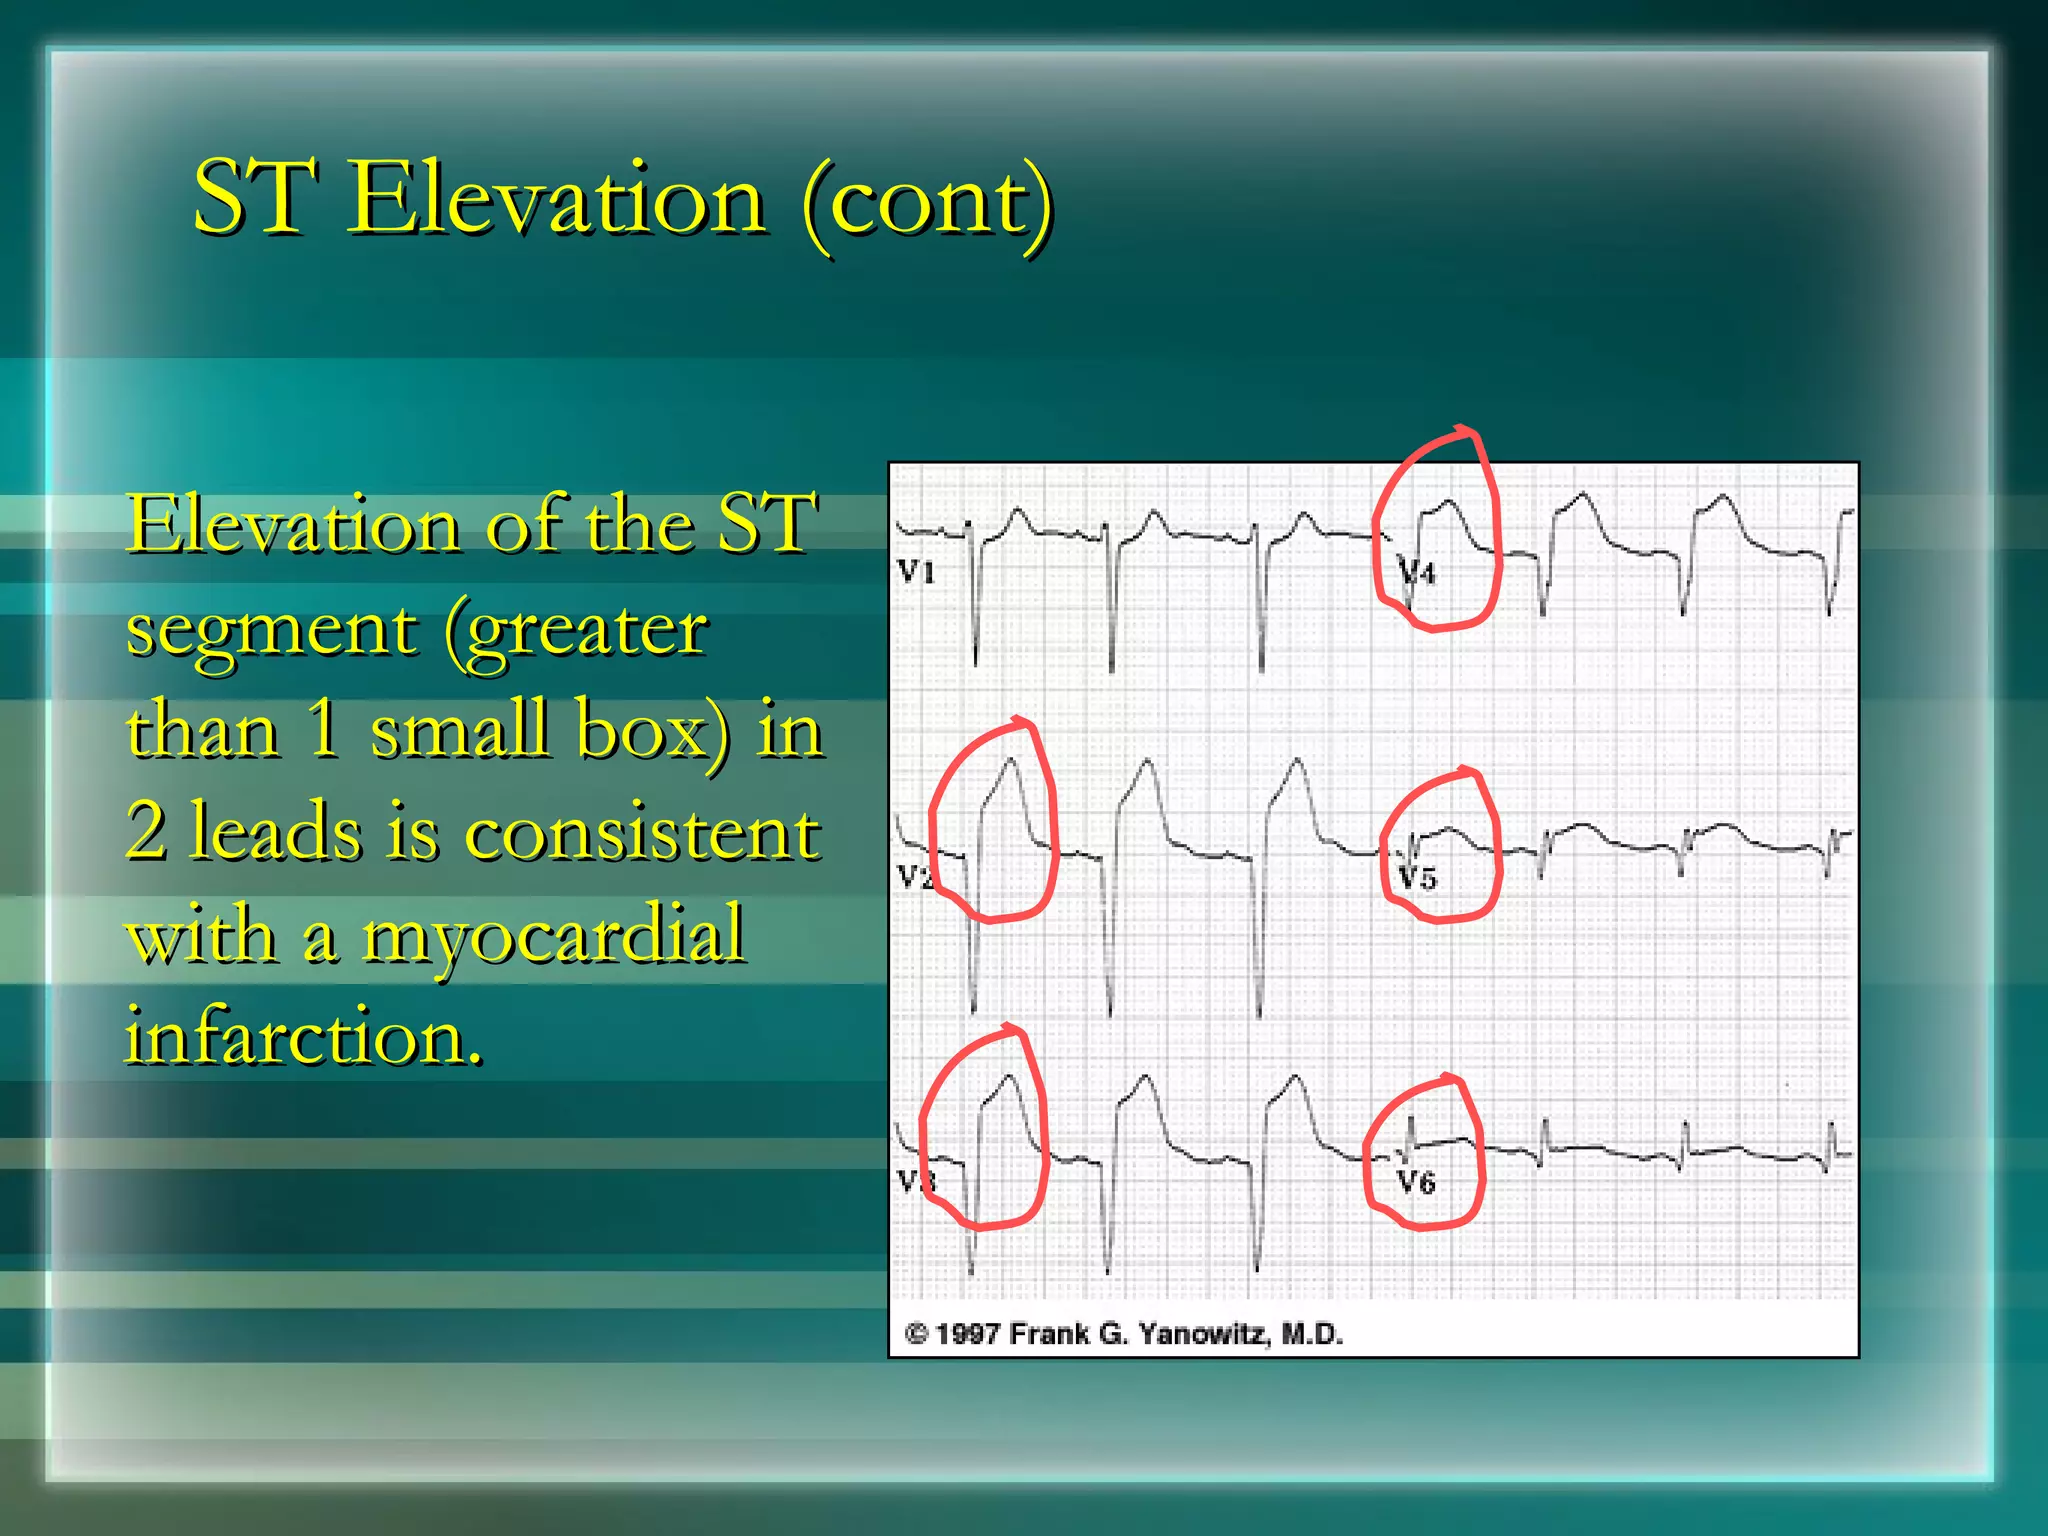
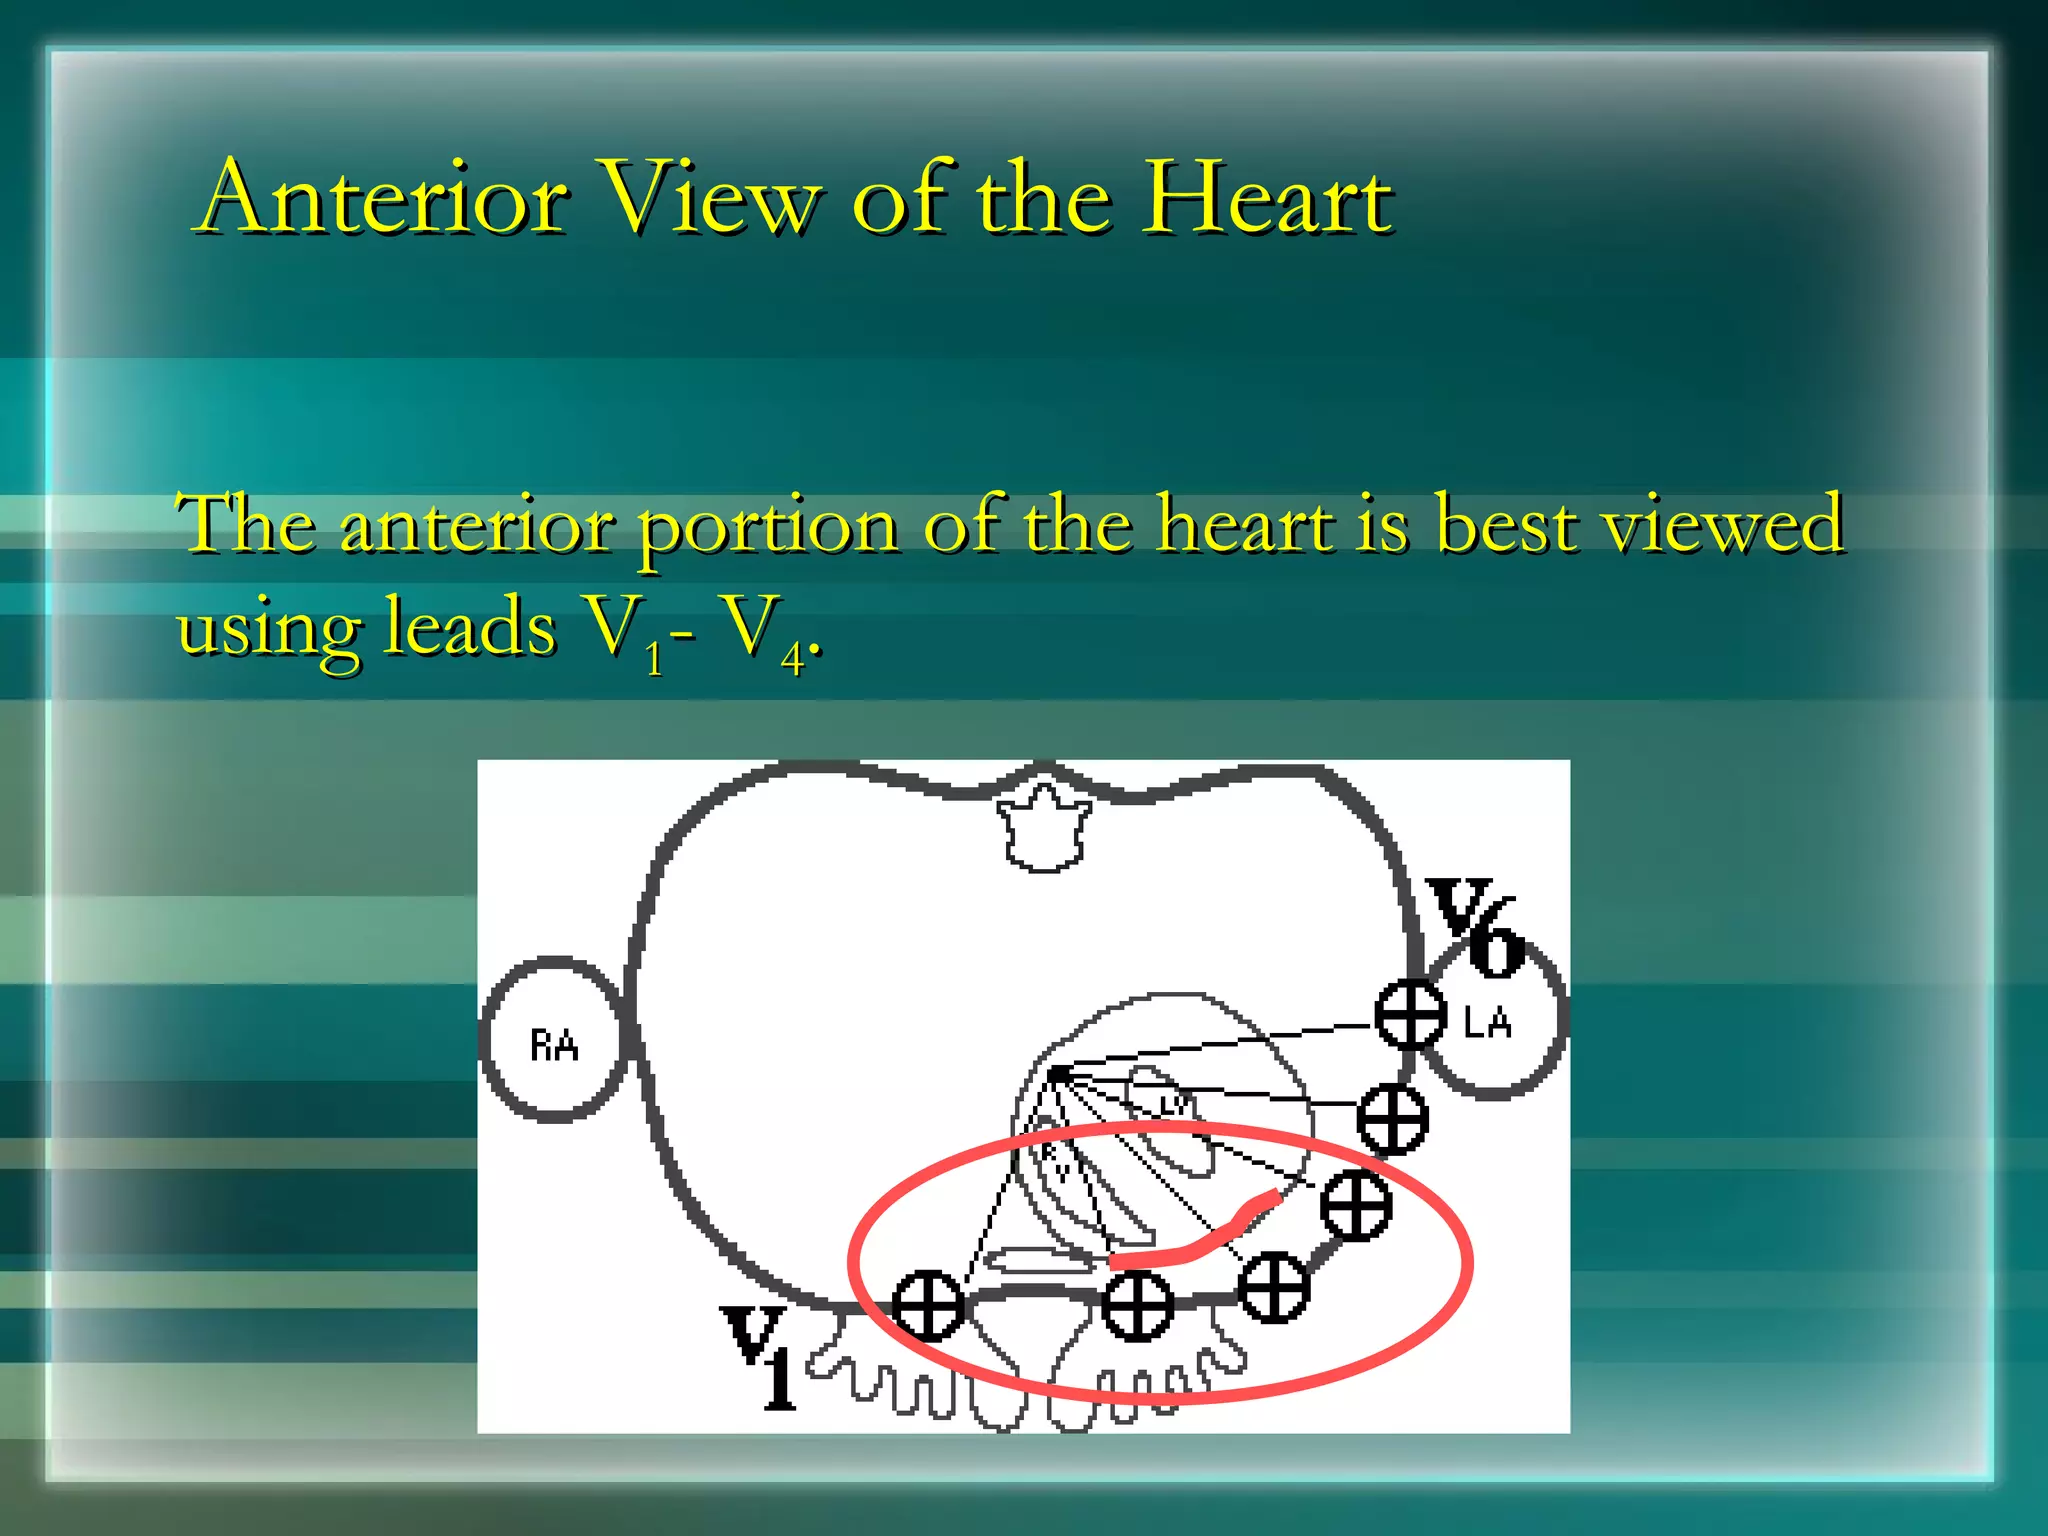


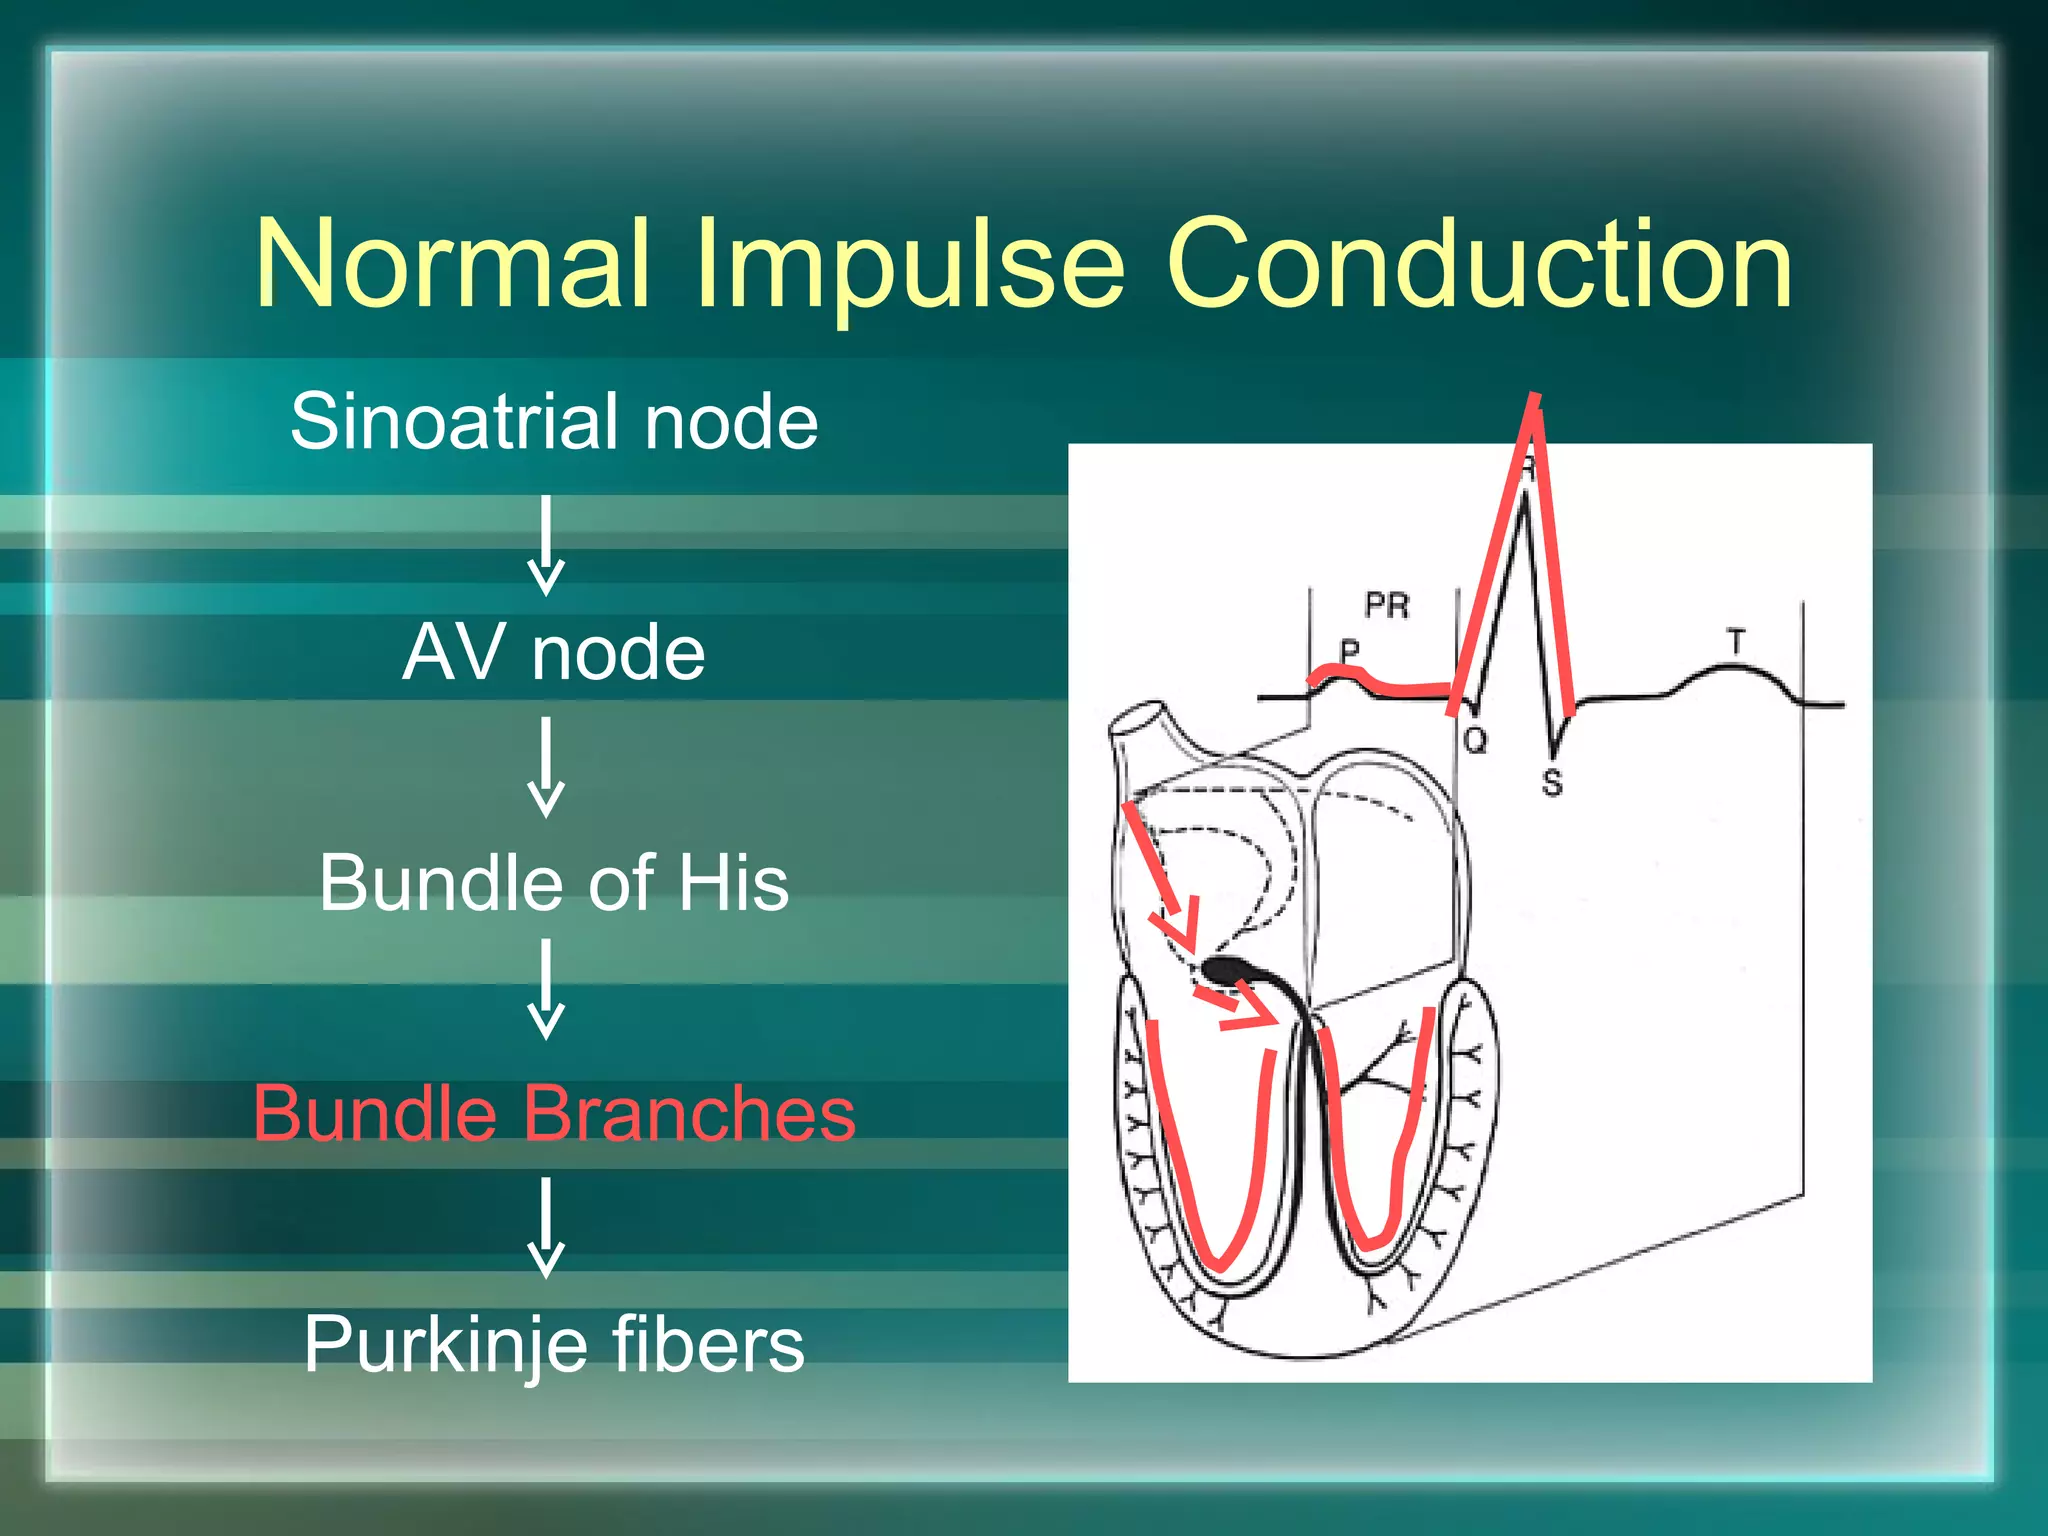


This document provides a summary of basics of electrocardiography (ECG/EKG). It discusses the history and development of ECG technology. It describes the components of a normal ECG waveform including the P, QRS, and T waves. It explains how to determine heart rate from an ECG and identify different arrhythmias based on the waveform. Key anatomical structures involved in heart's electrical conduction system are also outlined.


