Downloaded 897 times


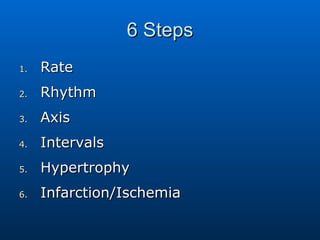


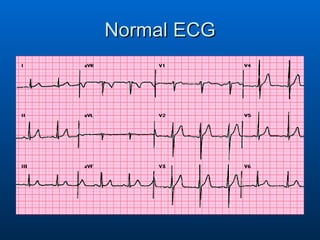

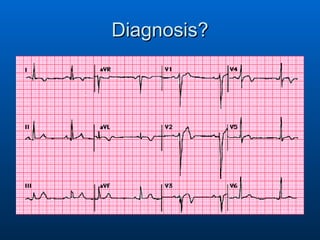


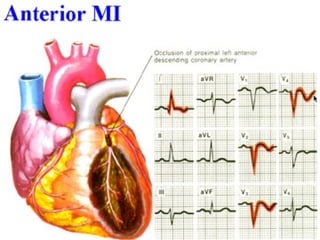
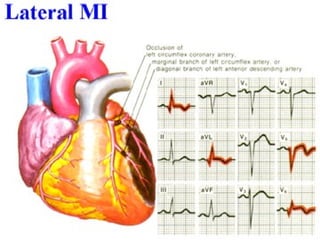
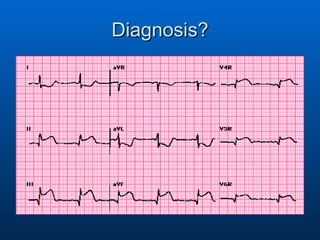

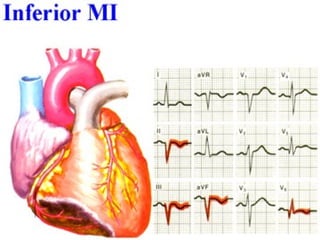
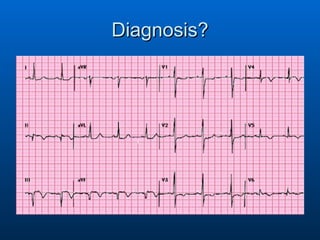


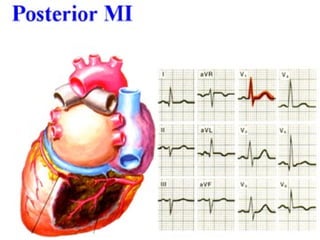
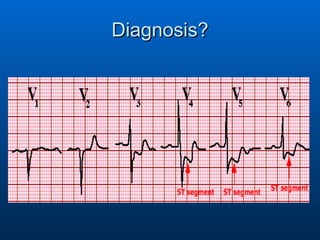

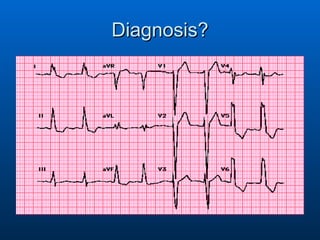


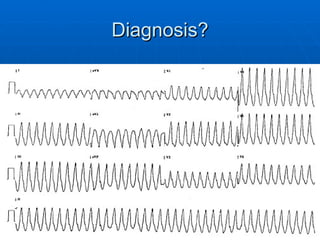
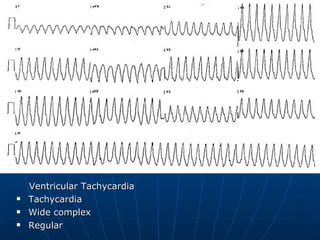


This document provides guidance on electrocardiogram (ECG) interpretation for primary care physicians. It outlines the 6 key steps to analyze an ECG: rate, rhythm, axis, intervals, hypertrophy, and infarction/ischemia. Specific abnormalities that may indicate conditions like sinus tachycardia, atrial fibrillation, left ventricular hypertrophy, myocardial infarction, and heart block are described. Diagnosis of cardiac issues is aided by identifying changes in various leads that correspond to specific areas of the heart.


