Downloaded 937 times

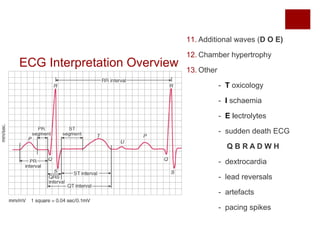

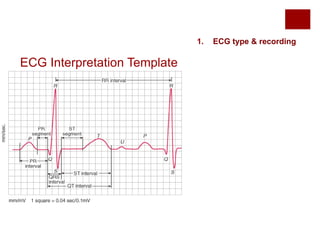
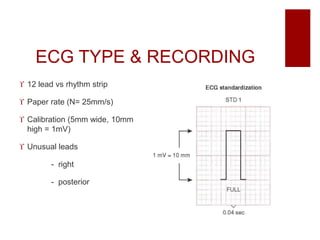


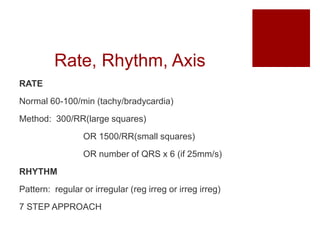
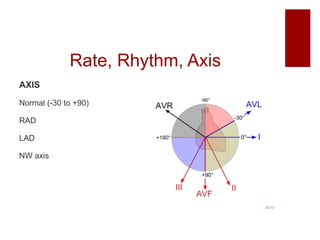

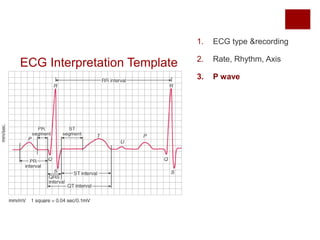


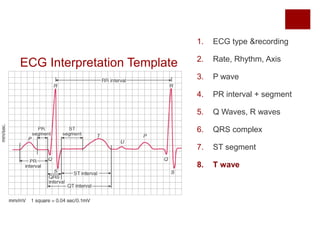


This document provides a template for systematically interpreting electrocardiograms (ECGs). It outlines 13 sections to analyze, including ECG type and recording, rate, rhythm and axis, P wave, PR interval, QRS complex, ST segment, T wave, and U wave. Additional features like delta waves are also addressed. Various abnormalities are defined and associated diagnoses are provided. The template aims to help clinicians make accurate ECG interpretations through a standardized approach.