For a detailed explanation Watch the Youtube video:
https://youtu.be/YK0GPKuYVfU
Classification of Data, methods- geographical classification, Chronological Classification, Qualitative and Quantitative classification, discrete and continuous variable, grouped frequency distribution, inclusive , exclusive series, cumulative frequency distribution
#2 Classification and tabulation of dataKawita Bhatt
The placement of data in different homogenous groups formed on the basis of some characteristics or criteria is called classification. The Table is a systematic arrangement of data in rows and/or column. Here, few basic concepts of classification and tabulation such as class interval, variable, frequency, frequency distribution and cumulative frequency distribution have been explained in a nutshell. This presentation also deals with the basic guidelines for preparing a table. Any suggestion and query are welcomed please drop them in the comments.
Classify data into Qualitative and Quantitative data.
Scales of Measurement in Statistics.
Nominal, Ordinal, Ratio and Interval
Prepare table or continuous frequency distribution.
Topic: Types of Data
Student Name: Duwa
Class: B.Ed. 2.5
Project Name: “Young Teachers' Professional Development (TPD)"
"Project Founder: Prof. Dr. Amjad Ali Arain
Faculty of Education, University of Sindh, Pakistan
This presentation is about Basic Statistics-related to types of Data-Qualitative and Quantitative, and its Examples in everyday life- By: Dr. Farhana Shaheen
Validate data
Questionnaire checking
Edit acceptable questionnaires
Code the questionnaires
Keypunch the data
Clean the data set
Statistically adjust the data
Store the data set for analysis
Analyse data
This presentation is on Measurement and it's scales. There are four different types of scales of measurement, namely, Nominal, Ordinal, Interval and Ratio
Making Data Classification Work for You - 18 Things to Consider When Choosing Data Classification Solutions.
For more information, please visit: http://www.secureislands.com/solutions-classification/
Types of Data, Difference between Primary and Secondary Data, Collection of Primary Data, Questionnaire, Schedules, Interview, Survey, Observation, Secondary Data, Sources of Secondary Data, Tabulation of Data – Meaning and Types
In this chapter you learn:
Definition of Statistics & Identify variables in a statistics.
Types of Statistics
Distinguish b/w quantitative & qualitative variables.
Determine the 4 levels of measurement.
Identify populations & samples.
Distinguish different types of Sampling
Classification of data is a crucial part of statistics. Here in this presentation we have discussed everything about classification of data. Watch this presentation till the end to get confident about data classification in statistics.
Republic Act 8293, section 176 states that: No copyright shall subsist in any work of the Government of the Philippines. However, prior approval of the government agency or office wherein the work is created shall be necessary for exploitation of such work for profit. Such agency or office may, among other things, impose as a condition the payment of royalties.
Ethnobotany and Ethnopharmacology:
Ethnobotany in herbal drug evaluation,
Impact of Ethnobotany in traditional medicine,
New development in herbals,
Bio-prospecting tools for drug discovery,
Role of Ethnopharmacology in drug evaluation,
Reverse Pharmacology.
The Roman Empire A Historical Colossus.pdfkaushalkr1407
The Roman Empire, a vast and enduring power, stands as one of history's most remarkable civilizations, leaving an indelible imprint on the world. It emerged from the Roman Republic, transitioning into an imperial powerhouse under the leadership of Augustus Caesar in 27 BCE. This transformation marked the beginning of an era defined by unprecedented territorial expansion, architectural marvels, and profound cultural influence.
The empire's roots lie in the city of Rome, founded, according to legend, by Romulus in 753 BCE. Over centuries, Rome evolved from a small settlement to a formidable republic, characterized by a complex political system with elected officials and checks on power. However, internal strife, class conflicts, and military ambitions paved the way for the end of the Republic. Julius Caesar’s dictatorship and subsequent assassination in 44 BCE created a power vacuum, leading to a civil war. Octavian, later Augustus, emerged victorious, heralding the Roman Empire’s birth.
Under Augustus, the empire experienced the Pax Romana, a 200-year period of relative peace and stability. Augustus reformed the military, established efficient administrative systems, and initiated grand construction projects. The empire's borders expanded, encompassing territories from Britain to Egypt and from Spain to the Euphrates. Roman legions, renowned for their discipline and engineering prowess, secured and maintained these vast territories, building roads, fortifications, and cities that facilitated control and integration.
The Roman Empire’s society was hierarchical, with a rigid class system. At the top were the patricians, wealthy elites who held significant political power. Below them were the plebeians, free citizens with limited political influence, and the vast numbers of slaves who formed the backbone of the economy. The family unit was central, governed by the paterfamilias, the male head who held absolute authority.
Culturally, the Romans were eclectic, absorbing and adapting elements from the civilizations they encountered, particularly the Greeks. Roman art, literature, and philosophy reflected this synthesis, creating a rich cultural tapestry. Latin, the Roman language, became the lingua franca of the Western world, influencing numerous modern languages.
Roman architecture and engineering achievements were monumental. They perfected the arch, vault, and dome, constructing enduring structures like the Colosseum, Pantheon, and aqueducts. These engineering marvels not only showcased Roman ingenuity but also served practical purposes, from public entertainment to water supply.
Instructions for Submissions thorugh G- Classroom.pptxJheel Barad
This presentation provides a briefing on how to upload submissions and documents in Google Classroom. It was prepared as part of an orientation for new Sainik School in-service teacher trainees. As a training officer, my goal is to ensure that you are comfortable and proficient with this essential tool for managing assignments and fostering student engagement.
How to Create Map Views in the Odoo 17 ERPCeline George
The map views are useful for providing a geographical representation of data. They allow users to visualize and analyze the data in a more intuitive manner.
Students, digital devices and success - Andreas Schleicher - 27 May 2024..pptxEduSkills OECD
Andreas Schleicher presents at the OECD webinar ‘Digital devices in schools: detrimental distraction or secret to success?’ on 27 May 2024. The presentation was based on findings from PISA 2022 results and the webinar helped launch the PISA in Focus ‘Managing screen time: How to protect and equip students against distraction’ https://www.oecd-ilibrary.org/education/managing-screen-time_7c225af4-en and the OECD Education Policy Perspective ‘Students, digital devices and success’ can be found here - https://oe.cd/il/5yV
The Indian economy is classified into different sectors to simplify the analysis and understanding of economic activities. For Class 10, it's essential to grasp the sectors of the Indian economy, understand their characteristics, and recognize their importance. This guide will provide detailed notes on the Sectors of the Indian Economy Class 10, using specific long-tail keywords to enhance comprehension.
For more information, visit-www.vavaclasses.com
Palestine last event orientationfvgnh .pptxRaedMohamed3
An EFL lesson about the current events in Palestine. It is intended to be for intermediate students who wish to increase their listening skills through a short lesson in power point.
Synthetic Fiber Construction in lab .pptxPavel ( NSTU)
Synthetic fiber production is a fascinating and complex field that blends chemistry, engineering, and environmental science. By understanding these aspects, students can gain a comprehensive view of synthetic fiber production, its impact on society and the environment, and the potential for future innovations. Synthetic fibers play a crucial role in modern society, impacting various aspects of daily life, industry, and the environment. ynthetic fibers are integral to modern life, offering a range of benefits from cost-effectiveness and versatility to innovative applications and performance characteristics. While they pose environmental challenges, ongoing research and development aim to create more sustainable and eco-friendly alternatives. Understanding the importance of synthetic fibers helps in appreciating their role in the economy, industry, and daily life, while also emphasizing the need for sustainable practices and innovation.
Read| The latest issue of The Challenger is here! We are thrilled to announce that our school paper has qualified for the NATIONAL SCHOOLS PRESS CONFERENCE (NSPC) 2024. Thank you for your unwavering support and trust. Dive into the stories that made us stand out!
We all have good and bad thoughts from time to time and situation to situation. We are bombarded daily with spiraling thoughts(both negative and positive) creating all-consuming feel , making us difficult to manage with associated suffering. Good thoughts are like our Mob Signal (Positive thought) amidst noise(negative thought) in the atmosphere. Negative thoughts like noise outweigh positive thoughts. These thoughts often create unwanted confusion, trouble, stress and frustration in our mind as well as chaos in our physical world. Negative thoughts are also known as “distorted thinking”.
2. What is classification of data?
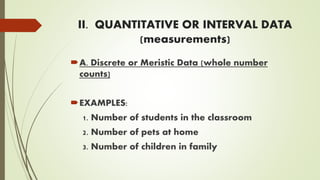
Data classification is the
process of organizing
data into categories for
its most effective and
efficient use.
3. A well- planned data
classification system makes
essential data easy to find
and retrieve.
4. 3 - 4
Types of Data
Recognizing and understanding the
different data types is an important
component of proper data use and
interpretation.
Reviewed 15 April 2005 /MODULE 2
5. 3 - 5
Data are often discussed in terms of
variables, where a variable is:
Any characteristic that varies from
one member of a population to
another.
A simple example is height in
centimeters, which varies from
person to person.
Data and Variables
6. TYPES OF DATA
QUALITATIVE DATA
QUANTITATIVE OR INTERVAL
DATA(measurements)
CHRONOLOGICAL BASE
TEMPORAL BASE
7. 1. QUALITATIVE DATA
A. NOMINAL, ATTRIBUTE OR CATEGORICAL DATA:
Examples:
1. Gender
2. Religion
3.Countries
4. Civil Status
8. 1.QUALITATIVE DATA
B. Ordinal or Ranked Data: one value is greater
or less than another, but the magnitude of the
difference is unknown.
EXAMPLES:
1. Student Performance(outstanding, very
satisfactory, satisfactory, unsatisfactory)
2. Income (10, 000.00- 15, 000.00, 20, 000.00- 50, 000.00)
9. II. QUANTITATIVE OR INTERVAL DATA
(measurements)
A. Discrete or Meristic Data (whole number
counts)
EXAMPLES:
1. Number of students in the classroom
2. Number of pets at home
3. Number of children in family
10. B. Continuous Measurements (rational numbers, limited by
the accuracy of your measurements)
EXAMPLES:
1. Height
2. Weight
3. Grades
11. III. Chronological base
Data are classified by geographical regions or
locations, like states, provinces, cities,
countries.
12. IV. Temporal base
Data are classified or arranged by their time
occurrence, such as years, months, weeks,
days, etc.,
14. I. One-way Classification
Data keeping are viewed by single characteristics
Example:
population of the world are classified by religion
15. II. Two-way Classification
We consider two characteristics at a time
Example:
population of the world are classified according to
religion and sex
16. III. Multi-way Classification
We consider more than two characteristics at a
time
Example:
population of the world are classified according to
religion, sex and literacy