Basic Statistics and Data Analysis
What is Statistics ?
“ Statistics is the methodology which scientists and
mathematicians have developed for interpreting and
drawing conclusions from collected data ”
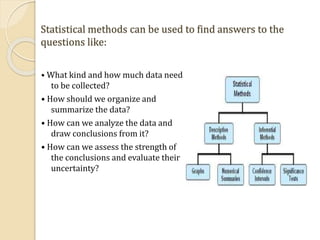
Statistical methods can be used to find answers to the
questions like:
• What kind and how much data need
to be collected?
• How should we organize and
summarize the data?
• How can we analyze the data and
draw conclusions from it?
• How can we assess the strength of
the conclusions and evaluate their
uncertainty?
Statistics provides methods for :
1. Design:
Planning and carrying out research
studies.
2. Description:
Summarizing and exploring data.
3. Inference:
Making predictions and
generalizing about phenomena
represented by the data.
Population and Sample
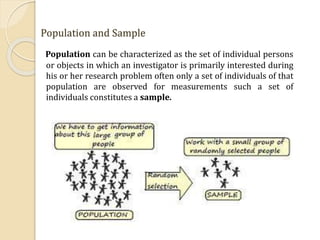
Population can be characterized as the set of individual persons
or objects in which an investigator is primarily interested during
his or her research problem often only a set of individuals of that
population are observed for measurements such a set of
individuals constitutes a sample.
Parameters and Statistics
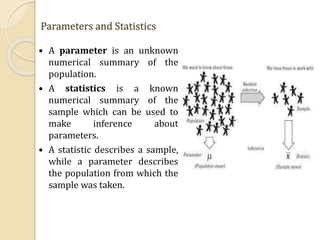
 A parameter is an unknown
numerical summary of the
population.
 A statistics is a known
numerical summary of the
sample which can be used to
make inference about
parameters.
 A statistic describes a sample,
while a parameter describes
the population from which the
sample was taken.
Basic Descriptive Statistics
 Mean: The mean (also know as average),
is obtained by dividing the sum of
observed values by the number of
observations.
 Standard Deviation: The standard
deviation gives an idea of how close the
entire set of data is to the average value.
Data sets with a small standard deviation
have tightly grouped. Data sets with large
standard deviations have data spread out
over a wide range of values.
 Variance: Measures how far a set of
numbers is spread out. A variance of
zero indicates that all the values are
identical. Variance is always non-negative,
a small variance indicates that the data
points tend to be very close to the mean
(Average value), while a high variance
indicates that the data points are very
spread out around the mean.
Statistical data analysis
The goal of statistics is to gain understanding from data. Any data
analysis should contain following steps:
Thank You