Downloaded 275 times


![25, 18, 30, 8, 15, 5,10, 35, 40, 45
5, 8, 10, 15, 18, 25, 30, 35, 40, 45
𝑄
1= (
𝑁+1
4
)
th Item
= (
10+1
4
) th Item
= (2. 75) th Item
= 2nd Item + (
3
4
) (3rd – 2nd )
8 +
3
4
(10 − 8 )
8 +
3
4
x 2
= 8+ 1.5
= 9.5
* 𝑄3 =3 (
𝑁+1
4
)
th Item
*=3 x (2.75) th item
*(8.25) th item
*8th item + (
1
4
) [ 9th – 8th ]
*= 35 +
1
4
[ 40 – 35 ]
*=35 + 1.25
*=36.25](https://image.slidesharecdn.com/presentationofstatistics-170219095611/75/coefficient-variation-14-2048.jpg)

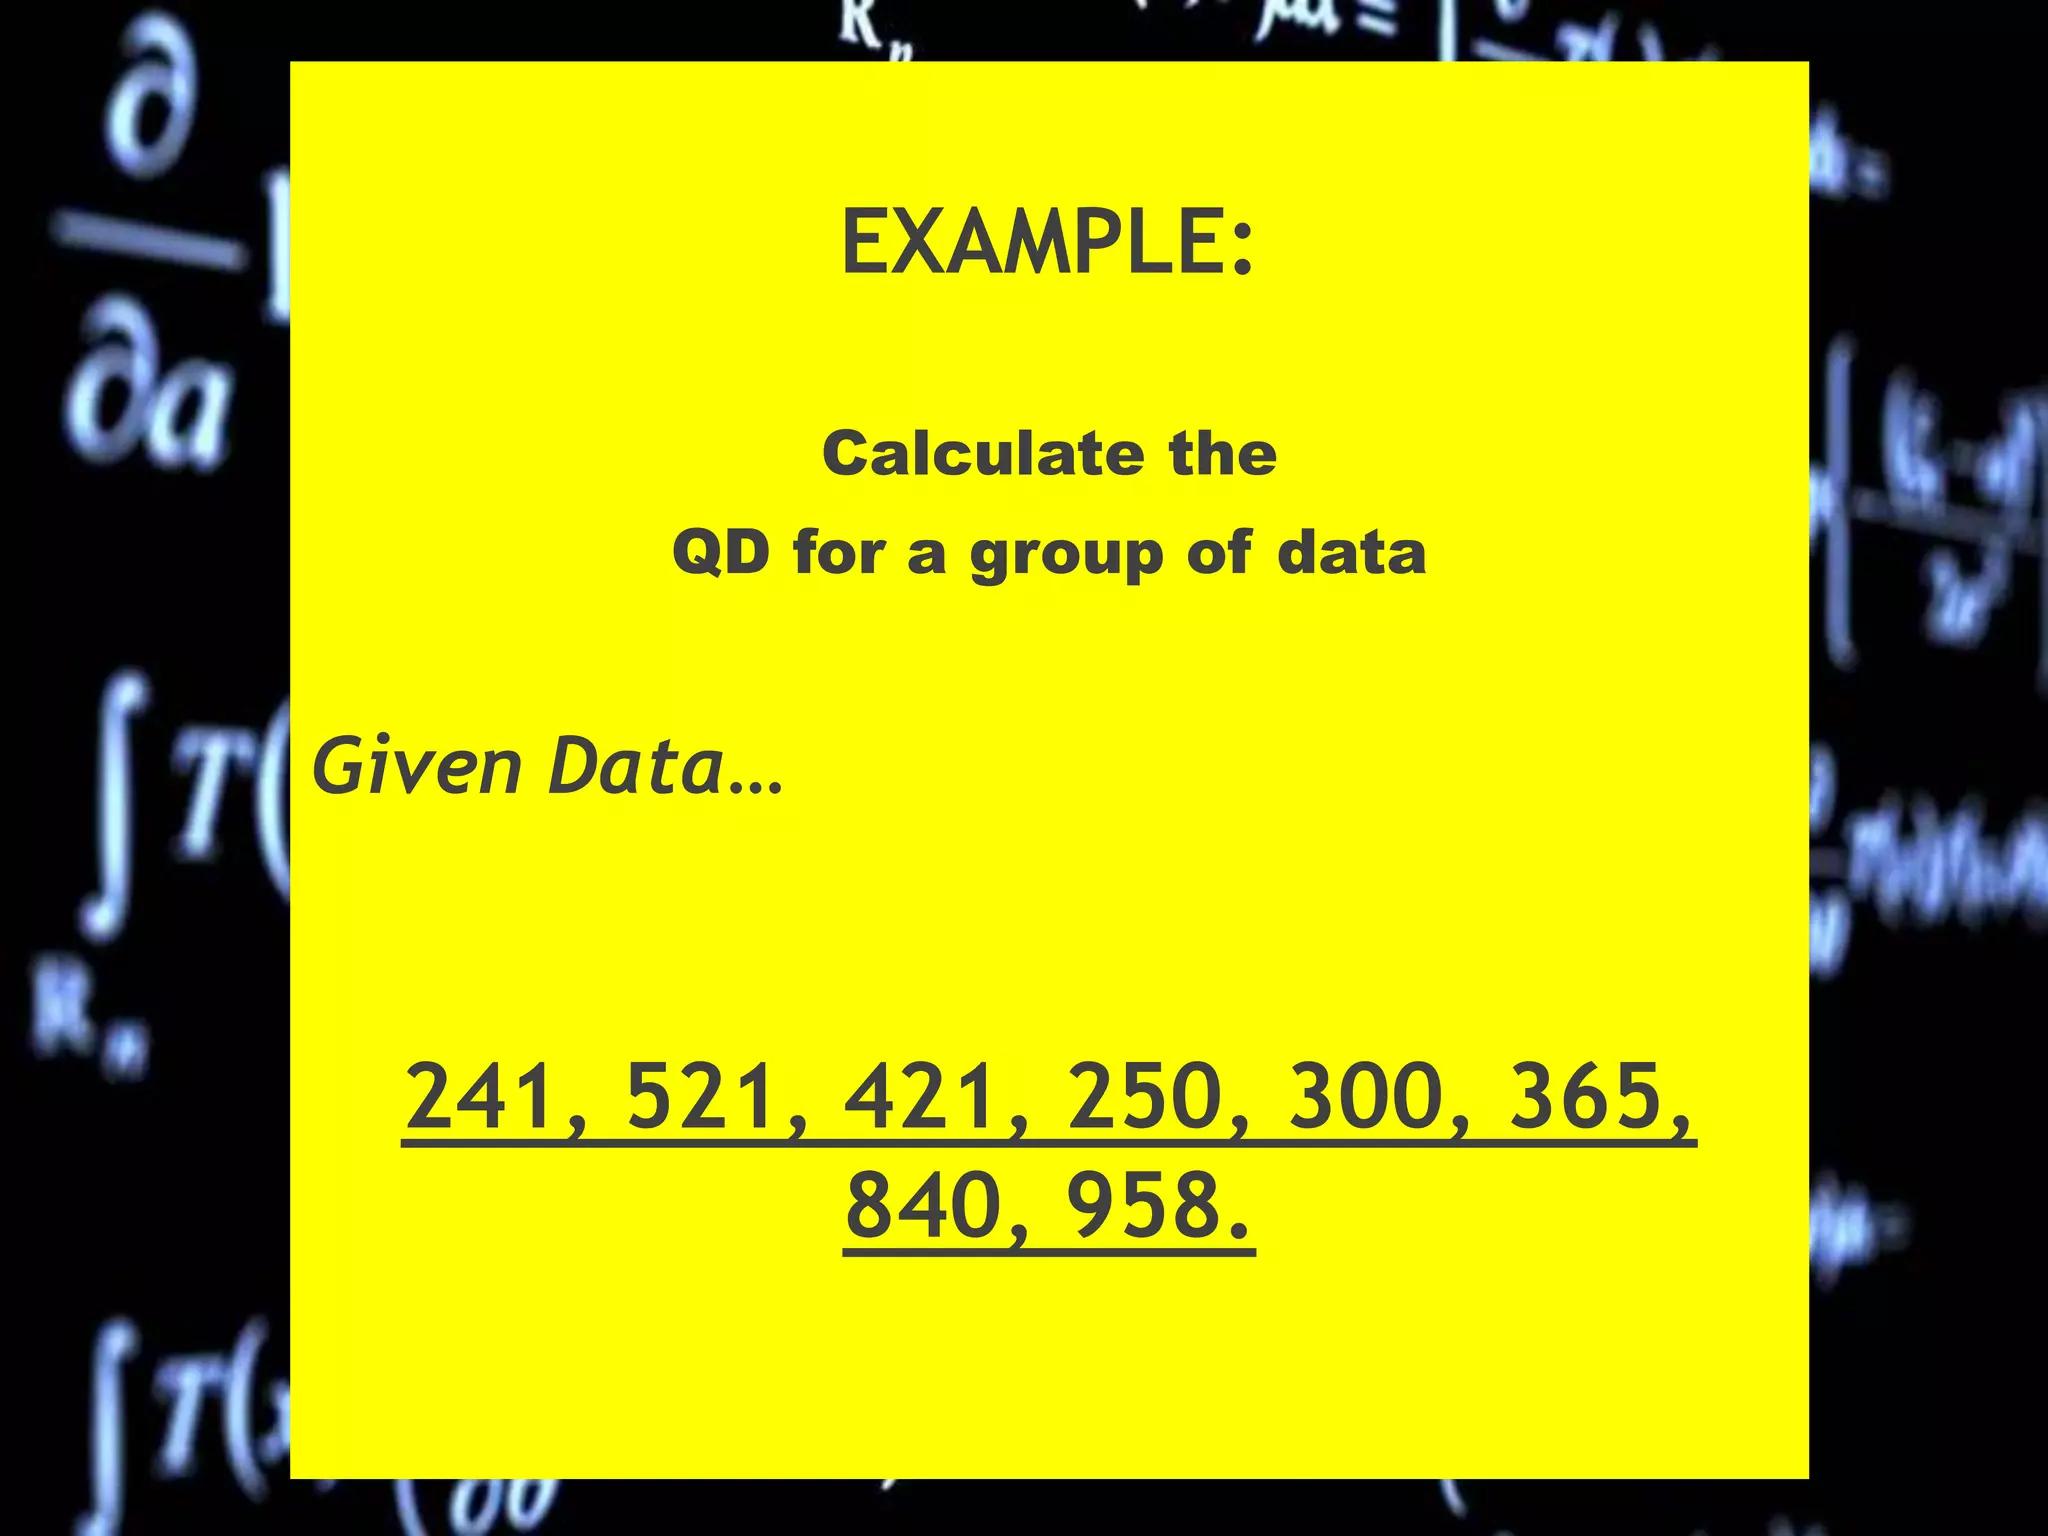
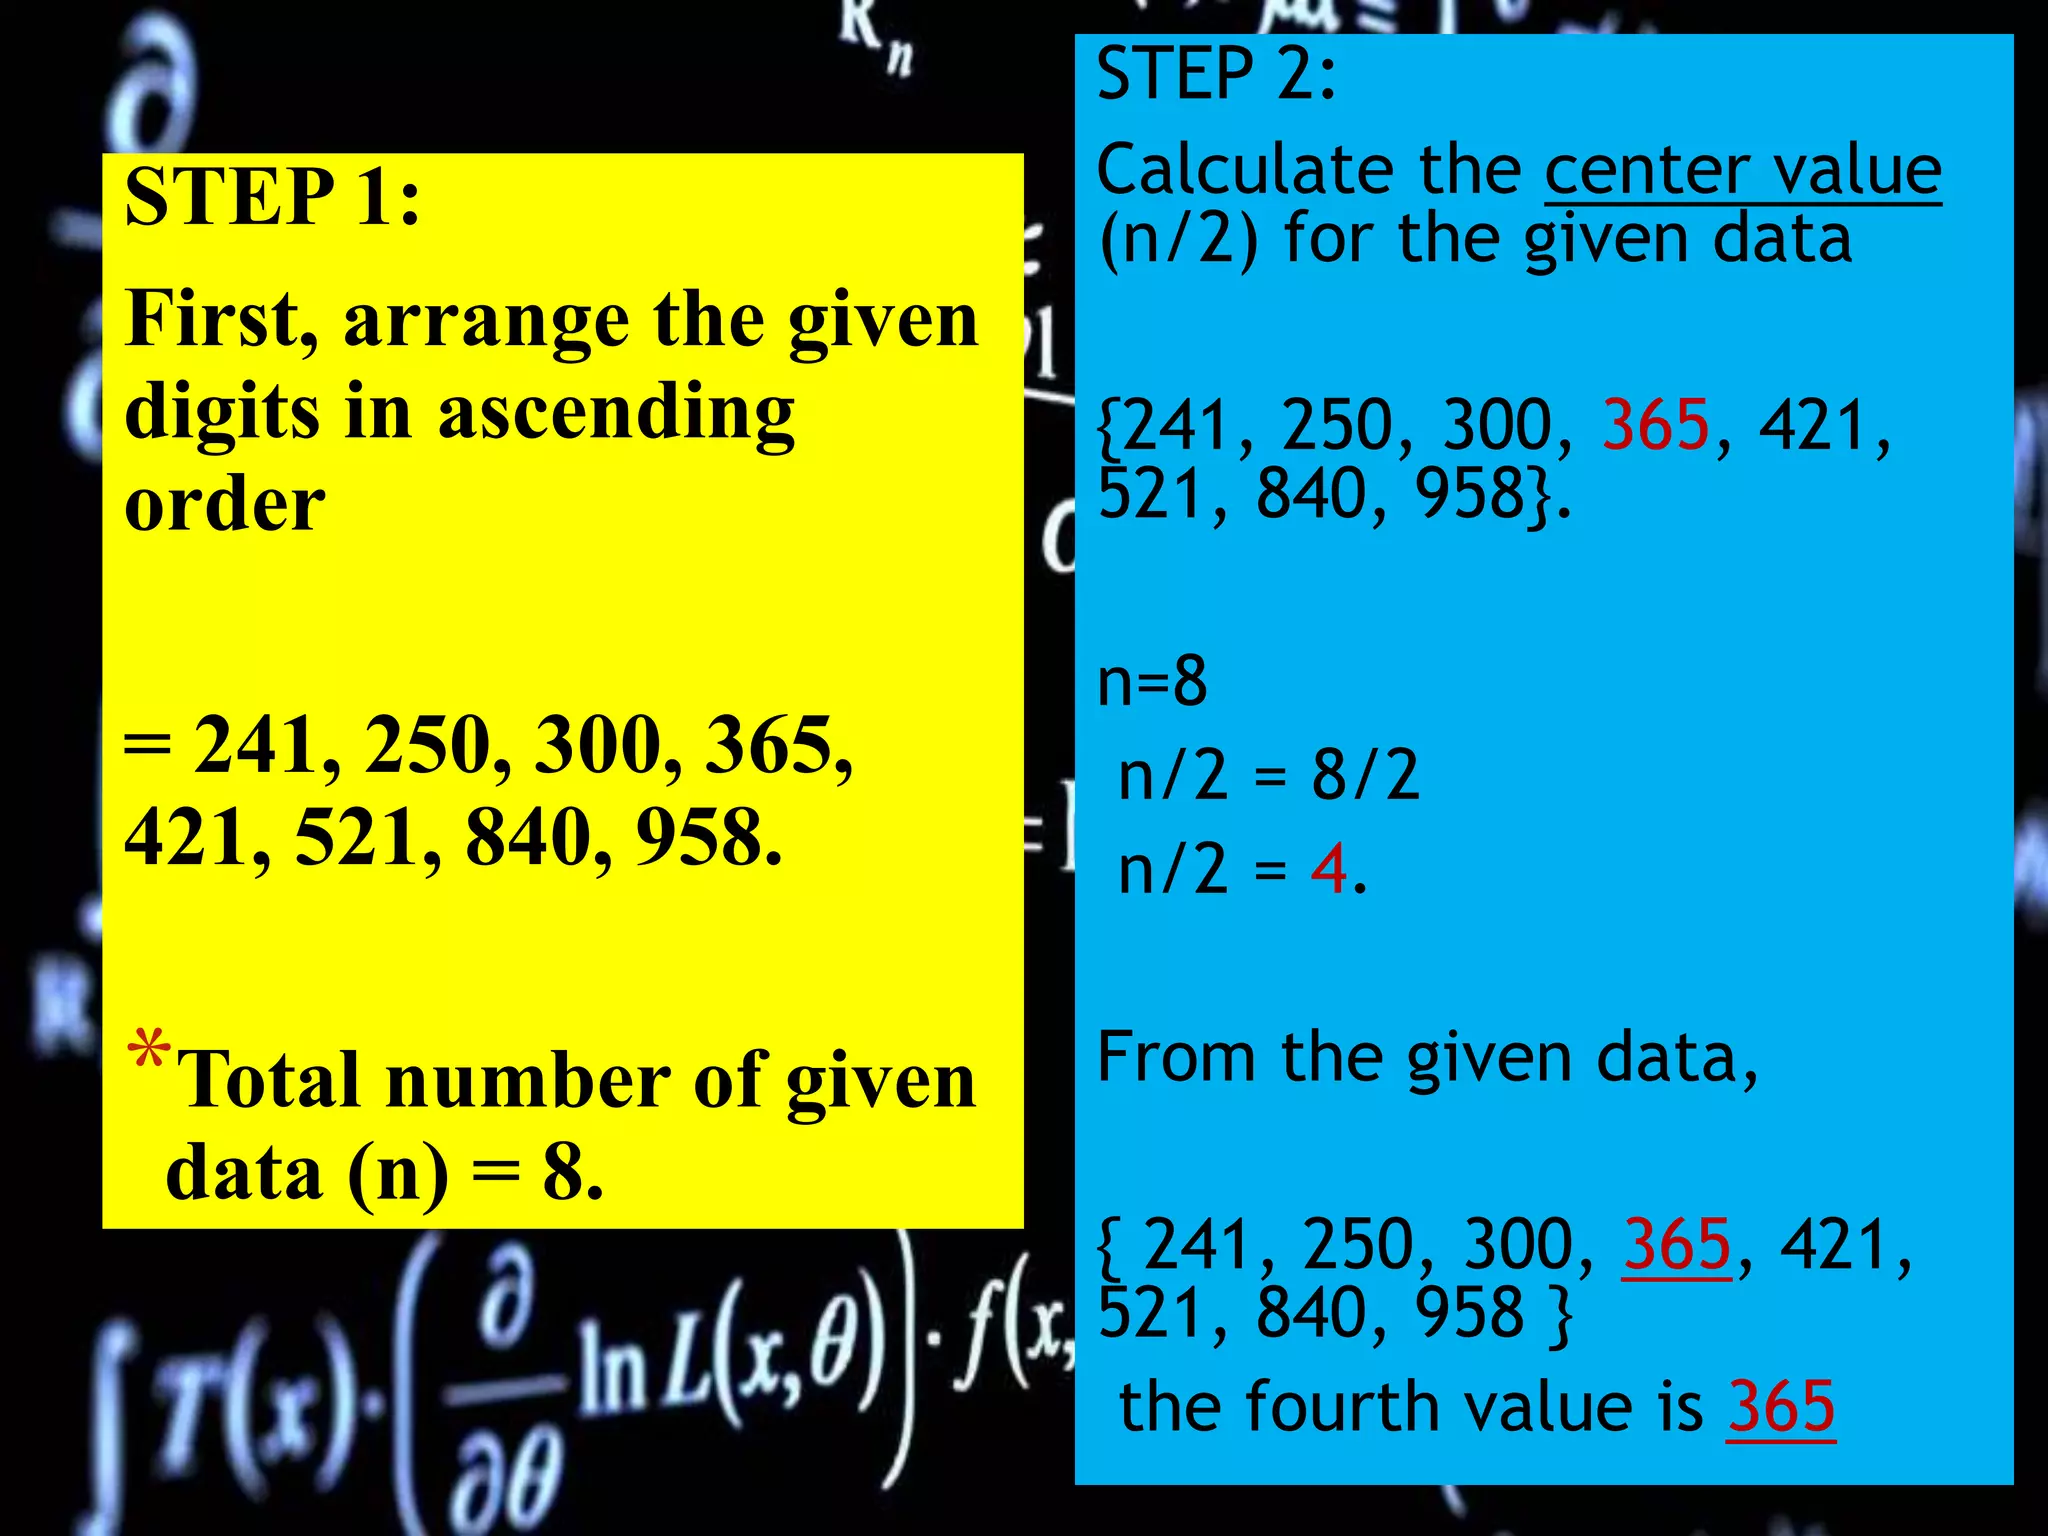
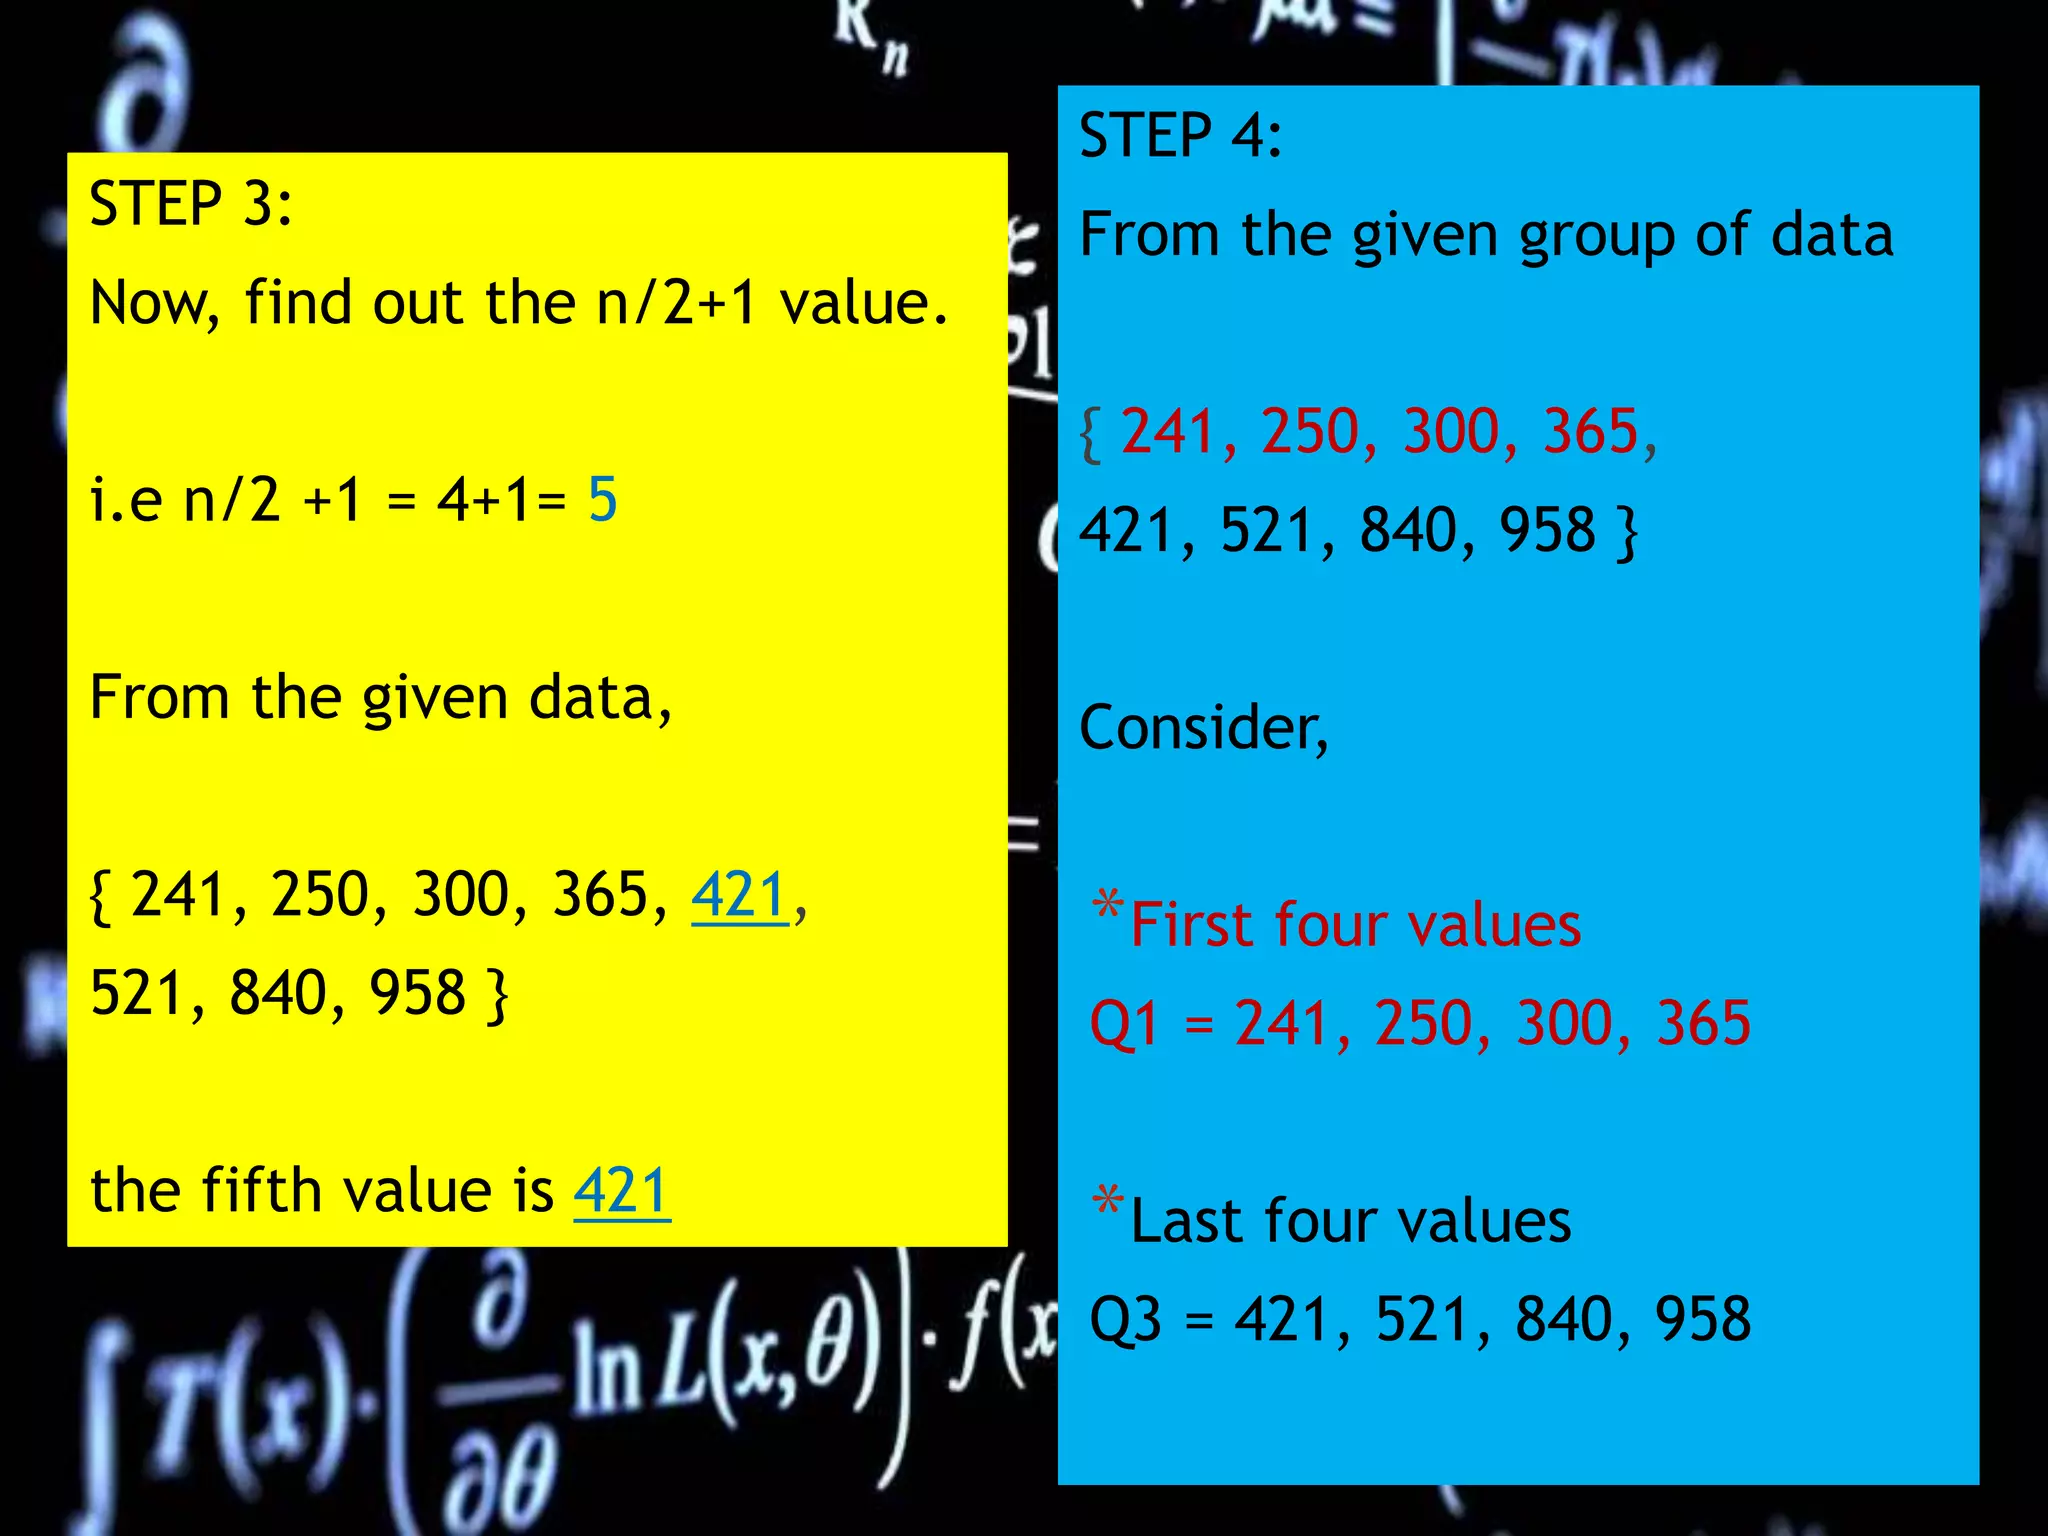
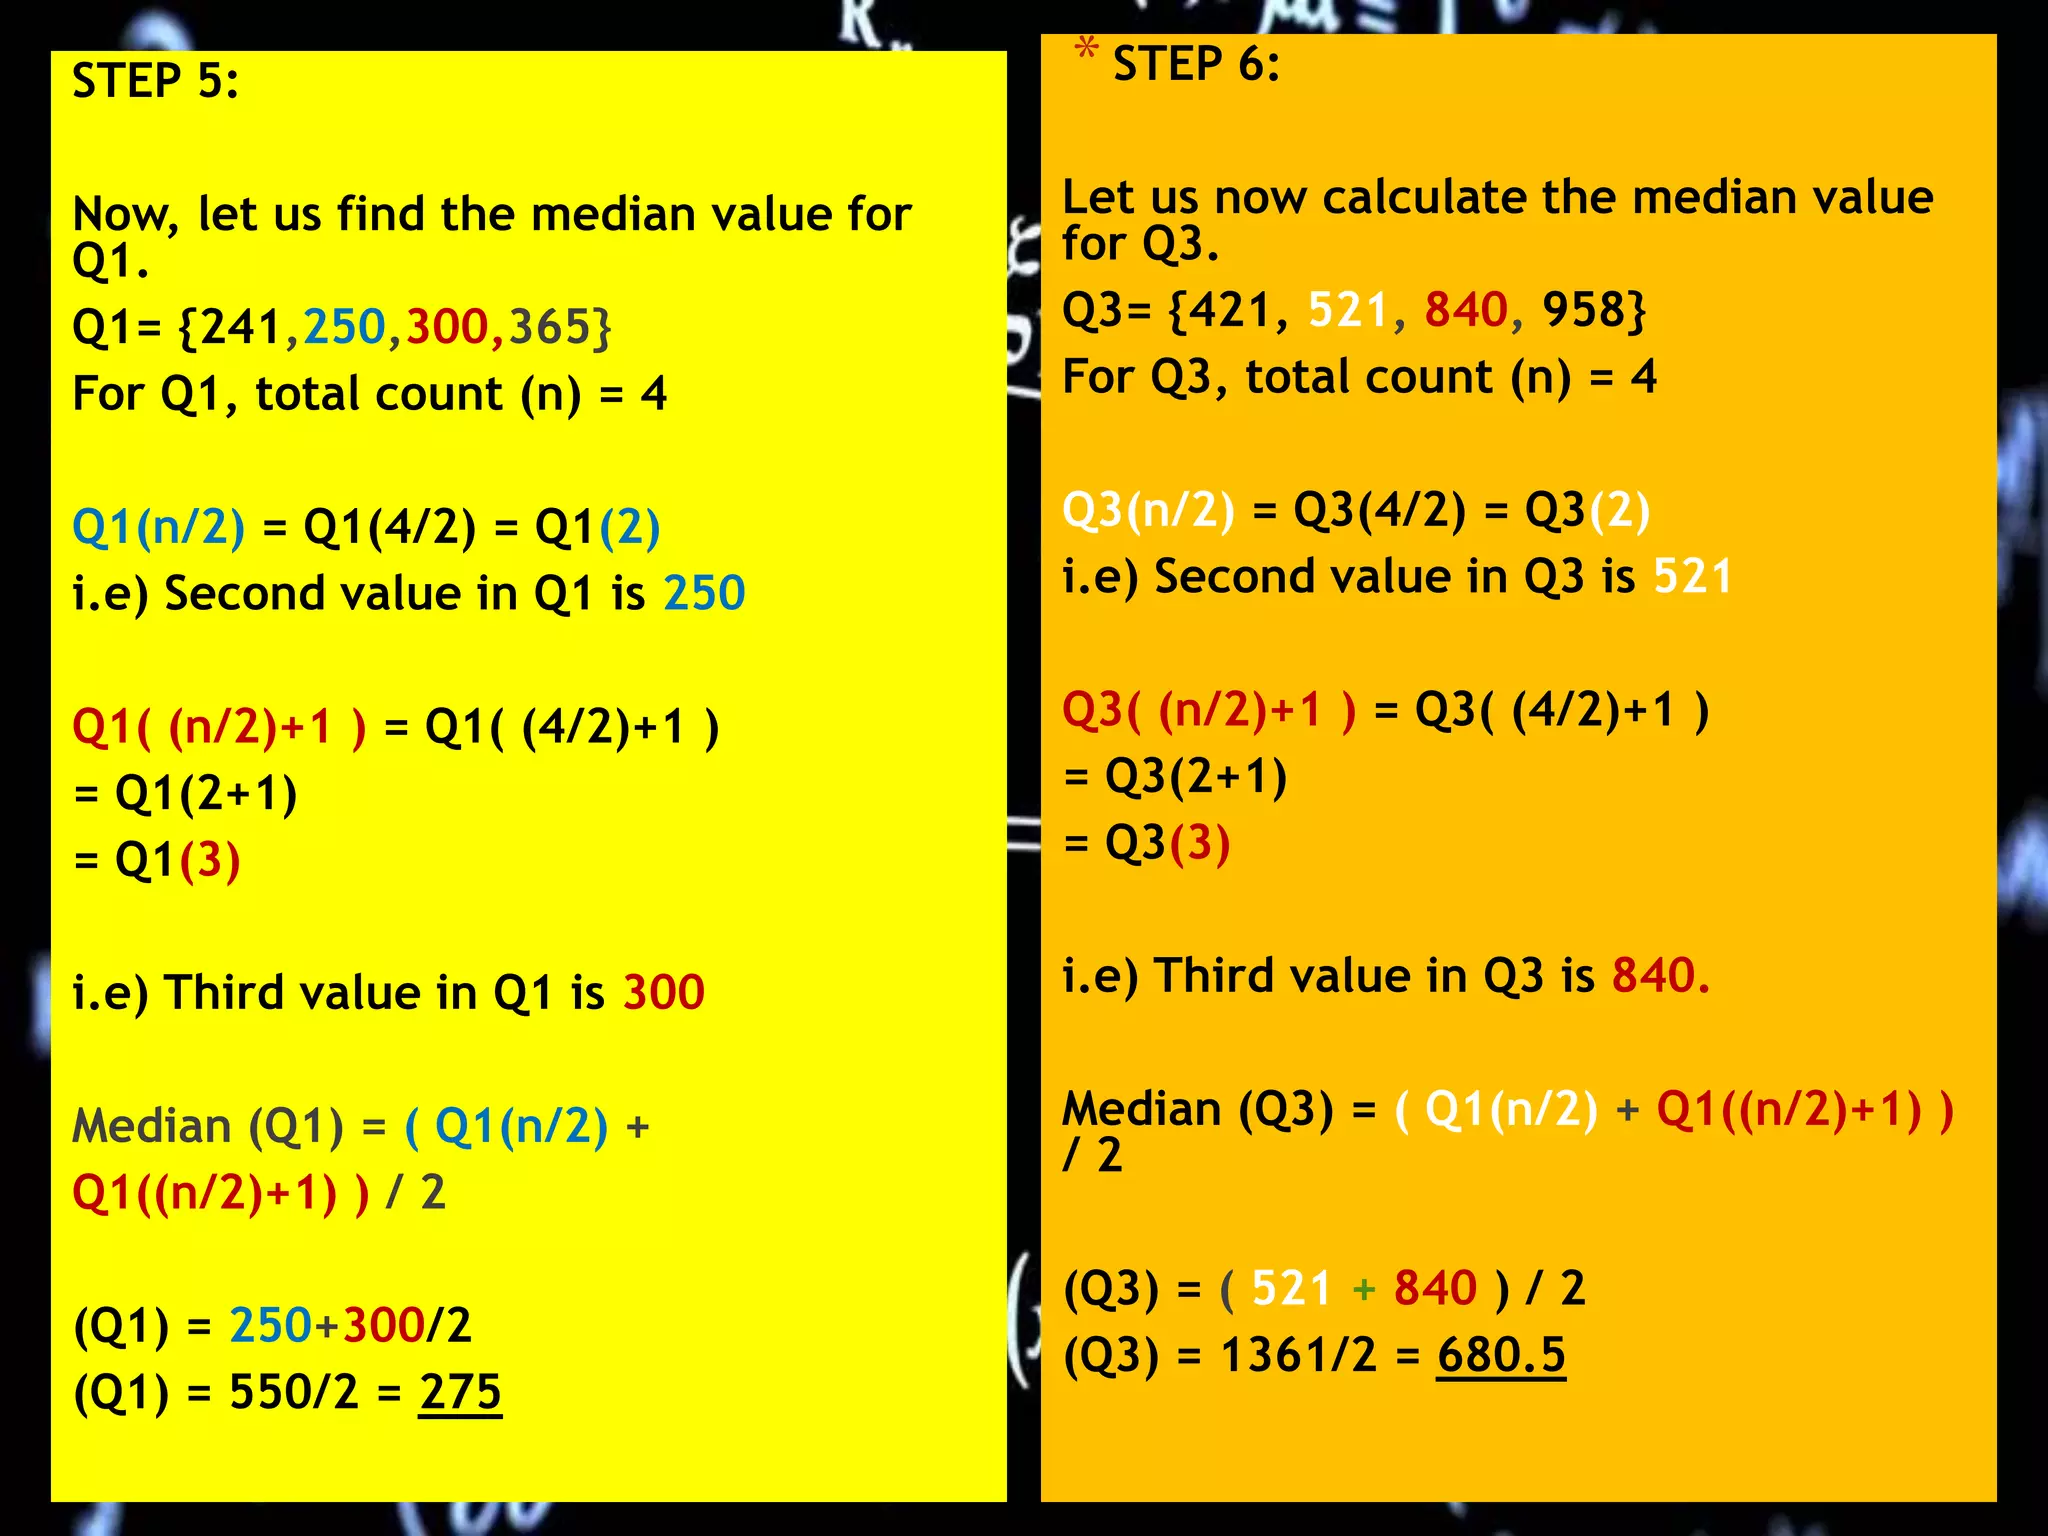


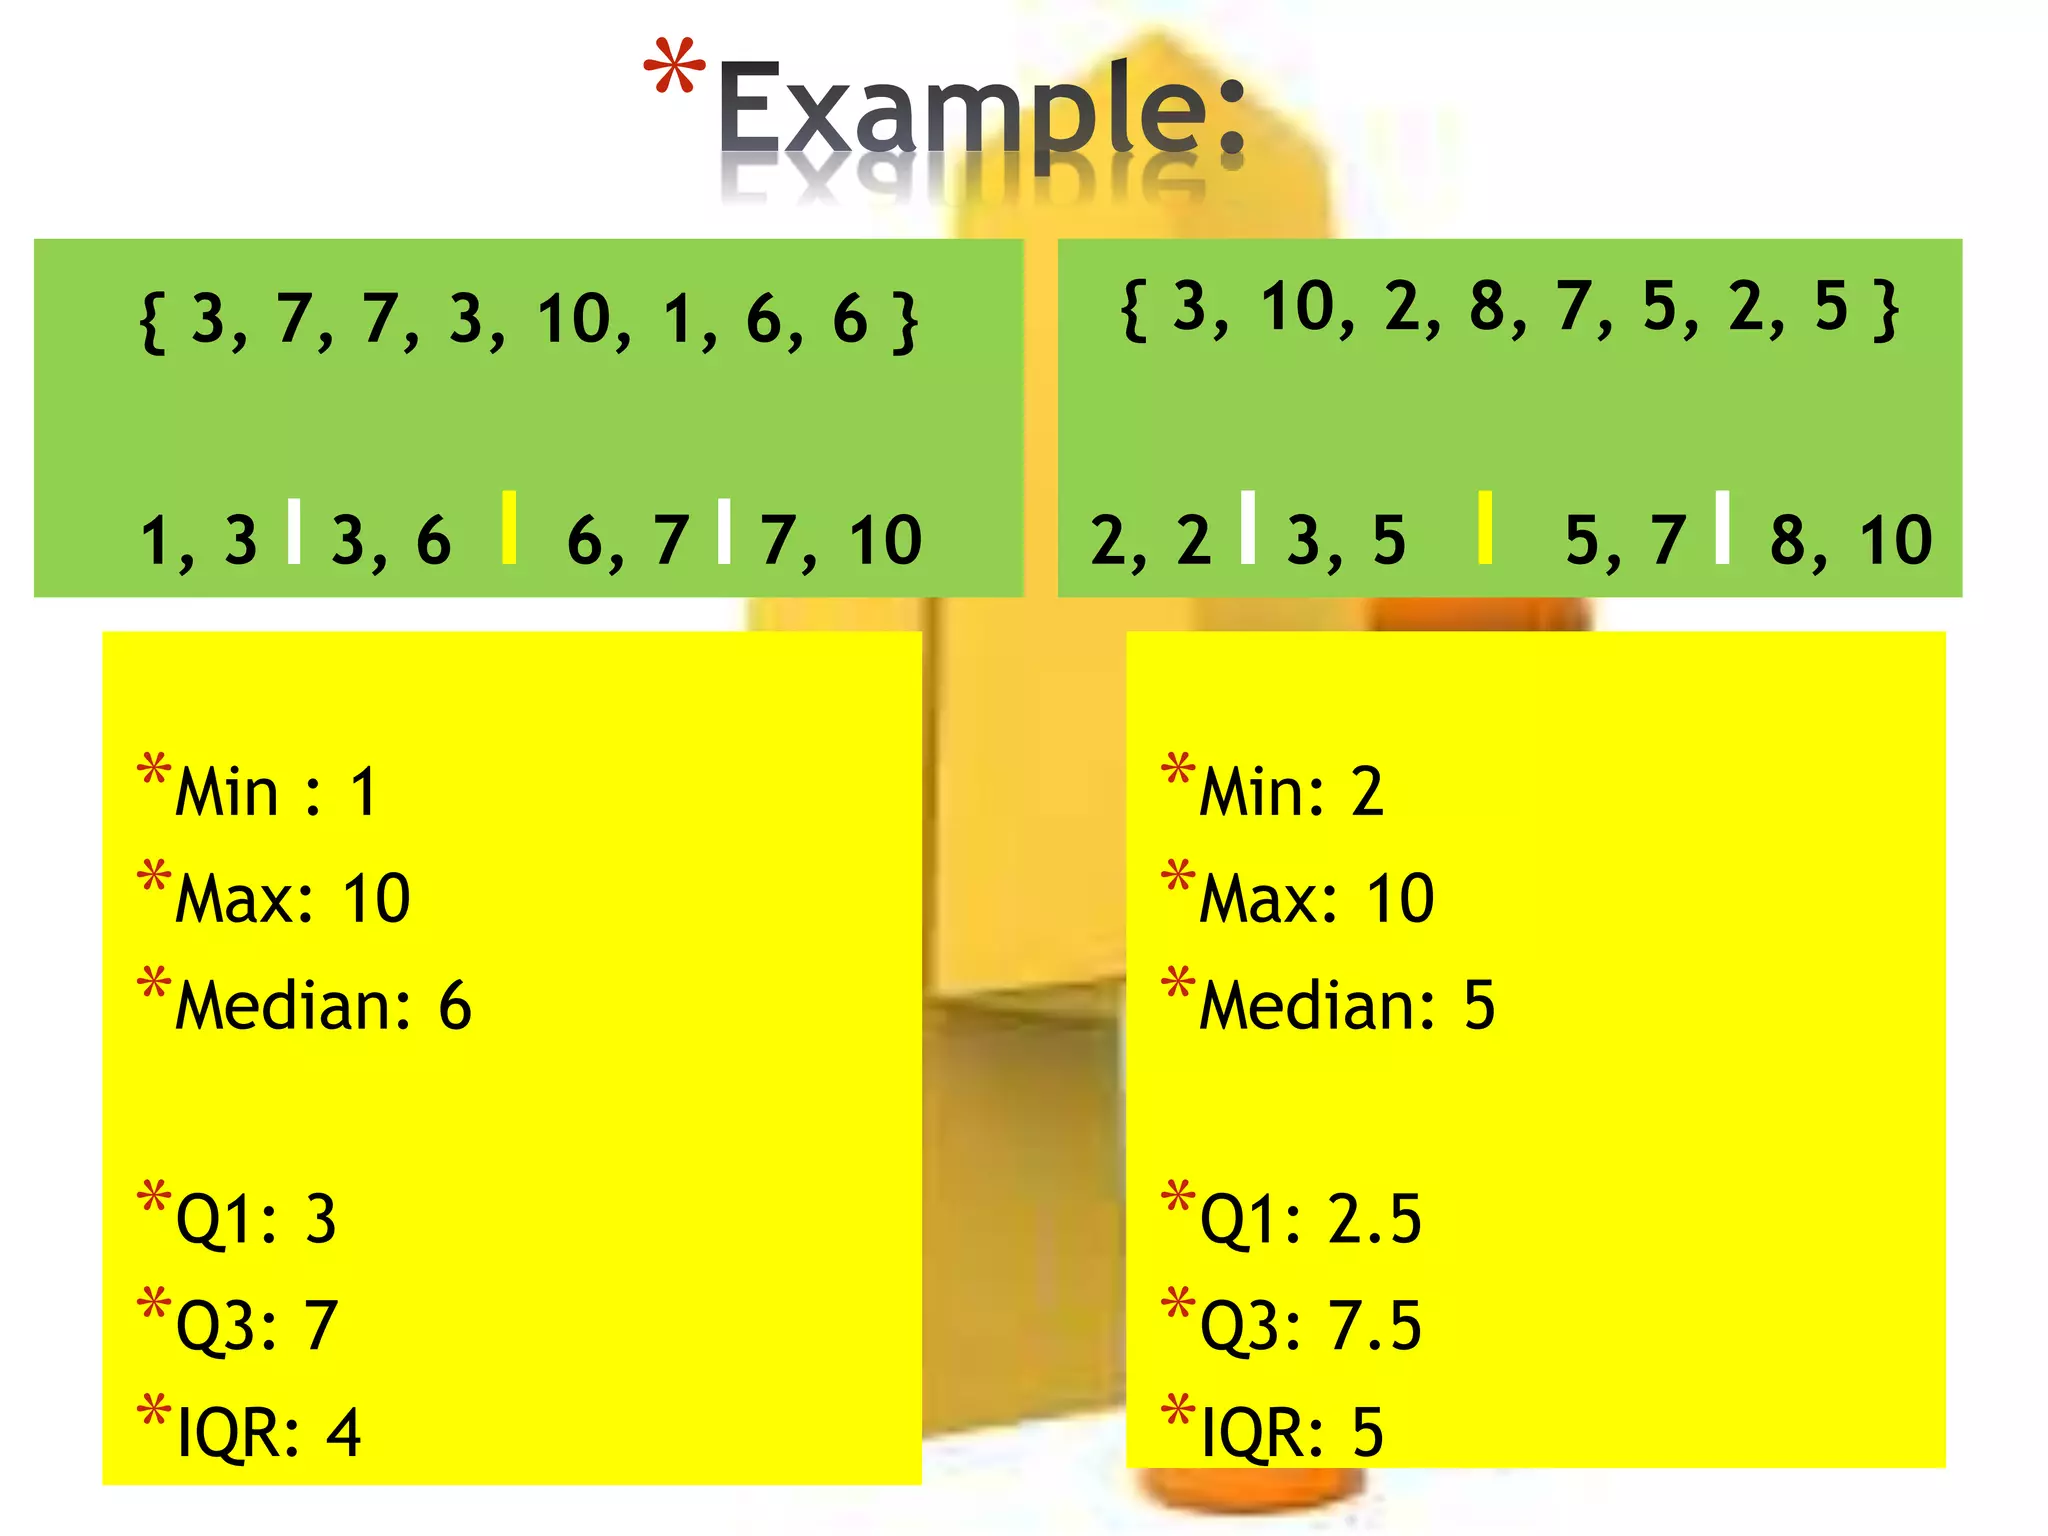


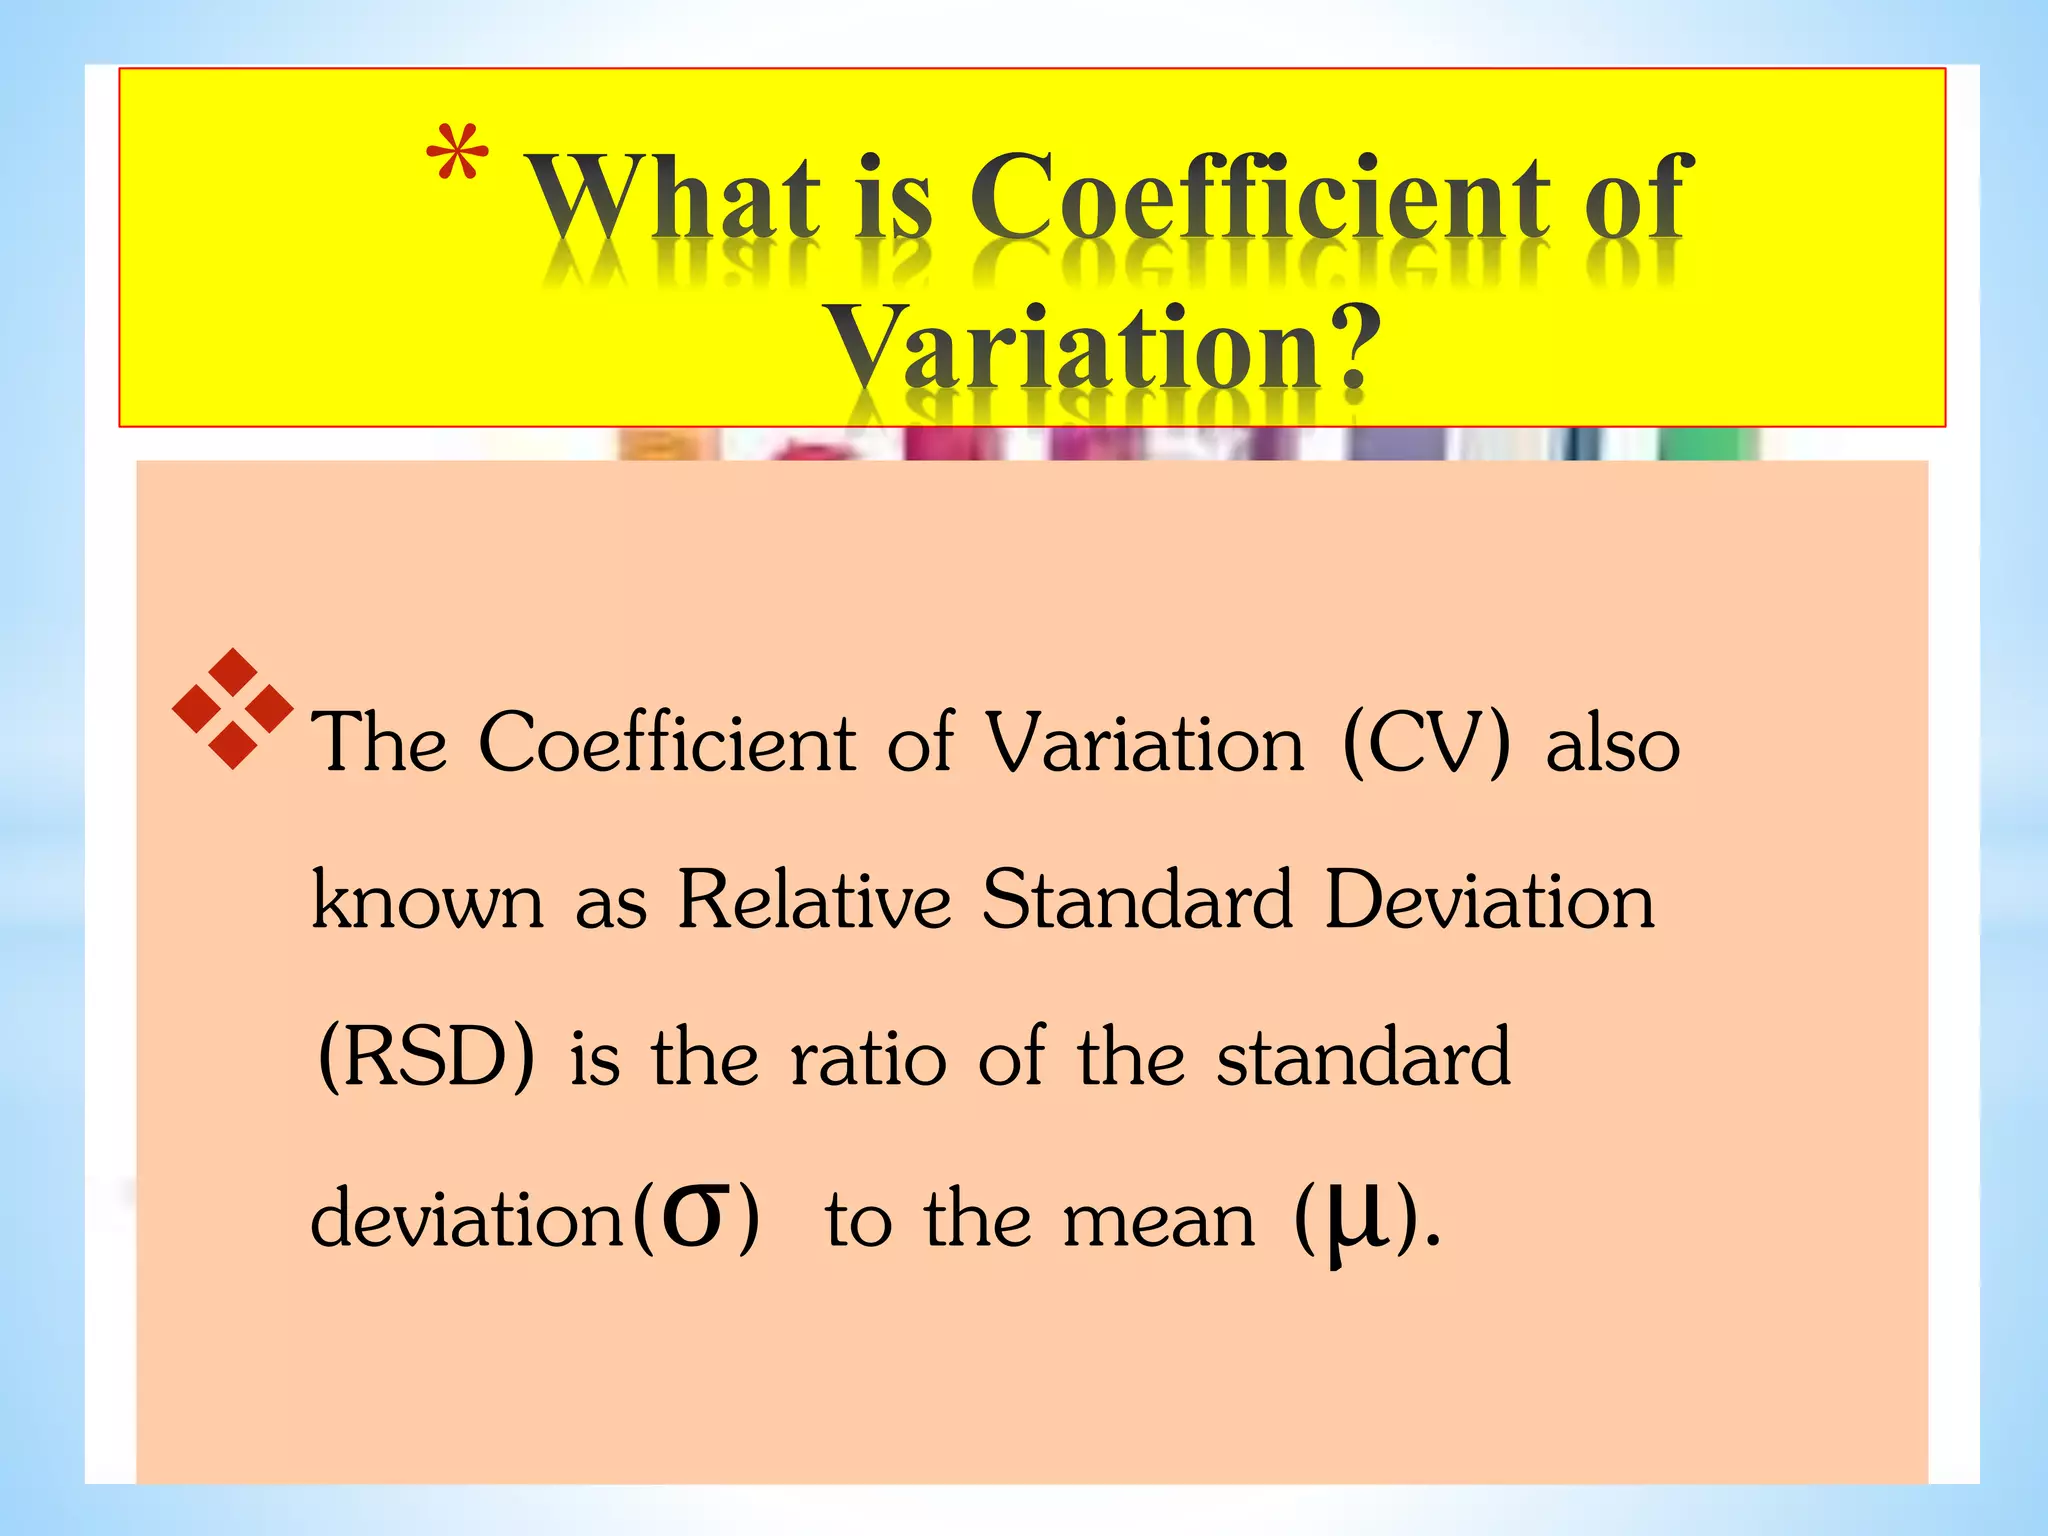
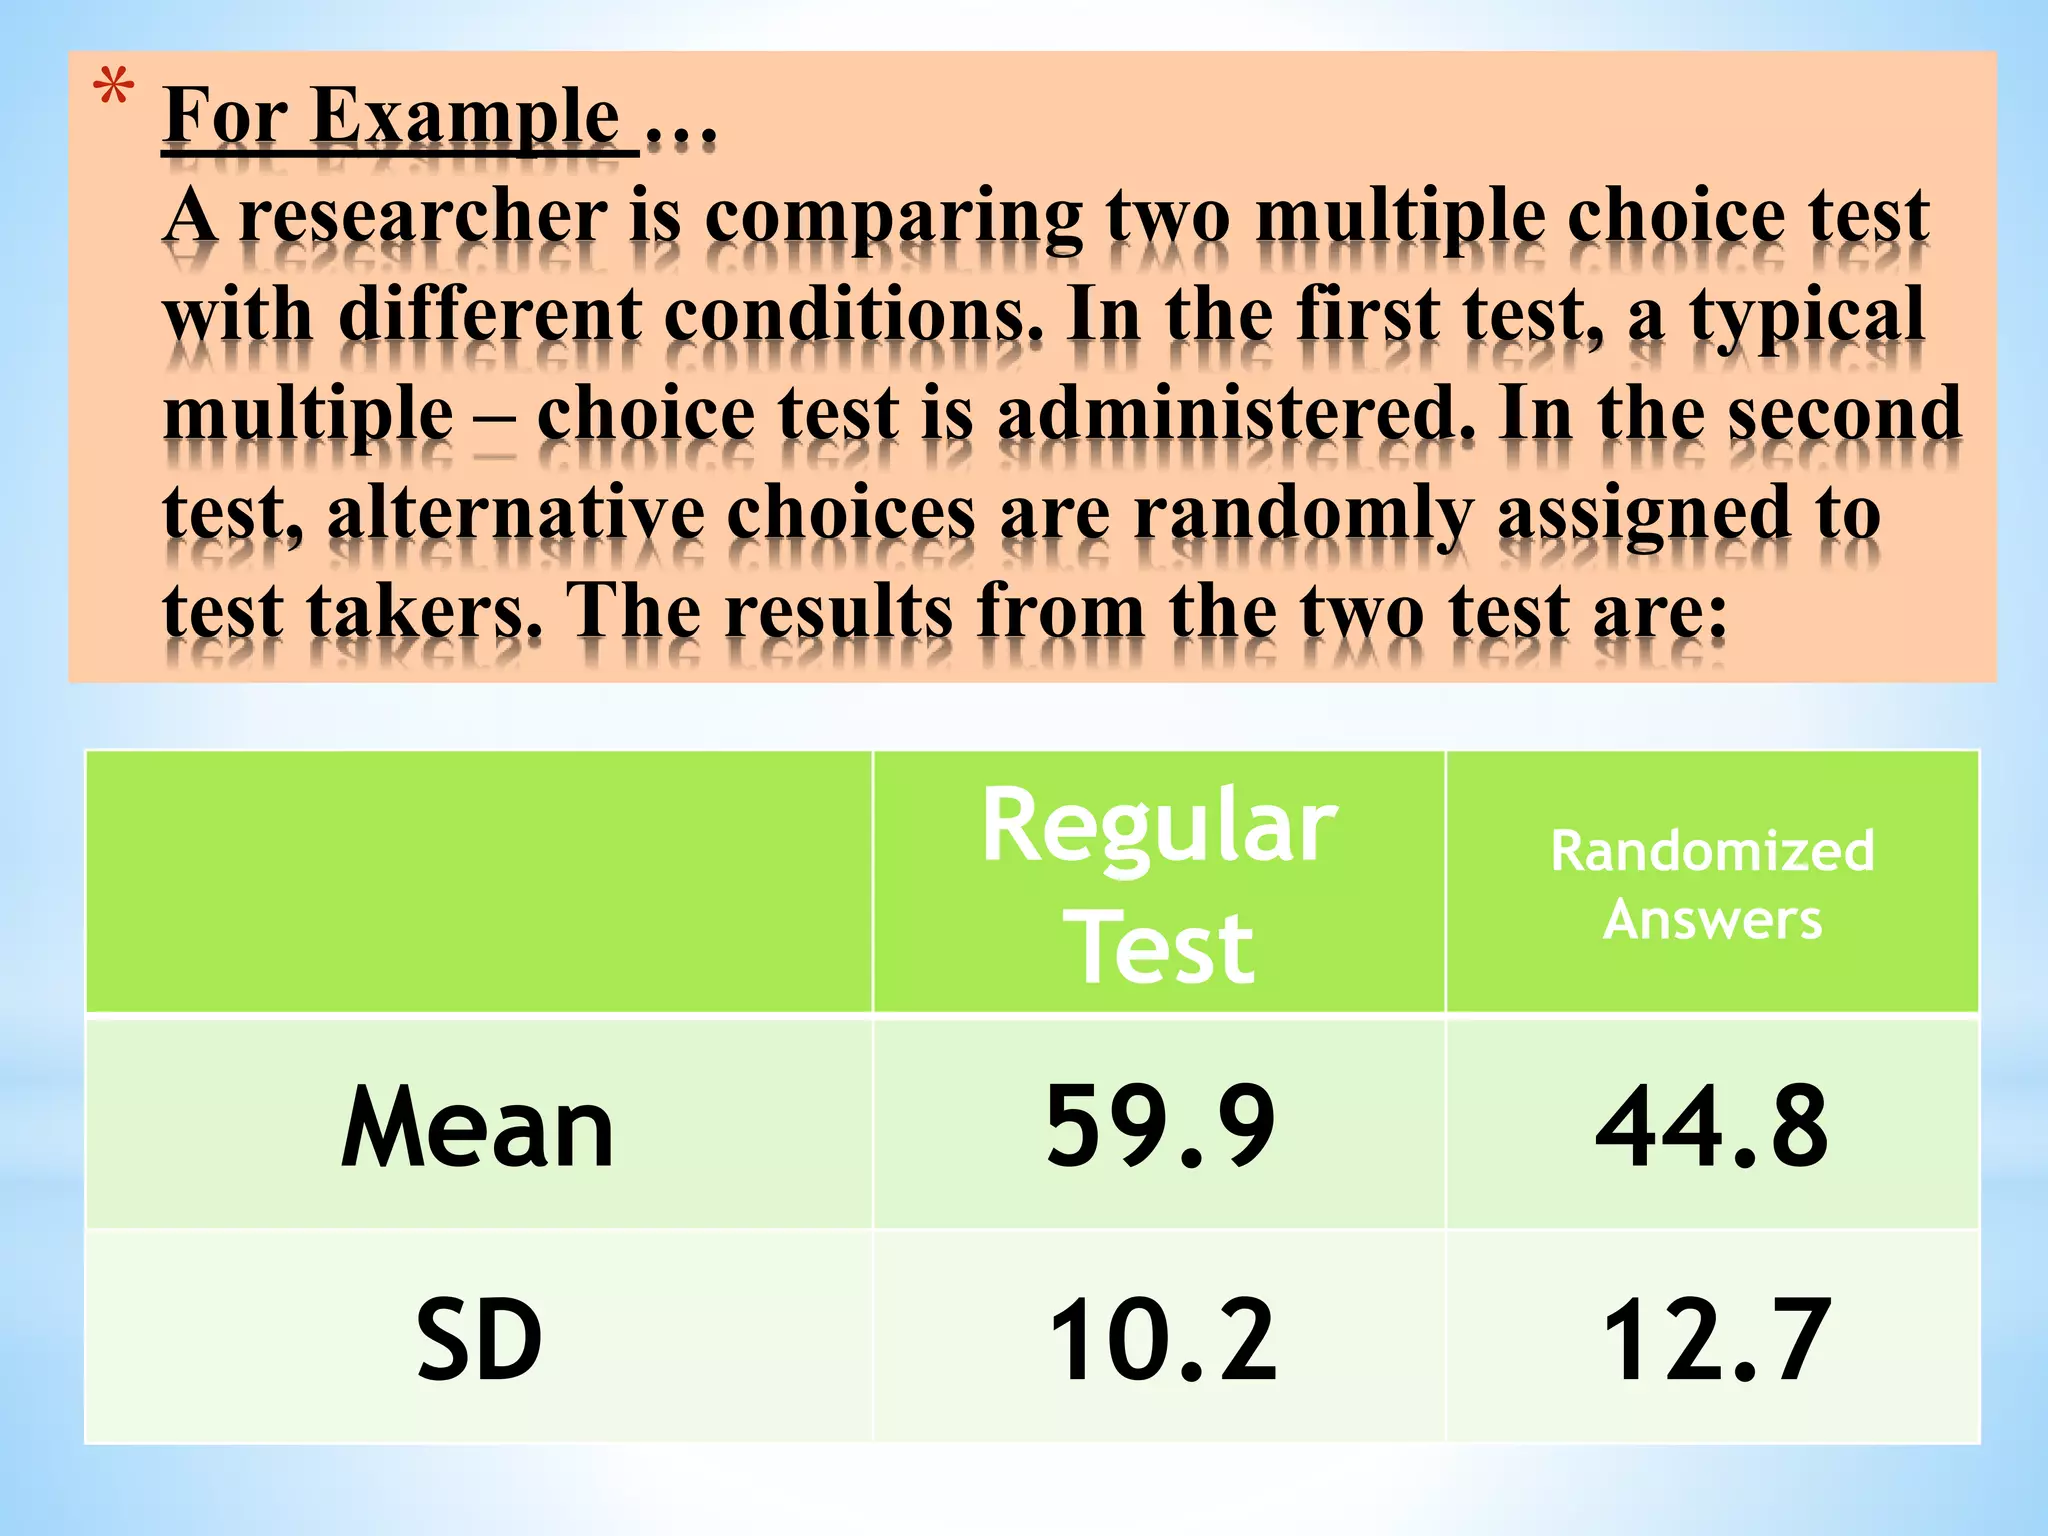
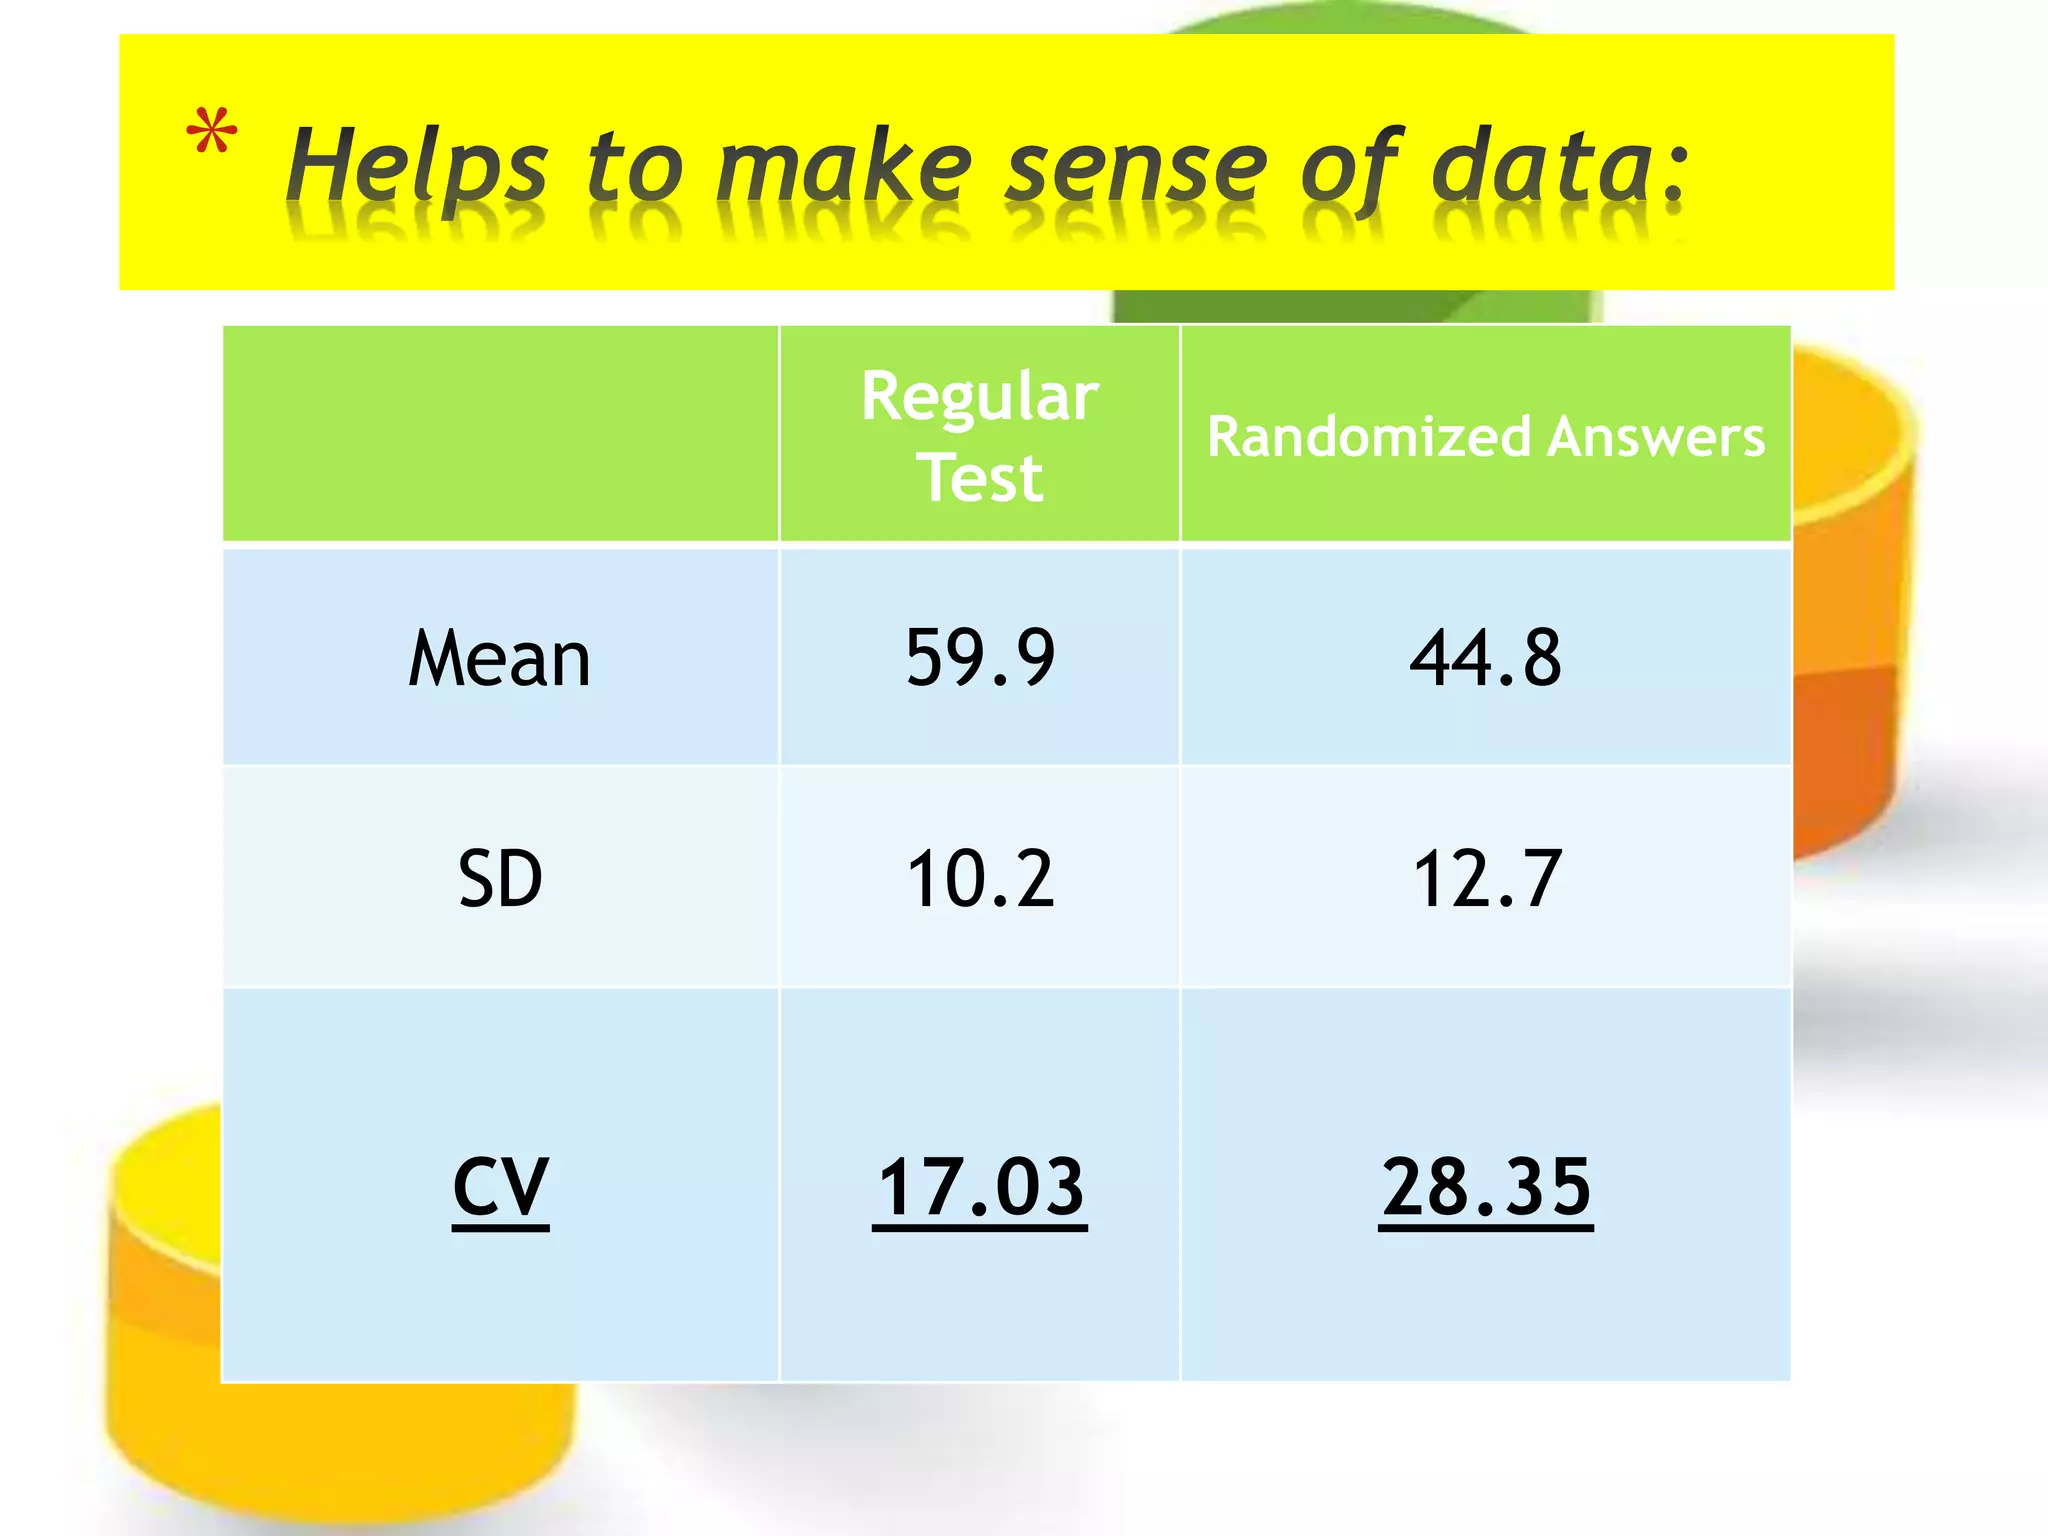
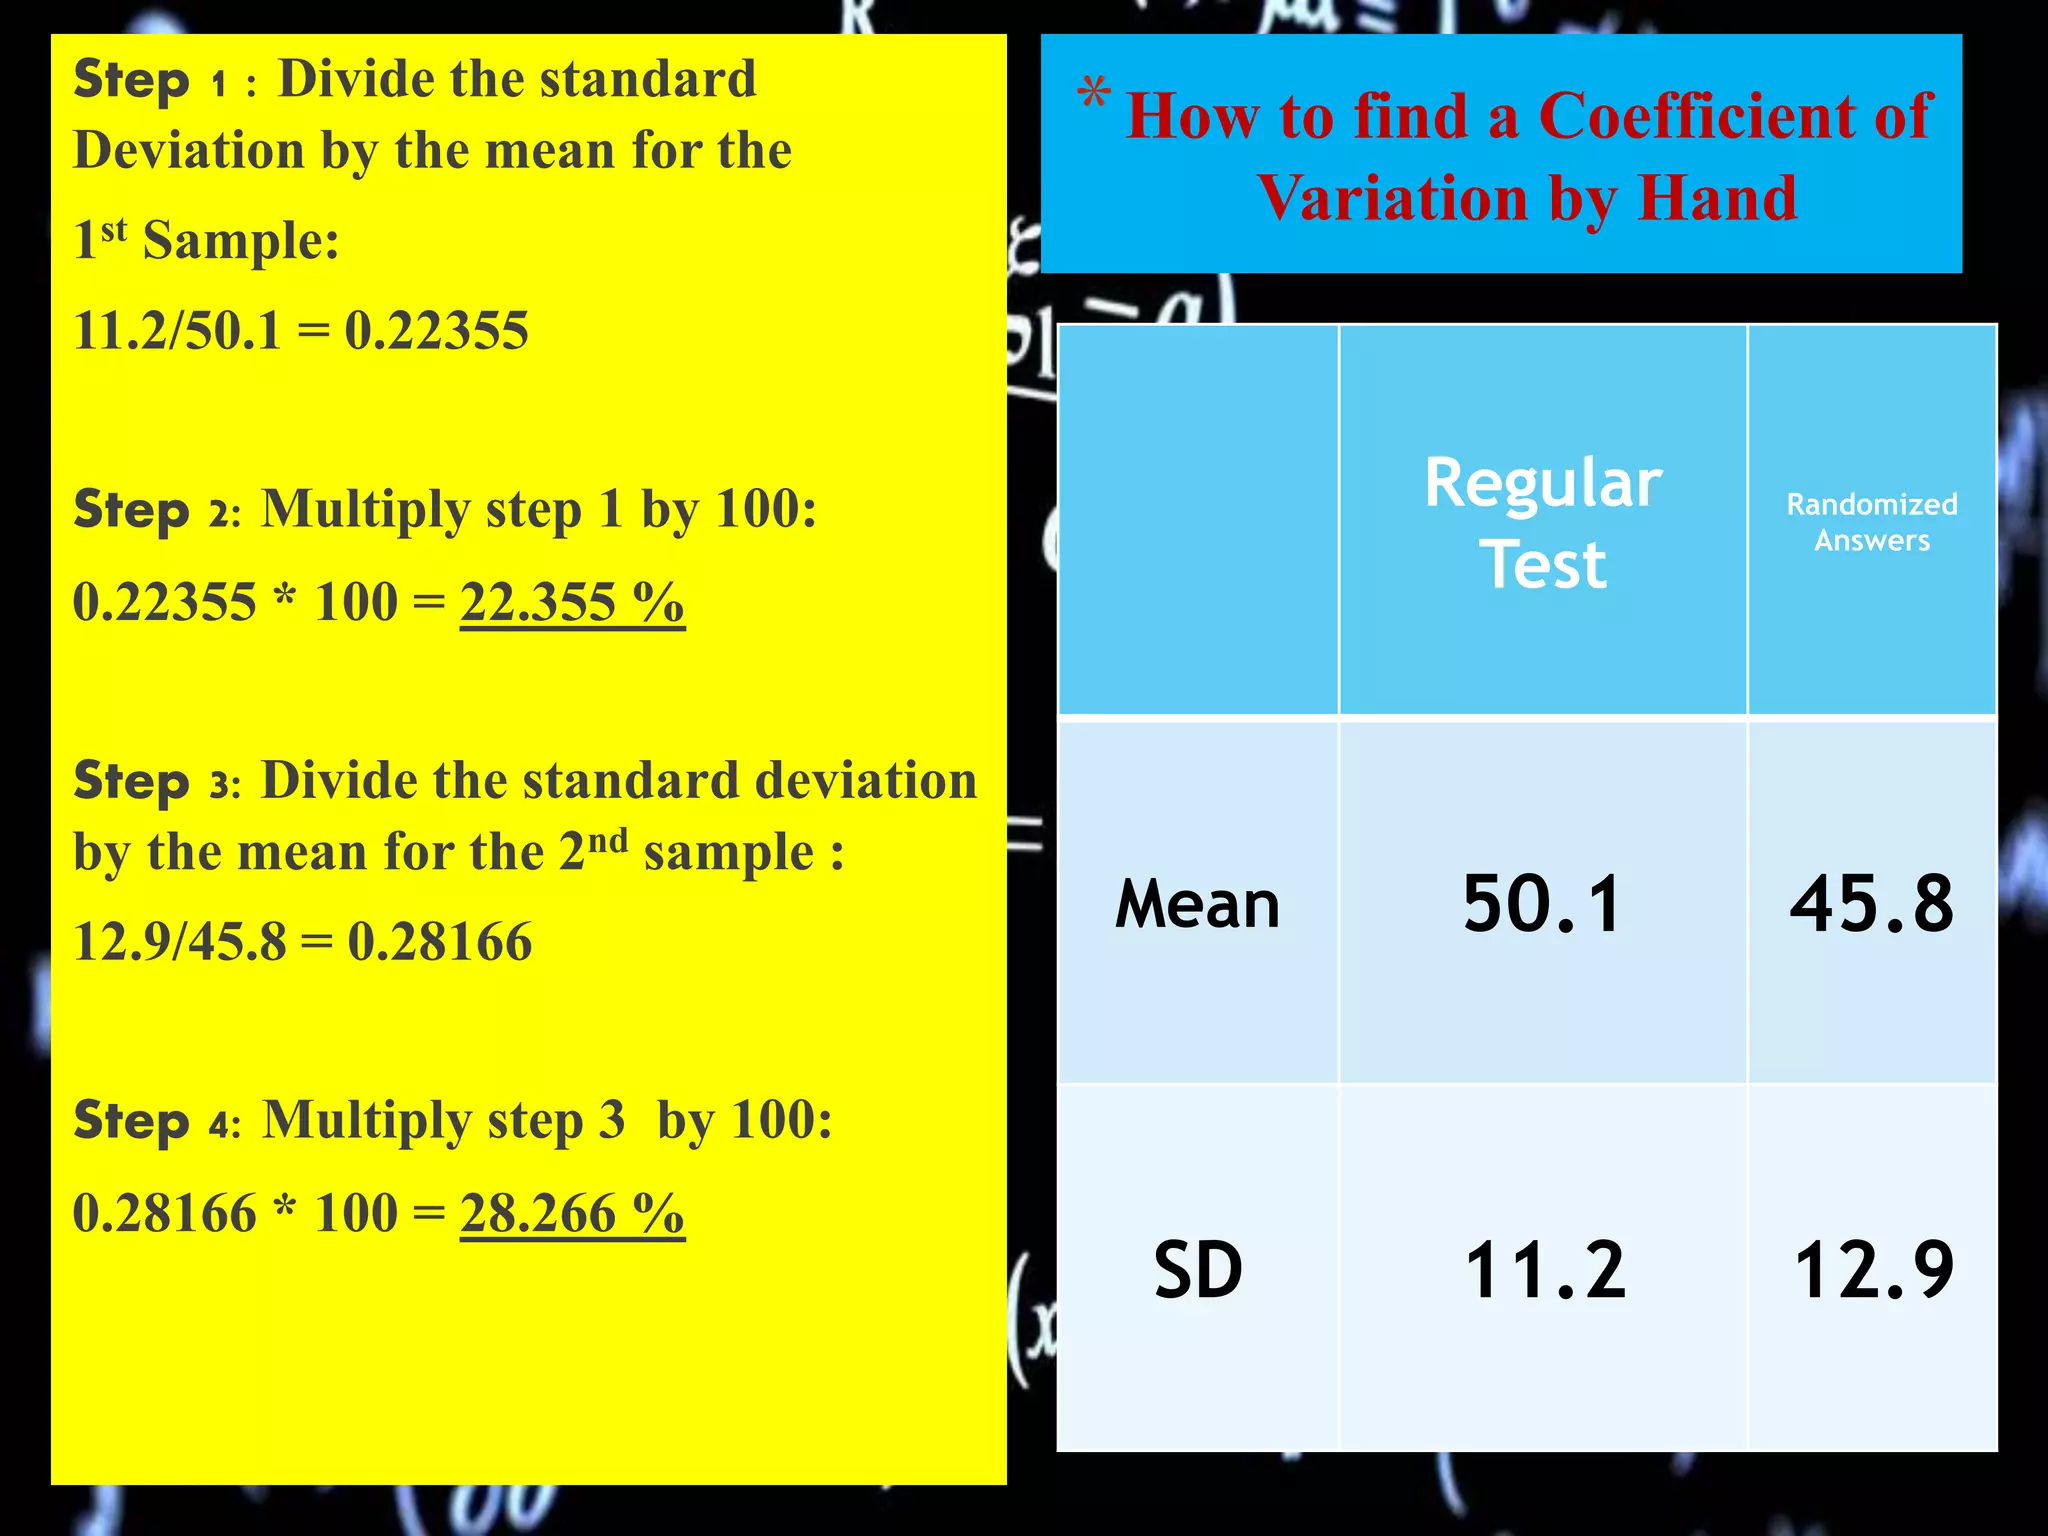
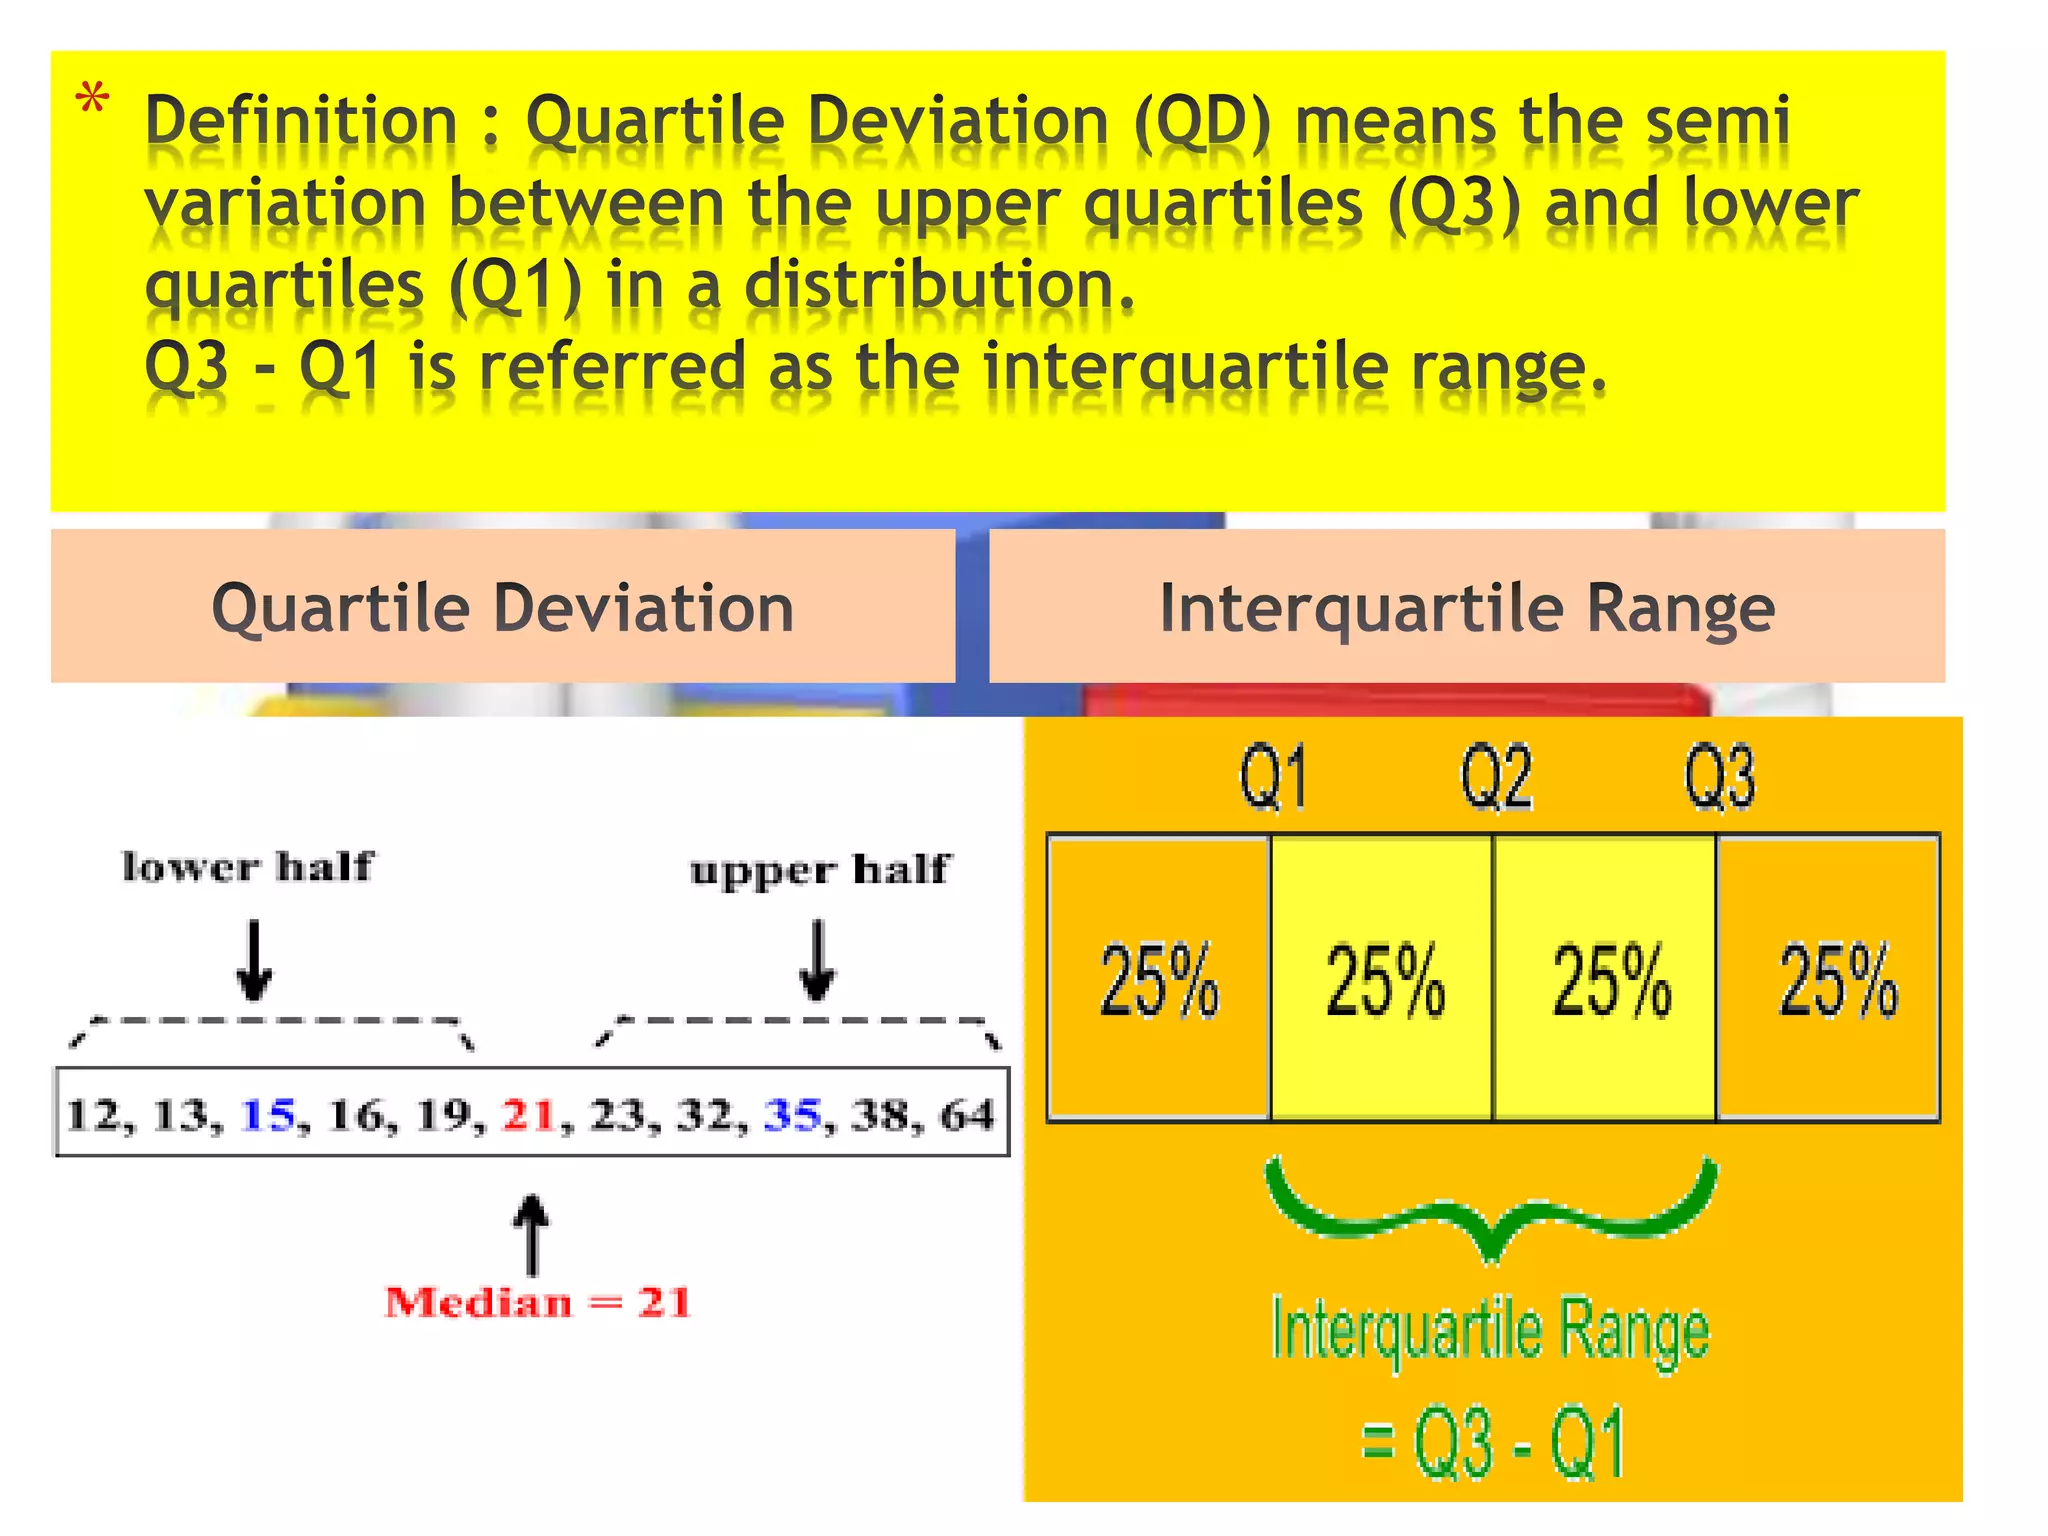
The document discusses coefficient of variation (CV), which is the ratio of the standard deviation to the mean. It provides an example comparing the CV of two multiple choice tests with different conditions. Formulas for calculating CV by hand and in Excel are shown. Methods for finding quartiles in ungrouped and grouped data are explained. The document also demonstrates how to calculate quartile deviation and construct box and whisker plots, and provides references for further information.


![CV_ANALYSIS_Thendral_(1)[1]](https://cdn.slidesharecdn.com/ss_thumbnails/32255aae-c01d-4308-9fd9-74c9f5e47448-160207174516-thumbnail.jpg?width=640&height=640&fit=bounds)