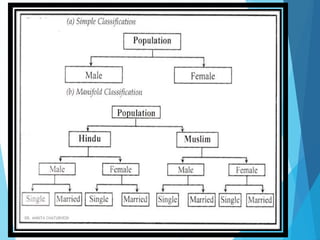
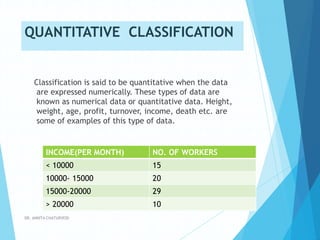
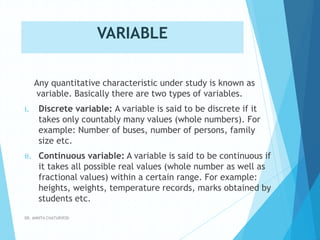
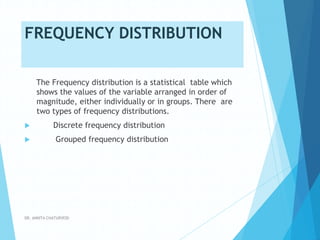
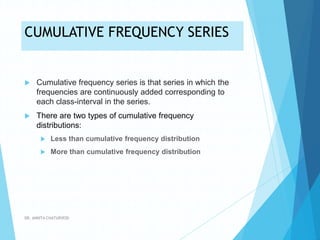
CLASSIFICATION OF DATA
DR. ANKITA CHATURVEDI
INTRODUCTION
After the data have been collected, the next step is to present
the data in some orderly and logical form so that their essential
features may become explicit. The unorganised and shapeless
data can neither be easily competent nor interpreted.
“Classified and arranged facts speak themselves; unarranged,
unorganised they are dead as mutton”.
- Prof. J.R. Hicks
DR. ANKITA CHATURVEDI
CLASSIFICATION OF DATA
 “Classification is a process of arranging things or data in groups or
classes according to their resemblances and affinities and gives
expression to the unity of attributes that may subsist amongst a
diversity of individuals.”
 “Classification is the grouping of related facts into classes.”
 The Process of classification data are classified into various
homogenous groups or classes on the basis of similarities and
resemblances.
 Classification condenses the data by dropping out unnecessary
details. It facilitates comparison between different sets of data
clearly showing the different points of agreement and
disagreement. It enables us to study the relationship between
several characteristics and make further statistical treatment like
tabulation, etc.
DR. ANKITA CHATURVEDI
DEFINITIONS
“Classification is the process of arranging things in groups
according to their resemblances and affinities.”
-Connor
“Classification is the process of arranging data into
sequences and groups according to their common
characteristics or separating them into different but
related parts.”
- Secrist
“The process of grouping large number of individual facts
and observations on the basis of similarity among the
items is called classification.”
- Stockton & Clark
DR. ANKITA CHATURVEDI
CHARACTERICTICS OF CLASSIFICATION
 Classification performs homogeneous grouping of
data
 It brings out points of similarity and
dissimilarities.
 The classification may be either real or imaginary
 Classification is flexible to accommodate
adjustments
DR. ANKITA CHATURVEDI
OBJECTIVES OF CLASSIFICATION
 To condense the mass of data in such a way that their
similarities and dissimilarities become very clear.
 To facilitate comparisons i.e. , to make the data
comparable.
 To point out the most important features of the data
at a glance.
 To present the data in a brief form.
 To enable statistical treatment of the data collected .
 To make data attractive and effective.
DR. ANKITA CHATURVEDI
METHODS OF CLASSIFICATION
 GEOGRAPHICAL CLASSIFICATION
 CHRONOLOGICAL CLASSIFICATION
 QUALITATIVE CLASSIFICATION
 QUANTITATIVE CLASSIFICATION
DR. ANKITA CHATURVEDI
GEOGRAPHICAL CLASSIFICATION
When the data is classified on the basis of geographical or
locational differences between the various items, it is
known as Geographical Classification. E.g. area wise, zone
wise, state wise, etc.
e.g. NO. OF XYZ BANK BRANCHES IN JAIPUR IN 2018
STATE NO. OF FIRMS
NORTH ZONE 02
EAST ZONE 04
WEST ZONE 05
SOUTH ZONE 03DR. ANKITA CHATURVEDI
CHRONOLOGICAL CLASSIFICATION
When data is classified on the basis of time, it is
known as chronological classification. e.g. Years,
Month, Weeks, Days etc.
e.g. Sales of ABC LTD.
YEAR SALES(IN RS. CRORES)
2014 36.1
2015 43.9
2016 54.8
2017 68.4
2018 84.4DR. ANKITA CHATURVEDI
QUALITATIVE CLASSIFICATION
In this type of classification, data are classified on
the basis of some attribute or quality such as sex,
literacy, religion, employment, etc.
This classification may be two types.
i) Simple classification
ii) Manifold classification
DR. ANKITA CHATURVEDI
QUANTITATIVE CLASSIFICATION
Classification is said to be quantitative when the data
are expressed numerically. These types of data are
known as numerical data or quantitative data. Height,
weight, age, profit, turnover, income, death etc. are
some of examples of this type of data.
INCOME(PER MONTH) NO. OF WORKERS
< 10000 15
10000- 15000 20
15000-20000 29
> 20000 10
DR. ANKITA CHATURVEDI
VARIABLE
Any quantitative characteristic under study is known as
variable. Basically there are two types of variables.
i. Discrete variable: A variable is said to be discrete if it
takes only countably many values (whole numbers). For
example: Number of buses, number of persons, family
size etc.
ii. Continuous variable: A variable is said to be continuous if
it takes all possible real values (whole number as well as
fractional values) within a certain range. For example:
heights, weights, temperature records, marks obtained by
students etc.
DR. ANKITA CHATURVEDI
FREQUENCY DISTRIBUTION
The Frequency distribution is a statistical table which
shows the values of the variable arranged in order of
magnitude, either individually or in groups. There are
two types of frequency distributions.
 Discrete frequency distribution
 Grouped frequency distribution
DR. ANKITA CHATURVEDI
USEFUL TERMS ASSOCIATED WITH
GROUPED FREQUENCY DISTRIBUTION
A. Class interval
B. Class frequency
C. Class limits
D. Mid Value
E. Width or Magnitude of the class
F. Frequency density = class frequency / width of the
class
DR. ANKITA CHATURVEDI
KINDS OF CONTINUOUS SERIES
EXCLUSIVE
SERIES
OPEN ENDED
SERIES CUMULATIVE
FREQUENCY
SERIES
INCLUSIVE
SERIES
DR. ANKITA CHATURVEDI
INCLUSIVE SERIES
 Inclusive series are those which includes the upper limit
of the class interval. E.g.
Marks No. of students
0-9 5
10-19 7
20-29 3
30-39 4
40-49 6
DR. ANKITA CHATURVEDI
EXCLUSIVE SERIES
 Exclusive series are those which excludes the upper
limit of the class interval. E.g.
Marks No. of students
0-10 5
10-20 7
20-30 3
30-40 4
40-50 6
DR. ANKITA CHATURVEDI
OPEN END CLASS INTERVAL
 When the lower limit of the first class-inteval or the upper limit of the
last class-interval, are not given then subtract the class length of the
next immediate class-interval from the upper limit. This will give us the
lower limit of the first class-interval. Similarly add the same class
length to the lower limit of the last class-interval.
DR. ANKITA CHATURVEDI
CUMULATIVE FREQUENCY SERIES
 Cumulative frequency series is that series in which the
frequencies are continuously added corresponding to
each class-interval in the series.
 There are two types of cumulative frequency
distributions:
 Less than cumulative frequency distribution
 More than cumulative frequency distribution
DR. ANKITA CHATURVEDI
Less than cumulative
frequency distribution
 It is obtained by adding successively the frequencies of
all the previous classes including the class against which
it is written. The cumulate is started from the lowest to
the highest size.
Marks students
0-10 2
10-20 5
20-30 7
30-40 9
40-50 8
50-60 3
60-70 6
Marks students
Less than 10 2
Less than 20 7
Less than 30 14
Less than 40 23
Less than 50 31
Less than 60 34
Less than 70 40
convert
DR. ANKITA CHATURVEDI
More than cumulative frequency
distribution
 It is obtained by finding the cumulate total of frequencies starting from
the highest to the lowest class.
Marks students
0-10 2
10-20 5
20-30 7
30-40 9
40-50 8
50-60 3
60-70 6
convert
Marks students
More than 0 40
More than 10 38
More than 20 33
More than 30 26
More than 40 17
More than 50 9
More than 60 6DR. ANKITA CHATURVEDI

Classification of Data

  • 1.
    CLASSIFICATION OF DATA DR.ANKITA CHATURVEDI
  • 2.
    INTRODUCTION After the datahave been collected, the next step is to present the data in some orderly and logical form so that their essential features may become explicit. The unorganised and shapeless data can neither be easily competent nor interpreted. “Classified and arranged facts speak themselves; unarranged, unorganised they are dead as mutton”. - Prof. J.R. Hicks DR. ANKITA CHATURVEDI
  • 3.
    CLASSIFICATION OF DATA “Classification is a process of arranging things or data in groups or classes according to their resemblances and affinities and gives expression to the unity of attributes that may subsist amongst a diversity of individuals.”  “Classification is the grouping of related facts into classes.”  The Process of classification data are classified into various homogenous groups or classes on the basis of similarities and resemblances.  Classification condenses the data by dropping out unnecessary details. It facilitates comparison between different sets of data clearly showing the different points of agreement and disagreement. It enables us to study the relationship between several characteristics and make further statistical treatment like tabulation, etc. DR. ANKITA CHATURVEDI
  • 4.
    DEFINITIONS “Classification is theprocess of arranging things in groups according to their resemblances and affinities.” -Connor “Classification is the process of arranging data into sequences and groups according to their common characteristics or separating them into different but related parts.” - Secrist “The process of grouping large number of individual facts and observations on the basis of similarity among the items is called classification.” - Stockton & Clark DR. ANKITA CHATURVEDI
  • 5.
    CHARACTERICTICS OF CLASSIFICATION Classification performs homogeneous grouping of data  It brings out points of similarity and dissimilarities.  The classification may be either real or imaginary  Classification is flexible to accommodate adjustments DR. ANKITA CHATURVEDI
  • 6.
    OBJECTIVES OF CLASSIFICATION To condense the mass of data in such a way that their similarities and dissimilarities become very clear.  To facilitate comparisons i.e. , to make the data comparable.  To point out the most important features of the data at a glance.  To present the data in a brief form.  To enable statistical treatment of the data collected .  To make data attractive and effective. DR. ANKITA CHATURVEDI
  • 7.
    METHODS OF CLASSIFICATION GEOGRAPHICAL CLASSIFICATION  CHRONOLOGICAL CLASSIFICATION  QUALITATIVE CLASSIFICATION  QUANTITATIVE CLASSIFICATION DR. ANKITA CHATURVEDI
  • 8.
    GEOGRAPHICAL CLASSIFICATION When thedata is classified on the basis of geographical or locational differences between the various items, it is known as Geographical Classification. E.g. area wise, zone wise, state wise, etc. e.g. NO. OF XYZ BANK BRANCHES IN JAIPUR IN 2018 STATE NO. OF FIRMS NORTH ZONE 02 EAST ZONE 04 WEST ZONE 05 SOUTH ZONE 03DR. ANKITA CHATURVEDI
  • 9.
    CHRONOLOGICAL CLASSIFICATION When datais classified on the basis of time, it is known as chronological classification. e.g. Years, Month, Weeks, Days etc. e.g. Sales of ABC LTD. YEAR SALES(IN RS. CRORES) 2014 36.1 2015 43.9 2016 54.8 2017 68.4 2018 84.4DR. ANKITA CHATURVEDI
  • 10.
    QUALITATIVE CLASSIFICATION In thistype of classification, data are classified on the basis of some attribute or quality such as sex, literacy, religion, employment, etc. This classification may be two types. i) Simple classification ii) Manifold classification DR. ANKITA CHATURVEDI
  • 11.
  • 12.
    QUANTITATIVE CLASSIFICATION Classification issaid to be quantitative when the data are expressed numerically. These types of data are known as numerical data or quantitative data. Height, weight, age, profit, turnover, income, death etc. are some of examples of this type of data. INCOME(PER MONTH) NO. OF WORKERS < 10000 15 10000- 15000 20 15000-20000 29 > 20000 10 DR. ANKITA CHATURVEDI
  • 13.
    VARIABLE Any quantitative characteristicunder study is known as variable. Basically there are two types of variables. i. Discrete variable: A variable is said to be discrete if it takes only countably many values (whole numbers). For example: Number of buses, number of persons, family size etc. ii. Continuous variable: A variable is said to be continuous if it takes all possible real values (whole number as well as fractional values) within a certain range. For example: heights, weights, temperature records, marks obtained by students etc. DR. ANKITA CHATURVEDI
  • 14.
    FREQUENCY DISTRIBUTION The Frequencydistribution is a statistical table which shows the values of the variable arranged in order of magnitude, either individually or in groups. There are two types of frequency distributions.  Discrete frequency distribution  Grouped frequency distribution DR. ANKITA CHATURVEDI
  • 15.
    USEFUL TERMS ASSOCIATEDWITH GROUPED FREQUENCY DISTRIBUTION A. Class interval B. Class frequency C. Class limits D. Mid Value E. Width or Magnitude of the class F. Frequency density = class frequency / width of the class DR. ANKITA CHATURVEDI
  • 16.
    KINDS OF CONTINUOUSSERIES EXCLUSIVE SERIES OPEN ENDED SERIES CUMULATIVE FREQUENCY SERIES INCLUSIVE SERIES DR. ANKITA CHATURVEDI
  • 17.
    INCLUSIVE SERIES  Inclusiveseries are those which includes the upper limit of the class interval. E.g. Marks No. of students 0-9 5 10-19 7 20-29 3 30-39 4 40-49 6 DR. ANKITA CHATURVEDI
  • 18.
    EXCLUSIVE SERIES  Exclusiveseries are those which excludes the upper limit of the class interval. E.g. Marks No. of students 0-10 5 10-20 7 20-30 3 30-40 4 40-50 6 DR. ANKITA CHATURVEDI
  • 19.
    OPEN END CLASSINTERVAL  When the lower limit of the first class-inteval or the upper limit of the last class-interval, are not given then subtract the class length of the next immediate class-interval from the upper limit. This will give us the lower limit of the first class-interval. Similarly add the same class length to the lower limit of the last class-interval. DR. ANKITA CHATURVEDI
  • 20.
    CUMULATIVE FREQUENCY SERIES Cumulative frequency series is that series in which the frequencies are continuously added corresponding to each class-interval in the series.  There are two types of cumulative frequency distributions:  Less than cumulative frequency distribution  More than cumulative frequency distribution DR. ANKITA CHATURVEDI
  • 21.
    Less than cumulative frequencydistribution  It is obtained by adding successively the frequencies of all the previous classes including the class against which it is written. The cumulate is started from the lowest to the highest size. Marks students 0-10 2 10-20 5 20-30 7 30-40 9 40-50 8 50-60 3 60-70 6 Marks students Less than 10 2 Less than 20 7 Less than 30 14 Less than 40 23 Less than 50 31 Less than 60 34 Less than 70 40 convert DR. ANKITA CHATURVEDI
  • 22.
    More than cumulativefrequency distribution  It is obtained by finding the cumulate total of frequencies starting from the highest to the lowest class. Marks students 0-10 2 10-20 5 20-30 7 30-40 9 40-50 8 50-60 3 60-70 6 convert Marks students More than 0 40 More than 10 38 More than 20 33 More than 30 26 More than 40 17 More than 50 9 More than 60 6DR. ANKITA CHATURVEDI