Downloaded 76 times


![What is bar diagram ?
A bar chart or bar diagram is a chart that present qualitative
(grouped) data with rectangular bars with lengths proportional
to the values that they represent. [N:B: In this type diagram,
rectangular bars must be separated from each other by same
distance. ]
Page: 5](https://image.slidesharecdn.com/statisticspresentation-160324162535/85/Bar-Diagram-chart-in-Statistics-presentation-5-320.jpg)
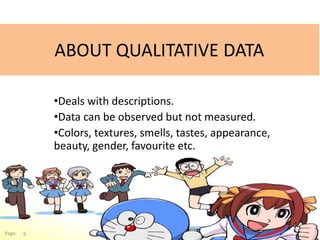
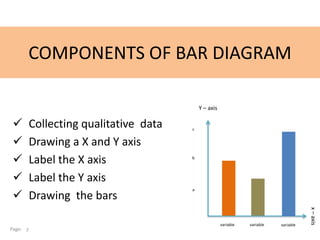
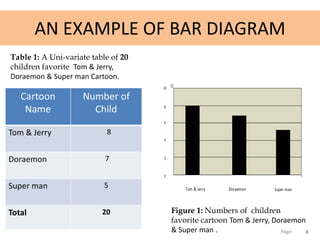
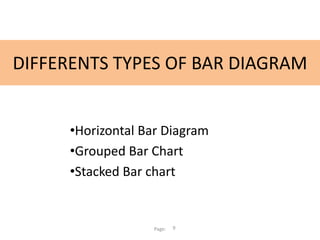
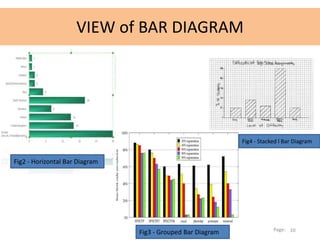


This document discusses bar diagrams and their components. It defines a bar diagram as a chart that uses rectangular bars to present qualitative data, with the bar lengths proportional to the values. It notes that qualitative data deals with descriptions that can be observed but not measured, such as colors, textures, smells, tastes, and appearances. The key components of a bar diagram are collecting qualitative data, drawing and labeling the x- and y- axes, and drawing the bars. An example bar diagram and table show the numbers of children who favorite different cartoons. Finally, it lists different types of bar diagrams like horizontal, grouped, and stacked bar charts.