UNIT II-DESCRIPTIVE ANALYTICS
Introduction– Data, Information and Knowledge –
Business Intelligence – Data Warehouse – Dashboard
– Reporting – Data Visualization – Descriptive
Statistics-
Practical applications.
2.
Introduction to DescriptiveAnalytics
• Descriptive Analytics is the process of analyzing historical data to gain insights into past
trends and patterns.
• It answers the question, “What happened?” by summarizing raw data and transforming it
into meaningful information that can be used for decision-making.
• Descriptive analytics is often the first step in the analytics hierarchy and forms the
foundation for more advanced analytics techniques like predictive and prescriptive analytics.
Key characteristics of descriptive analytics:
• Summarization: Aggregates and organizes data into charts, graphs, reports, and dashboards.
• Business Insights: Provides a comprehensive view of past performance across different
business areas.
• Data Sources: Often relies on structured data stored in systems like databases and data
warehouses.
• Visualization: Often presented in the form of graphs, charts, and reports for easier
interpretation.
• Trend Identification: Helps identify patterns such as sales fluctuations, customer
preferences, or seasonality.
• Tools and Techniques: Includes tools like Microsoft Excel, Power BI, Tableau, and statistical
methods like mean, median, mode, and standard deviation.
3.
Key Components ofDescriptive Analytics
1. Reporting--Reporting involves compiling raw data into meaningful summaries, charts, or tables to
provide actionable insights.
Key Elements:
Periodic Reports: Daily, weekly, or monthly reports tracking metrics like sales, revenue, or
customer acquisition.
Dashboards: Interactive tools offering real-time data visualizations, such as sales trends,
operational efficiency, or employee performance.
Ad Hoc Reports: Custom reports addressing specific queries or business needs.
Example:
A sales manager may generate a weekly sales report to compare sales performance across regions
and evaluate the team’s progress toward goals.
4.
2. Data Visualization:Datavisualization is the process of displaying data
•(often in large quantities) in a meaningful fashion to provide insights that will
support better decisions.
•Data visualization refers to the graphical representation of data to uncover patterns, trends, and
relationships. It helps make large datasets comprehensible and actionable by utilizing tools like
charts, graphs, and infographics.
Tools for Visualization: Tableau, Microsoft Power BI, Google Data Studio, Excel
5.
Definition:
•Data refers toraw, unorganized facts and figures that are collected from observations or
measurements.
Characteristics:
•Objective: Data is factual and does not depend on interpretation.
•Unstructured: Often collected in its natural state without organization.
•Quantitative or Qualitative: Can be numerical (e.g., sales figures) or descriptive (e.g., customer
feedback).
Examples:
•A list of numbers: 34, 67, 23, 89.
•A log of temperatures: 30°C, 31°C, 32°C over three days.
•Words without structure: "blue," "large," "heavy."
Sources:
•Surveys, sensors, financial records, social media, transactions, etc.
1. Quantitative data
•Quantitativedata seems to be the easiest to explain. It answers key questions such as “how many,
“how much” and “how often”.
•Quantitative data can be expressed as a number or can be quantified. Simply put, it can be measured
by numerical variables.
•Quantitative data are easily amenable to statistical manipulation and can be represented by a wide
variety of statistical types of graphs and charts such as line, bar graph, scatter plot, and etc.
Examples of quantitative data:
•Scores on tests and exams e.g. 85, 67, 90 and etc.
•The weight of a person or a subject.
•Your shoe size.
•The temperature in a room.
8.
2. Qualitative data
•Qualitativedata can’t be expressed as a number and can’t be measured. Qualitative data consist of
words, pictures, and symbols, not numbers.
•Qualitative data is also called categorical data because the information can be sorted by category, not
by number.
•Qualitative data can answer questions such as “how this has happened” or and “why this has
happened”.
•Examples of qualitative data:
•Colors e.g. the color of the sea
•Your favorite holiday destination such as Hawaii, New Zealand and etc.
•Names as John, Patricia..
•Ethnicity such as American Indian, Asian, etc.
9.
Nominal vs. OrdinalData
Nominal data
•Nominal data is used just for labelling variables, without any type of quantitative value. The name
‘nominal’ comes from the Latin word “nomen” which means ‘name’.
•The nominal data just name a thing without applying it to order. Actually, the nominal data could just
be called “labels.”
Examples of Nominal Data:
•Gender (Women, Men)
•Hair color (Blonde, Brown, Brunette, Red, etc.)
•Marital status (Married, Single, Widowed)
•Ethnicity (Hispanic, Asian)
•Eye color is a nominal variable having a few categories (Blue, Green, Brown) and there is no way to
order these categories from highest to lowest.
10.
Ordinal data
•Ordinal datashows where a number is in order. This is the crucial difference from nominal types of
data.
•Ordinal data is data which is placed into some kind of order by their position on a scale. Ordinal data
may indicate superiority.
•In other words, the ordinal data is qualitative data for which the values are ordered.
•In comparison with nominal data, the second one is qualitative data for which the values cannot be
placed in an ordered.
•We can also assign numbers to ordinal data to show their relative position. But we cannot do math
with those numbers. For example: “first, second, third…etc.”
Examples of Ordinal Data:
•The first, second and third person in a competition.
•Letter grades: A, B, C, and etc.
•When a company asks a customer to rate the sales experience on a scale of 1-10.
•Economic status: low, medium and high.
11.
Discrete vs. ContinuousData
•In statistics, marketing research, and data science, many decisions depend on whether the basic data
is discrete or continuous.
Discrete data
•Discrete data is a count that involves only integers. The discrete values cannot be subdivided into
parts.
•For example, the number of children in a class is discrete data. You can count whole individuals. You
can’t count 1.5 kids.
•To put in other words, discrete data can take only certain values. The data variables cannot be
divided into smaller parts.
•It has a limited number of possible values e.g. days of the month.
Examples of discrete data:
•The number of students in a class.
•The number of workers in a company.
•The number of test questions you answered correctly
12.
Continuous data
•Continuous datais information that could be meaningfully divided into finer levels. It can be measured
on a scale or continuum and can have almost any numeric value.
•For example, you can measure your height at very precise scales — meters, centimeters, millimeters and
etc.
•You can record continuous data at so many different measurements – width, temperature, time, and
etc. This is where the key difference from discrete types of data lies.
•The continuous variables can take any value between two numbers. For example, between 50 and 72
inches, there are literally millions of possible heights: 52.04762 inches, 69.948376 inches and etc.
•A good great rule for defining if a data is continuous or discrete is that if the point of measurement can
be reduced in half and still make sense, the data is continuous.
Examples of continuous data:
•The amount of time required to complete a project.
•The height of children.
•The square footage of a two-bedroom house.
•The speed of cars.
13.
• Businesses generateand gather more
and more data at an increasing pace:
Big Data.
• A massive volume of structured and
unstructured data
• Extremely difficult to manage, process, and
analyze using traditional data processing tools
• Present great opportunities to gain
knowledge and game-changing intelligence
14.
• There arethree characteristics of big data.
– Volume: immense amount of data compiled for a single or multiple
sources
– Velocity: generated at a rapid speed, management is a critical issue
– Variety: all types, forms, granularity, structure or unstructured
• Additional characteristics
– Veracity: credibility and quality of the data, reliability
– Values: methodological plan for formulating questions, curating the
right data, and unlocking hidden potential
• Having a plethora of data does not guarantee that useful insights
or measurable improvements will be generated.
15.
Definition:
•Information is processed,structured, or organized data that provides context and meaning.
•It answers questions like who, what, when, where, and how.
Characteristics:
•Contextual: Information gains relevance when placed in context.
•Accurate and Timely: Useful information should be reliable and delivered when needed.
•Purposeful: It serves a specific purpose in decision-making.
•Process of Conversion:
•Data → Cleaning → Organizing → Summarizing → Information
Examples:
•From data: "34, 67, 23, 89"
• To information: "The test scores of four students are 34, 67, 23, and 89."
•From temperature data: "30°C, 31°C, 32°C"
• To information: "The average temperature over three days is 31°C."
•A sales report showing monthly revenue trends.
16.
Definition:
•Knowledge is derivedfrom information through analysis, experience, and understanding.
•It involves interpreting information to make decisions or predict outcomes.
•It answers why and how questions.
Characteristics:
•Actionable: Knowledge leads to insights that guide decision-making.
•Cumulative: Built on existing information and personal/organizational experience.
•Tacit vs. Explicit:
• Tacit Knowledge: Personal, experience-based knowledge (e.g., intuition, expertise).
• Explicit Knowledge: Documented knowledge that can be easily shared (e.g., manuals,
policies).
Examples:
•Using sales trends (information) to predict future demand.
•Understanding customer preferences based on feedback and behavior.
•Analyzing past marketing campaigns to design an effective new strategy.
17.
Relationship Between Data,Information, and Knowledge
• Data is the foundation and the raw material.
• Information is created by organizing and contextualizing data.
• Knowledge emerges when information is interpreted and applied.
• Example Flow:
• Data: "10, 20, 30, 40"
• Information: "Sales in Q1 were $10k, Q2 $20k, Q3 $30k, and Q4 $40k."
• Knowledge: "Sales are steadily increasing each quarter. This trend suggests strong market
performance."
18.
Data Sets, Variables,and Observations
• A data set is generally a rectangular table of data where the columns contain variables, such as height,
gender, and income, and each row contains an observation.
• Each observation includes the attributes of a particular member of the population: a person, a company, a
city, a machine, or whatever.
• A variable (column) is often called a field or an attribute, and an observation (row) is often called a case
or a record. Also, data sets are occasionally rearranged, so that the variables are in rows and the
observations are in columns.
• However, the most common arrangement by far is to have variables in columns, with variable names in
the top row, and observations in the remaining rows.
19.
Business analytic process
•The complete business analytic
process involves the three major
component steps applied
sequentially to a source of data
(see Figure 1.1 ).
• The outcome of the business
analytic process must relate to
business and seek to improve
business performance in some
way.
23.
• Data dashboardsare collections of tables, charts, maps, and summary statistics that are
updated as new data become available.
• Dashboards are used to help management monitor specific aspects of the company’s
performance related to their decision-making responsibilities.
• For corporate-level managers, daily data dashboards might summarize sales by region, current
inventory levels, and other company-wide metrics;
• front-line managers may view dashboards that contain metrics related to staffing levels, local
inventory levels, and short-term sales forecasts.
• Data mining is the use of analytical techniques for better understanding patterns and
relationships that exist in large data sets.
• Data mining includes unsupervised learning techniques which are descriptive methods that
seek to identify patterns based on notions of similarity (cluster analysis) or correlation
(association rules) in different types of data.
• For example, by processing text on social network platforms such as Twitter, similar customer
comments can be grouped together into clusters to help Apple better understand how its
customers are feeling about the Apple Watch.
Key Features ofBusiness Intelligence
• Data Analysis and Interpretation: BI tools analyze structured and unstructured data to
uncover patterns, trends, and insights.
• Data Visualization: BI relies on dashboards, charts, and reports for better data
comprehension.
• Decision Support: By providing insights, BI aids in strategic, tactical, and operational decision-
making.
• Real-Time Monitoring: Advanced BI systems offer real-time data monitoring to respond to
immediate business needs.
• Predictive Analytics: Modern BI solutions leverage machine learning and artificial intelligence
(AI) for forecasting and predicting future trends.
26.
Importance of BusinessIntelligence
• Improved Decision-Making:
• Enables data-driven decisions by providing accurate, up-to-date information.
• Reduces reliance on intuition or guesswork.
• Enhanced Operational Efficiency:
• Streamlines processes by identifying inefficiencies.
• Helps monitor and improve performance metrics.
• Customer Insights:
• Analyzes customer behavior, preferences, and feedback.
• Improves customer satisfaction and retention.
• Competitive Advantage:
• Identifies market trends and opportunities faster than competitors.
• Helps design strategies to capture new markets.
• Cost Reduction:
• Detects cost-saving opportunities through operational analysis.
• Optimizes resource allocation.
27.
Components of BusinessIntelligence
• Data Sources:
• Internal (e.g., CRM, ERP systems) and external (e.g., social media, market
research).
• Data Integration:
• Data is collected, cleaned, and integrated from various sources.
• Data Storage:
• Centralized data repositories such as data warehouses or data lakes store the
integrated data.
• Analytical Tools:
• Tools like Power BI, Tableau, QlikView, and SAP BusinessObjects analyze the data.
• Reporting and Visualization:
• Interactive dashboards, charts, and reports for easier interpretation.
• End Users:
• Business managers, analysts, and decision-makers who utilize insights for
strategic actions.
28.
Applications of BusinessIntelligence
• Sales and Marketing:
• Tracking sales performance, customer acquisition costs, and campaign
effectiveness.
• Finance:
• Budgeting, financial forecasting, and risk assessment.
• Supply Chain Management:
• Inventory optimization and vendor performance analysis.
• Human Resources:
• Workforce analytics, employee performance tracking, and HR planning.
• Healthcare:
• Patient data analysis, operational efficiency, and resource allocation.
29.
Benefits of BusinessIntelligence
• Faster and more accurate reporting.
• Improved customer satisfaction.
• Proactive identification of opportunities and risks.
• Better resource management and operational efficiency.
• Support for strategic planning and goal-setting.
30.
Challenges in ImplementingBusiness Intelligence
• High Initial Costs:
• Investing in BI infrastructure can be expensive.
• Data Integration Issues:
• Combining data from multiple sources can be complex.
• User Adoption:
• Employees may resist learning and using new BI tools.
• Data Quality:
• BI insights are only as good as the quality of the underlying data.
• Rapid Technological Changes:
• BI systems need regular updates to stay relevant.
31.
Modern Trends inBusiness Intelligence
• AI and Machine Learning Integration:
• Advanced BI platforms are now powered by AI for predictive analytics and
automation.
• Self-Service BI:
• Non-technical users can analyze data and create reports without needing IT
support.
• Cloud-Based BI Solutions:
• Cloud platforms offer scalability, cost-efficiency, and remote access.
• Mobile BI:
• BI tools are accessible on smartphones and tablets for on-the-go insights.
• Data Storytelling:
• Interactive narratives built around data to communicate insights effectively.
32.
Examples of BusinessIntelligence in Action
• Amazon:
Uses BI to analyze customer purchasing behavior, recommend products, and optimize its
supply chain.
• Starbucks:
Implements BI to decide store locations, personalize customer offerings, and track
customer loyalty.
• Netflix:
Leverages BI to recommend shows, optimize content investments, and retain
subscribers.
35.
Data Warehouse: ACore Component of Descriptive Analytics
• A Data Warehouse (DW) is a centralized repository that stores structured data from
multiple sources. It is specifically designed to support reporting and analytical tasks,
making it a critical component of descriptive analytics.
• Key Features of a Data Warehouse:
• Integrated Data: Combines data from various heterogeneous sources like
transactional systems, CRM, ERP, and external sources.
• Subject-Oriented: Organized around key business subjects such as sales, marketing,
finance, and operations.
• Time-Variant: Stores historical data to track changes over time, enabling trend
analysis.
• Non-Volatile: Once entered into the warehouse, data does not change, ensuring
consistency for analysis.
• Optimized for Queries: Designed for fast query performance and analytical
processing.
Architecture of aData Warehouse
• Data Sources: The origin of raw data, including
transactional systems, flat files, and external databases.
• ETL (Extract, Transform, Load) Process:
• Extract: Collects data from different sources.
• Transform: Cleans and formats the data into a
unified structure.
• Load: Inserts the transformed data into the data
warehouse.
• Data Storage: Centralized storage for data, often
organized using star or snowflake schemas.
• Metadata: Provides information about the data (e.g.,
data source, format, and relationships).
• Access and Presentation Layer: Tools like dashboards,
OLAP (Online Analytical Processing) cubes, and reports
for querying and visualizing data.
40.
Benefits of aData Warehouse in Descriptive Analytics
• Improved Decision-Making: Centralized and integrated data provides a comprehensive view for better
decisions.
• Historical Analysis: Enables trend identification by storing historical data.
• Data Consistency: Ensures data accuracy and reliability across the organization.
• Scalability: Can accommodate growing data volumes as the business expands.
• Faster Reporting: Optimized for quick query performance and reporting.
43.
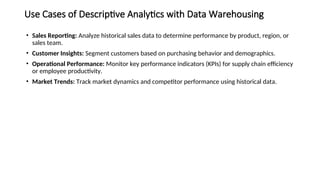
Use Cases ofDescriptive Analytics with Data Warehousing
• Sales Reporting: Analyze historical sales data to determine performance by product, region, or
sales team.
• Customer Insights: Segment customers based on purchasing behavior and demographics.
• Operational Performance: Monitor key performance indicators (KPIs) for supply chain efficiency
or employee productivity.
• Market Trends: Track market dynamics and competitor performance using historical data.
44.
Dashboard in DescriptiveAnalytics
A dashboard is a critical tool used in descriptive analytics to visually summarize and communicate data
insights.
It acts as a single interface that consolidates data into interactive visualizations, making it easier for
decision-makers to monitor key metrics and trends in real-time.
Dashboards provide important summaries of key business information to help manage a business process
or function.
Figure shows a simple dashboard for the product sales data in Figure 3.1 showing monthly sales for each
product individually, sales of all products combined, total annual sales by product, a comparison of the
last two months, and monthly percent changes by product.
45.
Key Components ofa Dashboard:
1.Key Performance Indicators (KPIs): Focus on metrics aligned with business goals, such as
revenue, customer satisfaction, or churn rate.
2.Data Visualizations: Include charts, graphs, heat maps, and gauges to make data easier to
comprehend.
3.Filters and Interactivity: Allow users to drill down into specific details or filter data based on
regions, timeframes, or departments.
4.Real-Time Data Updates: Many dashboards integrate with live data sources to provide real-time
insights.
5.User-Friendly Interface: Designed to be intuitive and accessible to all users, regardless of
technical expertise.
46.
Tools for CreatingDescriptive Analytics Dashboards:
1.Microsoft Power BI: User-friendly and integrates with multiple data sources.
2.Tableau: Known for its advanced visualizations and ease of use.
3.Google Data Studio:A free tool for creating interactive dashboards.
4.Excel: Suitable for basic dashboards and data visualizations.
47.
Benefits of UsingDashboards in Descriptive Analytics:
•Enhanced Decision-Making: Provides a quick snapshot of business performance, enabling
informed decisions.
•Time Efficiency: Eliminates the need for manual reporting by automating data collection and
presentation.
•Improved Collaboration: Teams can access the same data, fostering transparency and
collaboration.
•Customization: Dashboards can be tailored to specific roles, departments, or business needs.
48.
Example of aDashboard in Descriptive Analytics
Scenario: A Retail Company Monitoring Sales Performance
1.KPIs Displayed:
o
Total revenue, Units sold, Sales by region, Top-performing products
2.Visualizations:
o
A bar chart showing monthly revenue trends.
o
A heat map highlighting sales by region.
o
A pie chart displaying the percentage contribution of each product category.
•Interactivity:
1. Filters for viewing sales data by region or product category.
2. Drill-down capabilities to explore specific time periods or product lines.
49.
Some of themost common dashboards include:
Strategic dashboards: These dashboards are responsible for tracking key performance
indicators that help users make more strategic decisions.
Operational dashboards: This kind of dashboard offers a view of current performance.
Executive dashboards: This dashboard equips business leaders with an overview of overall
organizational performance.
Analytical dashboards: This common dashboard tracks, processes, and analyzes data to
identify trends and actionable insights.
Marketing dashboards: These effective dashboards provide a snapshot of key metrics for
digital marketing campaigns, such as engagement and conversion rate.
Types of dashboards
DV
Data visualization isthe
graphical representation of
information. In this guide we
will study what is Data
visualization and its
importance with use cases.
Data Visualization
Understanding Data Visualization
Data visualization translates complex data sets into
visual formats that are easier for the human brain to
understand. This can include a variety of visual tools
such as:
Charts: Bar charts, line charts, pie charts, etc.
Graphs: Scatter plots, histograms, etc.
Maps: Geographic maps, heat maps, etc.
Dashboards: Interactive platforms that combine
multiple visualizations.
58.
Tabular
versus
Visual Data Analysis
Figure3.1 shows the data in the Excel
file Monthly Product Sales. We can use
the data to determine exactly how
many units of a certain product were
sold in a Particular month, or to
compare one month to another.
For example, we see that sales of
product A dropped in February,
specifically by 6.7% (computed by the
Excel formula 1B3/B2). Beyond such
calculations,
however, it is difficult to draw big
picture conclusions.
Figure 3.2 displays a chart of monthly sales for
each product. We can easily compare overall
sales of different products (Product C sells the
least, for example), and identify trends (sales of
Product D are increasing),
other patterns (sales of Product C is relatively
stable while sales of Product B fluctuates more
over time), and exceptions (Product E’s sales fell
considerably in September).
59.
Column and BarCharts
•Excel distinguishes between vertical and horizontal bar charts, calling the former column
charts and the latter bar charts. A clustered column chart compares values across categories
using vertical rectangles; a stacked column chart displays the contribution of each value to the
total by stacking the rectangles; and a 100% stacked column chart compares the percentage
that each value contributes to a total. Column and bar charts are useful for comparing
categorical or ordinal data, for illustrating differences between sets of values, and for showing
proportions or percentages of a whole.
60.
Data Labels andData Tables Chart Options
•Excel provides options for including the numerical data on which charts are based within the charts.
Data labels can be added to chart elements to show the actual value of bars, for example. Data tables
can also be added; these are usually better than data labels, which can get quite messy. Both can be
added from the Add Chart Element Button in the Chart Tools Design tab, or also from the Quick
Layout button, which provides standard design options. Figure 3.9 shows a data table added to the
Alabama Employment chart. You can see that the data table provides useful additional information
to improve the visualization.
61.
Line Charts
•Line chartsprovide a useful means for displaying data over time, as
Example 3.3 illustrates. You may plot multiple data series in line charts;
however, they can be difficult to interpret if the magnitude of the data
values differs greatly. In that case, it would be advisable to create
separate charts for each data series.
62.
Data visualization professionalsdon’t recommend using pie charts.
In the pie chart, it is difficult to compare the relative sizes of areas;
however, the bars in the column chart can easily be compared to determine relative ratios of the data.
If you do use pie charts, restrict them to small numbers of categories, always ensure that the numbers add to
100%, and use labels to display the group names and actual percentages. Avoid three dimensional (3-D) pie
charts—especially those that are rotated—and keep them simple.
63.
Area Chart
•An areachart combines the features of a pie chart with those of line charts. Area charts present
more information than pie or line charts alone but may clutter the observer’s mind with too many
details if too many data series are used; thus, they should be used with care.
•Figure 3.14 displays total energy consumption (billion Btu) and consumption of fossil fuels from the
Excel file Energy Production & Consumption. This chart shows that although total energy
consumption has grown since 1949, the relative proportion of fossil fuel consumption has remained
generally consistent at about half of the total, indicating that alternative energy sources have not
replaced a significant portion of fossil-fuel consumption.
64.
• X-Axis (Horizontal):Represents the years, starting from 1949 to 2012. Y-Axis (Vertical):
Represents the amount of energy consumption (units not specified, but likely in quadrillion BTUs
or similar). Two Categories of Energy Consumption: Fossil Fuels Consumption (Blue Area): This
represents the portion of energy derived from fossil fuels.
• Total Energy Consumption (Red Area, includes Blue Area): This represents the overall energy
consumption, which includes fossil fuels and other energy sources (such as renewable energy and
nuclear energy).
65.
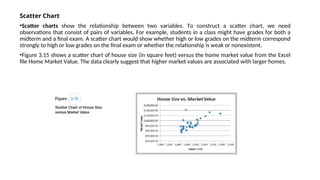
Scatter Chart
•Scatter chartsshow the relationship between two variables. To construct a scatter chart, we need
observations that consist of pairs of variables. For example, students in a class might have grades for both a
midterm and a final exam. A scatter chart would show whether high or low grades on the midterm correspond
strongly to high or low grades on the final exam or whether the relationship is weak or nonexistent.
•Figure 3.15 shows a scatter chart of house size (in square feet) versus the home market value from the Excel
file Home Market Value. The data clearly suggest that higher market values are associated with larger homes.
66.
Bubble Charts
•A bubblechart is a type of scatter chart in which the size of the data marker corresponds to the value of a third
variable; consequently, it is a way to plot three variables in two dimensions.
•Figure 3.16 shows a bubble chart for displaying price,
•P/E (price/earnings) ratio, and market capitalization for five different stocks on one particular day in the Excel file
Stock Comparisons.
•The position on the chart shows the price and P/E; the size of the bubble represents the market cap in billions of
dollars.
67.
Miscellaneous Excel Charts
•Excelprovides several additional charts for special applications. These additional types of charts
(including bubble charts) can be selected and created from the Other Charts button in the Excel ribbon.
These include the following:
•A stock chart allows you to plot stock prices, such as the daily high, low, and close. It may also be used
for scientific data such as temperature changes.
•A surface chart shows 3-D data.
•A doughnut chart is similar to a pie chart but can contain more than one data series.
•A radar chart allows you to plot multiple dimensions of several data series.
70.
Other Excel DataVisualization Tools
•Data Visualization through Conditional Formatting
•Data bars display colored bars that are scaled to the magnitude of the data values (similar to a bar
chart) but placed directly within the cells of a range. Figure 3.17 shows data bars applied to the data in
the Monthly Product Sales worksheet. Highlight the data in each column, click the Conditional
Formatting button in the Styles group within the Home tab, select Data Bars, and choose the fill option
and color.
•Color scales shade cells based on their numerical value using a color palette.
71.
• This isanother option in the Conditional Formatting menu.
• For example, in Figure 3.18 we use a green-yellow-red color scale, which highlights cells
containing large values in green, small values in red, and middle values in yellow. The darker the
green, the larger the value; the darker the red, the smaller the value. For intermediate values,
you can see that the colors blend together.
• This provides a quick way of identifying the largest and smallest product-month sales values.
72.
Sparklines
•Sparklines are graphicsthat
summarize a row or column of
data in a single cell. Sparklines
were introduced by Edward Tufte, a
famous expert on visual
presentation of data. He described
sparklines as “data-intense, design-
simple, word-sized graphics.”
• Excel has three types of sparklines:
line, column, and win/loss. Line
sparklines are clearly useful for
time-series data, while column
sparklines are more appropriate for
categorical data. Win- loss
sparklines are useful for data that
move up or down over time. They
are found in the Sparklines group
within the Insert menu on the
ribbon.
75.
Data Queries: Tables,Sorting, and Filtering
•Managers make numerous queries about data. For example, in the Purchase Orders
database (Figure 1.3), they might be interested in finding all orders from a certain supplier,
all orders for a particular item, or tracing orders by order data. To address these queries, we
need to sort the data in some way. In other cases, managers might be interested in
extracting a set of records having certain characteristics. This is termed filtering the data. For
example, in the Purchase Orders database, a manager might be interested in extracting all
records corresponding to a certain item.
•Excel provides a convenient way of formatting databases to facilitate analysis, called Tables.
76.
Filtering Data
•For largedata files, finding a
particular subset of records that
meet certain characteristics by
sorting can be tedious.
•Excel provides two filtering tools:
AutoFilter for simple criteria and
Advanced Filter for more complex
criteria.
78.
Pareto Analysis
•Pareto analysisis a term named after an Italian economist, Vilfredo Pareto, who, in 1906,
observed that a large proportion of the wealth in Italy was owned by a relatively small
proportion of the people.
•The Pareto principle is often seen in many business situations.
•For example, a large percentage of sales usually comes from a small percentage of customers,
a large percentage of quality defects stems from just a couple of sources, or a large percentage
of inventory value corresponds to a small percentage of items.
•As a result, the Pareto principle is also often called the “80–20 rule,” referring to the generic
situation in which 80% of some output comes from 20% of some input. A Pareto analysis relies
on sorting data and calculating the cumulative percentage of the characteristic of interest.
79.
Applying the ParetoPrinciple
•The Excel file Bicycle Inventory lists the inventory of bicycle models in a sporting goods store (see
columns A through F in Figure 3.26). To conduct a Pareto analysis, we first compute the inventory
value of each product by multiplying the quantity on hand by the purchase cost; this is the amount
invested in the items that are currently in stock. Then we sort the data in decreasing order of
inventory value and compute the percentage of the total inventory value for each product and the
cumulative percentage. See columns G through I in Figure 3.26. We see that about 75% of the
inventory value is accounted for by less than 40% (9 of 24) of the items. If these high-value
inventories aren’t selling well, the store manager may wish to keep fewer in stock.
83.
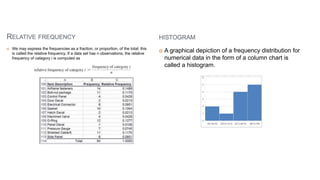
Frequency Distributions forCategorical Data
•A frequency distribution is a table that shows the
number of observations in each of several
nonoverlapping groups. Categorical variables naturally
define the groups in a frequency distribution.
•For example, in the Purchase Orders database (see
Figure), orders were placed for the following items:
•Airframe fasteners,Bolt-nut package,Control Panel,
Door Decal, Electrical Connector, Gasket, Hatch Decal,
Machined Valve, O-Ring, Panel Decal, Pressure Gauge,
Shielded Cable/ft., Side Panel
•To construct a frequency distribution, we need only
count the number of observations that appear in each
category. This can be done using the Excel COUNTIF
function.
93.
Measures of Location
•Measuresof location provide estimates of a single value that in some fashion represents the
“centering” of a set of data.
•The most common is the average. We all use averages routinely in our lives, for example, to
measure student accomplishment in college (e.g., grade point average), to measure the
performance of sports teams (e.g., batting average), and to measure performance in business
(e.g., average delivery time).
95.
Median
•The measure oflocation that
specifies the middle value when the
data are arranged from least to
greatest is the median.
•Half the data are below the median,
and half the data are above it. For an
odd number of observations, the
median is the middle of the sorted
numbers.
•For an even number of observations,
the median is the mean of the two
middle numbers.
96.
Mode
•A third measureof location is the mode.
•The mode is the observation that occurs
most frequently. The mode is most useful
for data sets that contain a relatively
small number of unique values.
•For data sets that have few repeating
values, the mode does not provide much
practical value.
•You can easily identify the mode from a
frequency distribution by identifying the
value having the largest frequency or
from a histogram by identifying the
highest bar.
99.
Measures of Dispersion
•Dispersionrefers to the degree of variation in the data, that is, the numerical spread (or compactness) of
the data. Several statistical measures characterize dispersion: the range, variance, and standard deviation.
Range
•The range is the simplest and is the difference between the maximum value and the minimum value in
the data set.
Interquartile Range
•The difference between the first and third quartiles, Q3 - Q1, is often called the interquartile range (IQR),
or the midspread. This includes only the middle 50% of the data and, therefore, is not influenced by
extreme values. Thus, it is sometimes used as an alternative measure of dispersion.
104.
Coefficient of Variation
•Thecoefficient of variation (CV) provides a relative measure of the dispersion in data relative to the
mean and is defined as
•Sometimes the coefficient of variation is multiplied by 100 to express it as a percent. This statistic is
useful when comparing the variability of two or more data sets when their scales differ. The coefficient
of variation provides a relative measure of risk to return. The smaller the coefficient of variation, the
smaller the relative risk is for the return provided. The reciprocal of the coefficient of variation, called
return to risk, is often used because it is easier to interpret.
107.
Measures of Association
•Twovariables have a strong statistical relationship with one another if they appear to move
together. We see many examples on a daily basis; for instance, attendance at baseball games is
often closely related to the win percentage of the team, and ice cream sales likely have a strong
relationship with daily temperature.
Covariance
•Covariance is a measure of the linear association between two variables, X and Y. Like the
variance, different formulas are used for populations and samples. Computationally, covariance
of a population is the average of the products of deviations of each observation from its
respective mean:
108.
Covariance tells iftwo things move together or not but doesn’t tell how strong that relationship is.
Correlation-tells both whether they move together and how strong that relationship.
Correlation
•The numerical value of the covariance is generally difficult to interpret because it depends on the units
of measurement of the variables.
•For example, if we expressed the graduation rate as a true proportion rather than as a percentage in
the previous example, the numerical value of the covariance would be smaller, although the linear
association between the variables would be the same.
•Correlation is a measure of the linear relationship between two variables, X and Y, which does not
depend on the units of measurement.
•Correlation is measured by the correlation coefficient, also known as the Pearson product moment
correlation coefficient.
109.
A correlation of0 indicates that the two variables have no linear relationship to each other. Thus, if
one changes, we cannot reasonably predict what the other variable might do. A positive
correlation coefficient indicates a linear relationship for which one variable increases as the other
also increases. A negative correlation coefficient indicates a linear relationship for one variable
that increases while the other decreases. In economics, for instance, a price-elastic product has a
negative correlation between price and sales; as price increases, sales decrease, and vice versa.
These relationships are illustrated in Figure 4.24. Note that although Figure 4.24(d) has a clear
relationship between the variables, the relationship is not linear and the correlation is zero.
110.
Benefits of DescriptiveAnalytics
Provides a clear understanding of historical performance.
Improves decision-making by presenting actionable insights.
Facilitates communication of data findings through visualizations and reports.
Forms the foundation for advanced analytics (predictive and prescriptive).
Applications of Descriptive Analytics
•Customer Insights: Understanding customer behavior, purchase patterns, and preferences through
historical sales data.
•Marketing Analytics: Measuring the effectiveness of past campaigns and identifying best-performing
channels.
•Operational Efficiency: Identifying bottlenecks in processes and optimizing resources.
•Risk Management: Monitoring historical data to detect anomalies or early warning signs of potential
risks.
111.
Financial Analytics
•The financialservices sector relies heavily on descriptive, predictive, and prescriptive analytics.
Descriptive analytics, through the use of data visualization, is used to monitor financial performance,
including stock returns, trading volumes, and measures of market return and volatility.
•Predictive models are used to forecast financial performance, to assess the risk of investment
portfolios and projects, and to construct financial instruments such as derivatives.
•Prescriptive models are used to construct optimal portfolios of investments, to allocate assets, and to
create optimal capital budgeting plans.
112.
Human Resource (HR)Analytics
The HR function is charged with ensuring that the organization
(1)has the mix of skill sets necessary to meet its needs,
(2) is hiring the highest-quality talent and providing an environment that retains it, and
(3) achieves its organizational diversity goals. Google refers to its HR Analytics function as “people
analytics.”
Google has analyzed substantial data on their own employees to determine the characteristics of great
leaders, to assess factors that contribute to productivity, and to evaluate potential new hires.
Google also uses predictive analytics to continually update their forecast of future employee turnover
and retention.
113.
Marketing Analytics
•A betterunderstanding of consumer behavior through the use of scanner data and data generated
from social media has led to an increased interest in marketing analytics. As a result, descriptive,
predictive, and prescriptive analytics are all heavily used in marketing.
•A better understanding of consumer behavior through analytics leads to the better use of advertising
budgets, more effective pricing strategies, improved forecasting of demand, improved product-line
management, and increased customer satisfaction and loyalty.
114.
Health Care Analytics
•Theuse of analytics in health care is on the increase because of pressure to simultaneously control
costs and provide more effective treatment.
•Descriptive, predictive, and prescriptive analytics are used to improve patient, staff, and facility
scheduling; patient flow; purchasing; and inventory control.
•Predictive analytics is used to predict which patients are most likely to not adhere to their required
medications so that proactive reminders can be sent to help these patients.
•Prescriptive analytics has been used directly to provide better patient outcomes.
•For example, researchers at Georgia Tech helped develop approaches that optimally place radiation
seeds to treat prostate cancer so that the cancer is eradicated while doing minimal damage to healthy
tissue.
115.
Supply Chain Analytics
•Thecore service of companies such as UPS and FedEx is the efficient delivery of goods, and analytics
has long been used to achieve efficiency.
•The optimal sorting of goods, vehicle and staff scheduling, and vehicle routing are all key to profitability
for logistics companies such as UPS and FedEx.
•While supply chain analytics has historically focused almost exclusively on efficiency, the supply chain
problems caused by the COVID-19 pandemic and world conflicts have expanded the use of analytics to
increase the resiliency of the supply chain.
•Monitoring and quantifying the riskiness of the supply chain and taking data-driven action to ensure
the supply chain can support its mission over a robust set of scenarios has taken on new importance.
•Descriptive analytics is being used to more closely monitor supply chain performance, predictive
analytics quantifies risk, and prescriptive analytics is used with scenario analysis to prepare supply chain
solutions that can handle a high degree of disruption.
116.
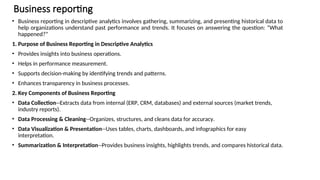
Business reporting
• Businessreporting in descriptive analytics involves gathering, summarizing, and presenting historical data to
help organizations understand past performance and trends. It focuses on answering the question: “What
happened?”
1. Purpose of Business Reporting in Descriptive Analytics
• Provides insights into business operations.
• Helps in performance measurement.
• Supports decision-making by identifying trends and patterns.
• Enhances transparency in business processes.
2. Key Components of Business Reporting
• Data Collection--Extracts data from internal (ERP, CRM, databases) and external sources (market trends,
industry reports).
• Data Processing & Cleaning--Organizes, structures, and cleans data for accuracy.
• Data Visualization & Presentation--Uses tables, charts, dashboards, and infographics for easy
interpretation.
• Summarization & Interpretation--Provides business insights, highlights trends, and compares historical data.
117.
3. Types ofBusiness Reports in Descriptive Analytics
Type Purpose Example
Operational Reports Monitor day-to-day activities Daily sales report of a retail store
Financial Reports Track financial performance
Profit & Loss statement, Balance
sheet
Marketing Reports Analyze campaign effectiveness Social media engagement analysis
HR Reports Workforce trends Employee turnover analysis
Customer Reports Understand customer behavior Customer purchase trends report
Compliance Reports Ensure regulatory adherence
Audit reports, Risk assessment
reports
118.
4. Tools Usedin Business Reporting
•Excel & Google Sheets – Basic reporting and data visualization.
•Power BI & Tableau – Interactive dashboards and reports.
•SQL & Python (Pandas, Matplotlib) – Data extraction and analysis.
•Google Analytics – Web traffic and customer insights.
•SAP & Oracle BI – Enterprise business intelligence tools.
5. Business Reporting Formats
•Tabular Reports – Present numerical data in tables (e.g., sales performance by region).
•Graphical Reports – Use visual aids (charts, graphs) to show trends (e.g., revenue growth over time).
•Dashboard Reports – Real-time, interactive reports with multiple data visualizations.
•Narrative Reports – Written summaries explaining key findings and trends.
119.
6. Challenges inBusiness Reporting
•Data inconsistencies and errors.
•Overwhelming amounts of data leading to information overload.
•Lack of integration between data sources.
•Data security and privacy concerns.
7. Best Practices for Effective Business Reporting
Define clear objectives and KPIs.
Ensure data accuracy and consistency.
Use visual storytelling for better insights.
Automate reporting to improve efficiency.
Focus on actionable insights rather than just presenting data.
126.
Case Study: DescriptiveAnalytics
Case Background
ABC Retail is a mid-sized chain of stores specializing in fashion apparel. Over the past year, the company
has faced declining sales and increasing competition from online retailers. The management wants to
understand past sales trends, customer purchasing behavior, and product performance across various
locations to make better business decisions.
Problem Statement
ABC Retail lacks clear insights into which products are performing well, which stores are
underperforming, and what customer segments drive sales. The company seeks to use descriptive
analytics to summarize historical data and identify patterns that can guide future strategies.
127.
Solution to theProblem Statement
ABC Retail can leverage Descriptive Analytics to gain clear insights into product performance, store performance, and customer
purchasing behavior. By analyzing historical data, the company can achieve the following:
1.Identify High and Low-Performing Products:Analyze past sales data to determine which products sell well and which do not.
Categorize products based on sales volume, profit margins, and return rates. Adjust inventory levels to stock more of popular
products and reduce slow-moving items.
2.Assess Store Performance: Compare sales across different locations to identify underperforming stores.Analyze store foot traffic
and revenue to determine possible reasons for performance gaps.Implement strategies such as localized promotions, improved
store layouts, or product realignment for struggling stores.
3.Understand Customer Segments Driving Sales:Use customer transaction data to segment buyers based on demographics,
purchase frequency, and spending habits.Identify high-value customers and tailor marketing efforts to increase their engagement.
Offer personalized promotions or loyalty programs to enhance customer retention.
4.Detect Sales Patterns and Trends:Examine seasonality effects to optimize inventory planning and marketing strategies.Identify
trends in customer preferences to guide future product development and purchasing decisions. Compare past promotional
campaigns to determine the most effective strategies for boosting sales.
By implementing these insights, ABC Retail can make data-driven decisions to improve sales, optimize product assortment,
enhance store performance, and target the right customer segments effectively.