Downloaded 26 times


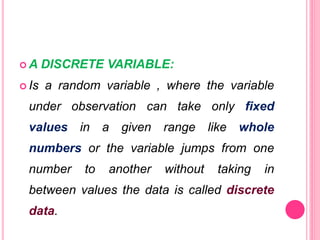

![ORDINAL SCALE…CONT..
Individuals may be classified according to socio
economic status as Low,medium,high.
Examples:
Disease state of cancer [stage1 , stage 2,…]
Tooth mobility
Silness- loe gingival index
Millers classification of root exposure.](https://image.slidesharecdn.com/data1516-9-14-160223073714/85/Data-in-Research-33-320.jpg)
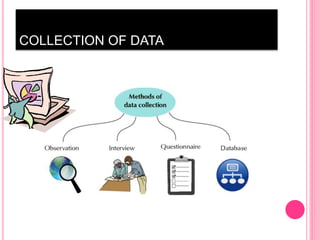
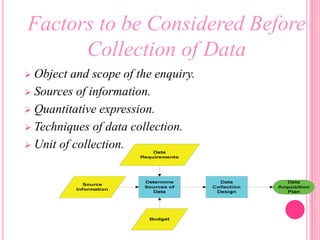
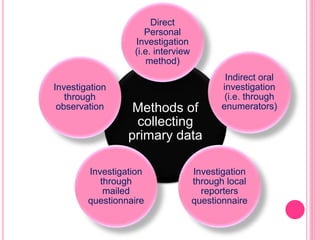
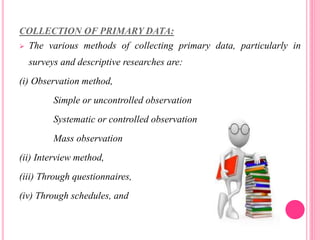
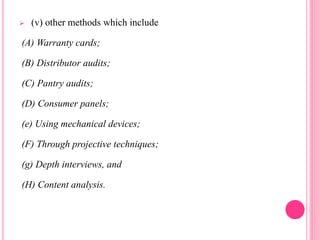
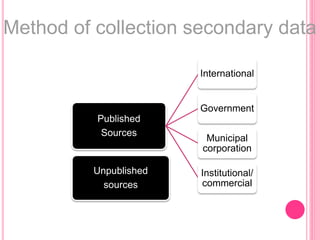
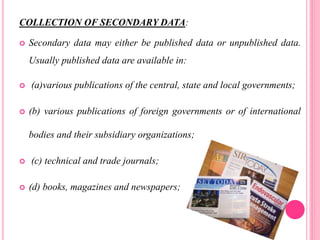


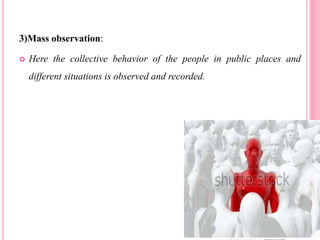


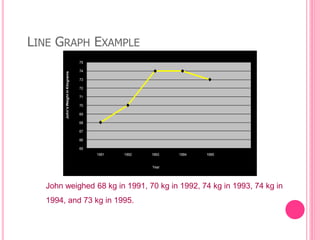


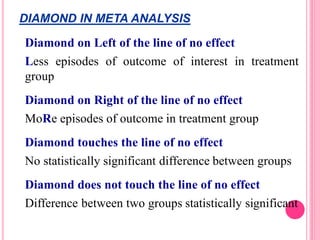


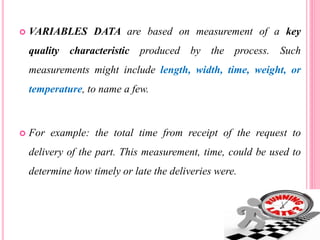
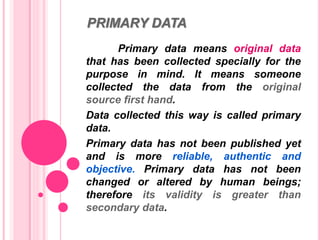
This document discusses data in research methodology. It covers different types of data including qualitative and quantitative data. It describes various methods of collecting primary data such as observation, interviews, questionnaires, and schedules. It also discusses methods of collecting secondary data from published and unpublished sources. The importance of data collection in research is explained as well as factors to consider such as the object and scope of inquiry. Measurement scales including nominal, ordinal, interval, and ratio scales are outlined.


![FBS 719 and FBS 819 BIOSTATISTICS [Autosaved].pptx](https://cdn.slidesharecdn.com/ss_thumbnails/fbs719andfbs819biostatisticsautosaved-240713084256-92f19157-thumbnail.jpg?width=640&height=640&fit=bounds)


