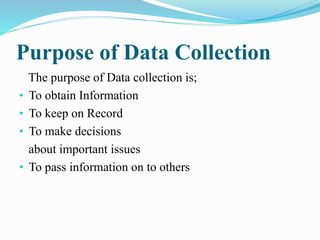
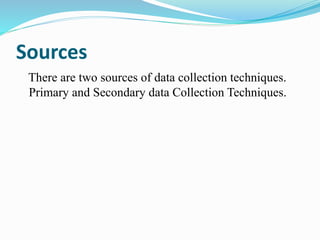
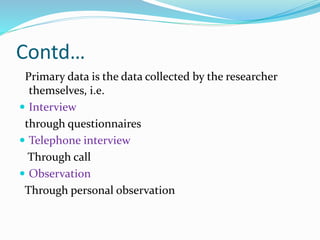
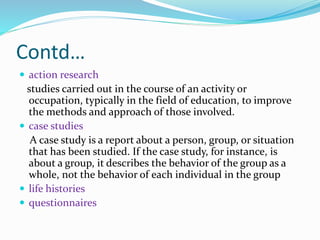
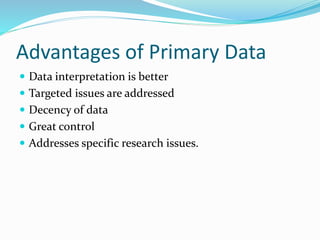
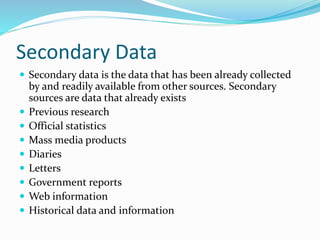
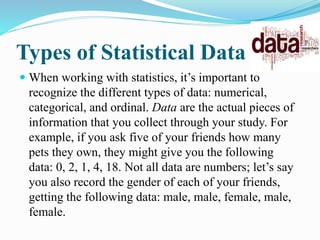
Iqbal hussain veer
DATA AND ITS TYPES
Data and its Sources
Data can be defined as the qualitative or quantitative
values of a variable. Data is plural of datum which
means to give or something given. Data can be
numbers , images , words ,figures , facts or ideas. Data
in itself cannot be understood and to get information
from the data one must interpret it into meaningful
information. There are various methods of
interpreting data.
Purpose of Data Collection
The purpose of Data collection is;
• To obtain Information
• To keep on Record
• To make decisions
about important issues
• To pass information on to others
Sources
There are two sources of data collection techniques.
Primary and Secondary data Collection Techniques.
Primary Data
Primary Data means original data that has been
collected specially for the purpose in mind. It means
someone collected the data from the original source
first hand. Primary data are generally afresh and
collected for the first time.
Contd…
Primary data is the data collected by the researcher
themselves, i.e.
 Interview
through questionnaires
 Telephone interview
Through call
 Observation
Through personal observation
Contd…
 action research
studies carried out in the course of an activity or
occupation, typically in the field of education, to improve
the methods and approach of those involved.
 case studies
A case study is a report about a person, group, or situation
that has been studied. If the case study, for instance, is
about a group, it describes the behavior of the group as a
whole, not the behavior of each individual in the group
 life histories
 questionnaires
Advantages of Primary Data
 Data interpretation is better
 Targeted issues are addressed
 Decency of data
 Great control
 Addresses specific research issues.
Disadvantages of Primary Data
 High cost
 Time consuming
 Inaccurate feedbacks
 More number of resources is required.
Secondary Data
 Secondary data is the data that has been already collected
by and readily available from other sources. Secondary
sources are data that already exists
 Previous research
 Official statistics
 Mass media products
 Diaries
 Letters
 Government reports
 Web information
 Historical data and information
Advantages
 Cheap
 Easily available
 Time saving
 Will give alternative methods for research
Disadvantages
 Incomplete information
 Data biasness
 Cannot address research problems
Types of Statistical Data
 When working with statistics, it’s important to
recognize the different types of data: numerical,
categorical, and ordinal. Data are the actual pieces of
information that you collect through your study. For
example, if you ask five of your friends how many
pets they own, they might give you the following
data: 0, 2, 1, 4, 18. Not all data are numbers; let’s say
you also record the gender of each of your friends,
getting the following data: male, male, female, male,
female.
Numerical Data
Most data fall into one of two groups: numerical or
categorical.
These data have meaning as a measurement, such as a
person’s height, weight, IQ, or blood pressure; or
they’re a count, such as the number of stock shares a
person owns, how many teeth a dog has, or how many
pages you can read of your favorite book before you fall
asleep.
Numerical Data Contd..
 Numerical data can be further broken into two types:
discrete and continuous.
 Discrete data represent items that can be counted; they
take on possible values that can be listed out. The list of
possible values may be fixed (also called finite); or it may go
from 0, 1, 2, on to infinity (making it countably infinite).
For example, the number of heads in 100 coin flips takes on
values from 0 through 100 (finite case), but the number of
flips needed to get 100 heads takes on values from 100 (the
fastest scenario) on up to infinity (if you never get to that
100th heads). Its possible values are listed as 100, 101, 102,
103, . . . (representing the countably infinite case).
 Continuous data represent measurements; their
possible values cannot be counted and can only be
described using intervals on the real number line. For
example, The amount of rain in inches that falls in
randomly selected storm ,human hair,etc
Categorical Data
Categorical data represent characteristics such as a
person’s gender, marital status, hometown, or the
types of movies they like. Categorical data can take on
numerical values (such as “1” indicating male and “2”
indicating female), but those numbers don’t have
mathematical meaning. You couldn’t add them
together, for example. (Other names for categorical
data are qualitative data, or Yes/No data.)

Lecture 1

  • 1.
  • 2.
    Data and itsSources Data can be defined as the qualitative or quantitative values of a variable. Data is plural of datum which means to give or something given. Data can be numbers , images , words ,figures , facts or ideas. Data in itself cannot be understood and to get information from the data one must interpret it into meaningful information. There are various methods of interpreting data.
  • 3.
    Purpose of DataCollection The purpose of Data collection is; • To obtain Information • To keep on Record • To make decisions about important issues • To pass information on to others
  • 4.
    Sources There are twosources of data collection techniques. Primary and Secondary data Collection Techniques.
  • 5.
    Primary Data Primary Datameans original data that has been collected specially for the purpose in mind. It means someone collected the data from the original source first hand. Primary data are generally afresh and collected for the first time.
  • 6.
    Contd… Primary data isthe data collected by the researcher themselves, i.e.  Interview through questionnaires  Telephone interview Through call  Observation Through personal observation
  • 7.
    Contd…  action research studiescarried out in the course of an activity or occupation, typically in the field of education, to improve the methods and approach of those involved.  case studies A case study is a report about a person, group, or situation that has been studied. If the case study, for instance, is about a group, it describes the behavior of the group as a whole, not the behavior of each individual in the group  life histories  questionnaires
  • 8.
    Advantages of PrimaryData  Data interpretation is better  Targeted issues are addressed  Decency of data  Great control  Addresses specific research issues.
  • 9.
    Disadvantages of PrimaryData  High cost  Time consuming  Inaccurate feedbacks  More number of resources is required.
  • 10.
    Secondary Data  Secondarydata is the data that has been already collected by and readily available from other sources. Secondary sources are data that already exists  Previous research  Official statistics  Mass media products  Diaries  Letters  Government reports  Web information  Historical data and information
  • 11.
    Advantages  Cheap  Easilyavailable  Time saving  Will give alternative methods for research
  • 12.
    Disadvantages  Incomplete information Data biasness  Cannot address research problems
  • 13.
    Types of StatisticalData  When working with statistics, it’s important to recognize the different types of data: numerical, categorical, and ordinal. Data are the actual pieces of information that you collect through your study. For example, if you ask five of your friends how many pets they own, they might give you the following data: 0, 2, 1, 4, 18. Not all data are numbers; let’s say you also record the gender of each of your friends, getting the following data: male, male, female, male, female.
  • 14.
    Numerical Data Most datafall into one of two groups: numerical or categorical. These data have meaning as a measurement, such as a person’s height, weight, IQ, or blood pressure; or they’re a count, such as the number of stock shares a person owns, how many teeth a dog has, or how many pages you can read of your favorite book before you fall asleep.
  • 15.
    Numerical Data Contd.. Numerical data can be further broken into two types: discrete and continuous.  Discrete data represent items that can be counted; they take on possible values that can be listed out. The list of possible values may be fixed (also called finite); or it may go from 0, 1, 2, on to infinity (making it countably infinite). For example, the number of heads in 100 coin flips takes on values from 0 through 100 (finite case), but the number of flips needed to get 100 heads takes on values from 100 (the fastest scenario) on up to infinity (if you never get to that 100th heads). Its possible values are listed as 100, 101, 102, 103, . . . (representing the countably infinite case).
  • 16.
     Continuous datarepresent measurements; their possible values cannot be counted and can only be described using intervals on the real number line. For example, The amount of rain in inches that falls in randomly selected storm ,human hair,etc
  • 17.
    Categorical Data Categorical datarepresent characteristics such as a person’s gender, marital status, hometown, or the types of movies they like. Categorical data can take on numerical values (such as “1” indicating male and “2” indicating female), but those numbers don’t have mathematical meaning. You couldn’t add them together, for example. (Other names for categorical data are qualitative data, or Yes/No data.)