Statistics are Tools!
     Statistics – techniques for organizing,
     summarizing, and interpreting data
     Which “tool” you choose depends on:
        What you want to know
        What type of data you have
        What kind of research design you used


                                                1
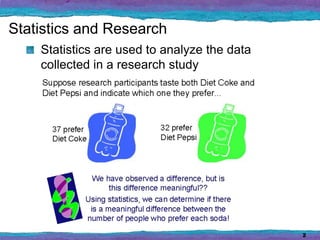
Statistics and Research
    Statistics are used to analyze the data
    collected in a research study


                                              2
Descriptive Statistics
      Techniques to organize, display, and describe
      data using tables, graphs, and summary
      measures.


   Number Letter % of
   Grade  Grade Class
    90s     A    16
    80s     B    44
    70s     C    28
    60s     D    12
                 100

                                                      3
Inferential Statistics
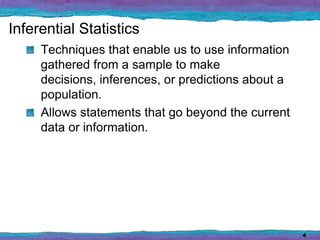
     Techniques that enable us to use information
     gathered from a sample to make
     decisions, inferences, or predictions about a
     population.
     Allows statements that go beyond the current
     data or information.


                                                     4
Examples of Inferential Statistics
     TV networks monitor the popularity of their programs
     by hiring Nielsen and other organizations to sample
     the preferences of TV viewers.
     The accounting department of a large firm will select a
     sample of the invoices to check for accuracy for all the
     invoices of the company.
     Pre-election polling techniques used to predict election
     results
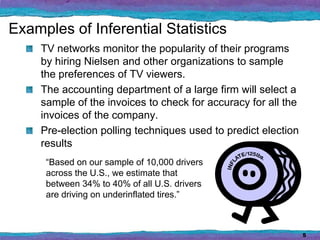
      “Based on our sample of 10,000 drivers
      across the U.S., we estimate that
      between 34% to 40% of all U.S. drivers
      are driving on underinflated tires.”


                                                                5
Populations and Parameters
    Suppose a statistician wanted to know:
       Average gpa all students accepted to OLLU
       Gross sales at Church’s Fried Chicken stores this
       year in San Antonio
       Average customer satisfaction rating for all Target
       stores in San Antonio
    Population is all elements (can be people or
    things) whose characteristics are being
    studied. Also called the “target population.”
    A value (average, total, etc.) that is calculated
    from the entire population is called a
    parameter.
                                                             6
Samples and Statistics
    Recall that the statistician wants to know the
    average customer satisfaction rating for all
    Target stores in San Antonio.
       A survey is given to every 100th customer at 5
       randomly selected Target stores in S.A. during a
       three day period
    A sample is a subset of the population that is
    selected for study.
    A value that is calculated from a sample is
    called a statistic.


                                                          7