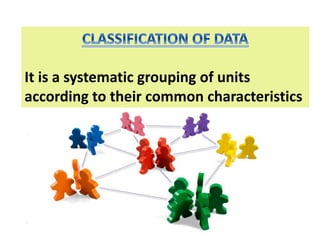
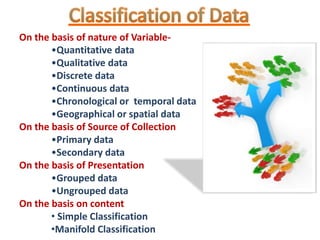
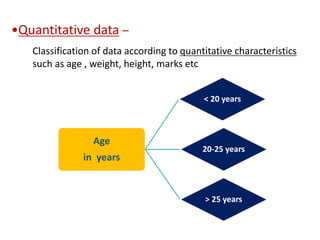
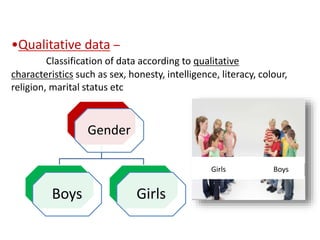
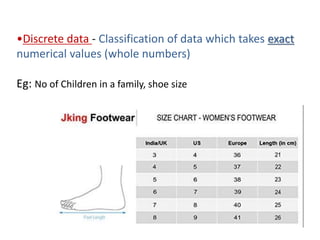
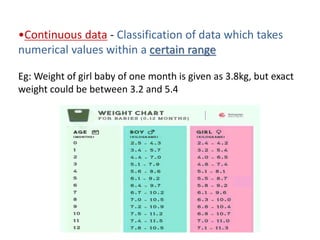
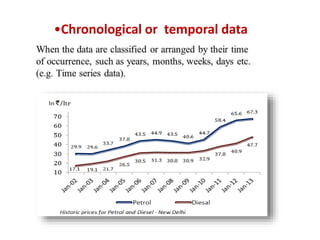
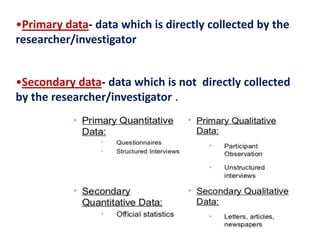
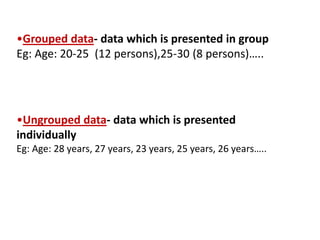
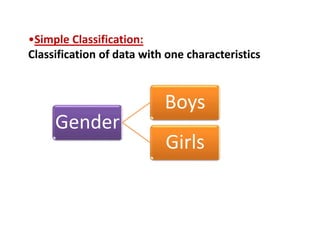
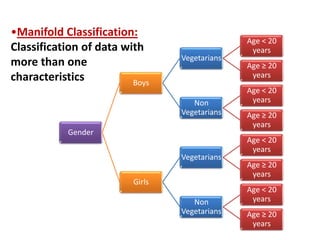
Mrs. Suja Santosh
Professor
RVS College of Nursing, Sulur,
Coimbatore
It is a systematic grouping of units
according to their common characteristics
• Simplifies and makes data more comprehensible
• Condense the data
• Brings out the points of similarity and dissimilarity
• Comparison of characteristics
• Brings out the cause and effect relationship
• Prepare the data for tabulation
On the basis of nature of Variable-
•Quantitative data
•Qualitative data
•Discrete data
•Continuous data
•Chronological or temporal data
•Geographical or spatial data
On the basis of Source of Collection
•Primary data
•Secondary data
On the basis of Presentation
•Grouped data
•Ungrouped data
On the basis on content
• Simple Classification
•Manifold Classification
•Quantitative data –
Age
in years
< 20 years
20-25 years
> 25 years
Classification of data according to quantitative characteristics
such as age , weight, height, marks etc
•Qualitative data –
Classification of data according to qualitative
characteristics such as sex, honesty, intelligence, literacy, colour,
religion, marital status etc
Gender
Boys Girls
Girls Boys
•Discrete data - Classification of data which takes exact
numerical values (whole numbers)
Eg: No of Children in a family, shoe size
•Continuous data - Classification of data which takes
numerical values within a certain range
Eg: Weight of girl baby of one month is given as 3.8kg, but exact
weight could be between 3.2 and 5.4
•Chronological or temporal data
•Geographical or spatial data
•Primary data- data which is directly collected by the
researcher/investigator
•Secondary data- data which is not directly collected
by the researcher/investigator .
•Grouped data- data which is presented in group
Eg: Age: 20-25 (12 persons),25-30 (8 persons)…..
•Ungrouped data- data which is presented
individually
Eg: Age: 28 years, 27 years, 23 years, 25 years, 26 years…..
•Simple Classification:
Classification of data with one characteristics
Gender
Boys
Girls
Gender
Boys
Vegetarians
Age < 20
years
Age ≥ 20
years
Non
Vegetarians
Age < 20
years
Age ≥ 20
years
Girls
Vegetarians
Age < 20
years
Age ≥ 20
years
Non
Vegetarians
Age < 20
years
Age ≥ 20
years
•Manifold Classification:
Classification of data with
more than one
characteristics
Classification of data

Classification of data

  • 1.
    Mrs. Suja Santosh Professor RVSCollege of Nursing, Sulur, Coimbatore
  • 2.
    It is asystematic grouping of units according to their common characteristics
  • 3.
    • Simplifies andmakes data more comprehensible • Condense the data • Brings out the points of similarity and dissimilarity • Comparison of characteristics • Brings out the cause and effect relationship • Prepare the data for tabulation
  • 4.
    On the basisof nature of Variable- •Quantitative data •Qualitative data •Discrete data •Continuous data •Chronological or temporal data •Geographical or spatial data On the basis of Source of Collection •Primary data •Secondary data On the basis of Presentation •Grouped data •Ungrouped data On the basis on content • Simple Classification •Manifold Classification
  • 5.
    •Quantitative data – Age inyears < 20 years 20-25 years > 25 years Classification of data according to quantitative characteristics such as age , weight, height, marks etc
  • 6.
    •Qualitative data – Classificationof data according to qualitative characteristics such as sex, honesty, intelligence, literacy, colour, religion, marital status etc Gender Boys Girls Girls Boys
  • 7.
    •Discrete data -Classification of data which takes exact numerical values (whole numbers) Eg: No of Children in a family, shoe size
  • 8.
    •Continuous data -Classification of data which takes numerical values within a certain range Eg: Weight of girl baby of one month is given as 3.8kg, but exact weight could be between 3.2 and 5.4
  • 9.
  • 10.
  • 11.
    •Primary data- datawhich is directly collected by the researcher/investigator •Secondary data- data which is not directly collected by the researcher/investigator .
  • 12.
    •Grouped data- datawhich is presented in group Eg: Age: 20-25 (12 persons),25-30 (8 persons)….. •Ungrouped data- data which is presented individually Eg: Age: 28 years, 27 years, 23 years, 25 years, 26 years…..
  • 13.
    •Simple Classification: Classification ofdata with one characteristics Gender Boys Girls
  • 14.
    Gender Boys Vegetarians Age < 20 years Age≥ 20 years Non Vegetarians Age < 20 years Age ≥ 20 years Girls Vegetarians Age < 20 years Age ≥ 20 years Non Vegetarians Age < 20 years Age ≥ 20 years •Manifold Classification: Classification of data with more than one characteristics