Downloaded 226 times


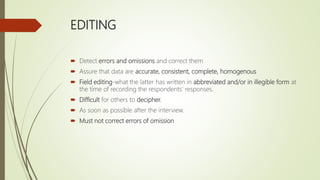


This document discusses data collection, tabulation, processing, and analysis. It begins by outlining the need for data collection to support scientific research and problem solving. It then describes various methods of data collection including warranty cards, audits, and mechanical devices. The document emphasizes the importance of processing and analyzing raw data to make it meaningful and test hypotheses. It outlines steps in processing like editing, coding, classification, and tabulation. Finally, it discusses various statistical analysis techniques including measures of central tendency, frequency distributions, correlation, regression, and parametric and non-parametric tests.