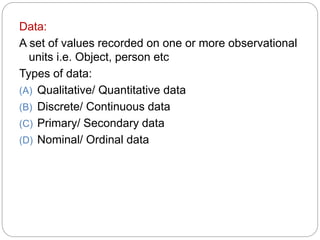
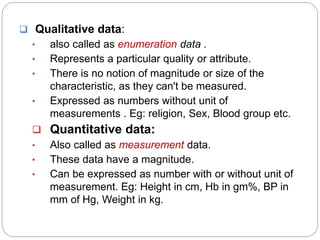
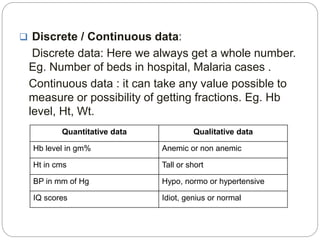
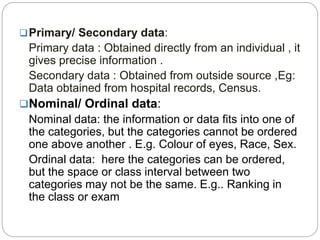
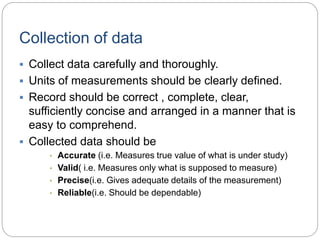
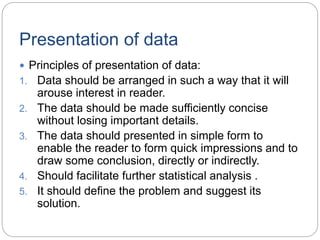
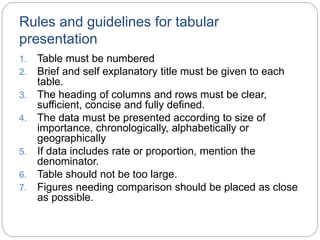
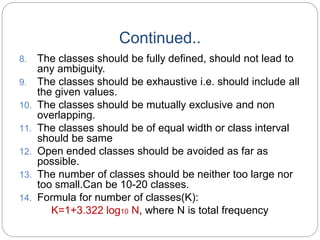
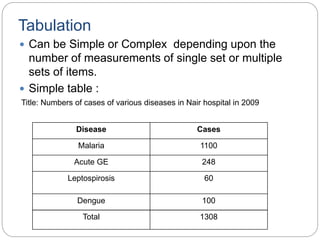
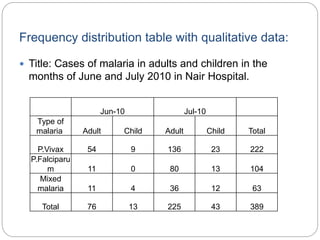
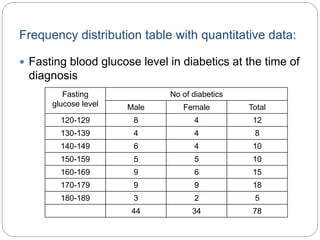
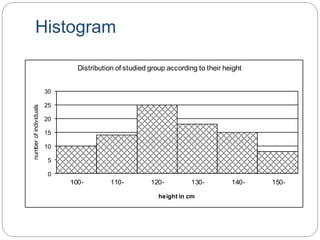
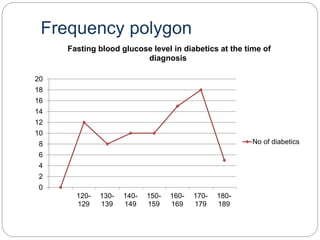
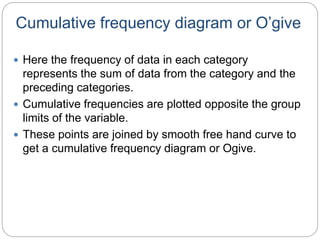
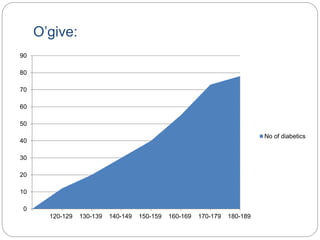
This document discusses different types of data and methods for presenting data. It describes qualitative and quantitative data, discrete and continuous data, and primary and secondary data. It also covers nominal and ordinal data. Common methods for presenting data include tabulation and various charts or diagrams. Tabulation involves organizing data into tables, following specific rules. Charts allow visualization of data and include bar charts, histograms, frequency polygons, cumulative frequency diagrams, scatter diagrams, line diagrams, and pie charts. Each chart has specific purposes and guidelines for effective presentation of data.