BASIC 
STATISTICS 
TYPES OF DATA 
DR. FARHANA SHAHEEN
SYLLABUS 
FOR Wk-1 
Statistics 
Definition 
Population and Sample 
Data Types 
- Quantitative Data 
- Qualitative Data 
Stem and Leaf diagram 
Line Charts and Scatter Diagrams
Week-II 
Describing Data and Measurement 
- Measure of Center and Location 
a. Population Mean 
b. Sample Mean 
c. Median 
Examples 
d. Mode 
Examples 
Bar Charts 
Pie Charts
What is Statistics? 
Statistics : 
Definition. A collection of tools and techniques that are used 
to convert data into meaningful information. 
Statistics is the study of collecting, organizing and 
summarizing data, used to convert data into a meaningful 
information.
What does a statistician do? 
• Collects numbers or data 
• Systematically organizes or arranges the data 
• Analyzes the data…extracts relevant information to 
provide a complete numerical description 
• Infers general conclusions about the problem using this 
numerical description
Population: 
Population: is the universal set of all objects under 
study. 
A population is any entire collection of people, animals, 
plants or things from which we may collect data. It is 
the entire group we are interested in, which we wish to 
describe or draw conclusions about. 
For example: 
Students of YUC 
People living in Saudia 
Bulbs made in a factory 
Different models of cell phones
Population 
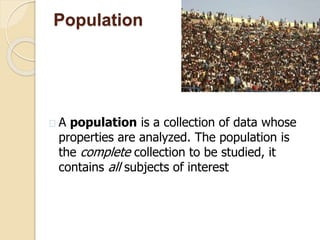
A population is a collection of data whose 
properties are analyzed. The population is 
the complete collection to be studied, it 
contains all subjects of interest
Sample: (Subset of the Population) 
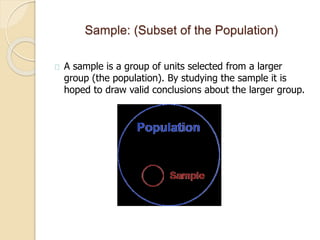
A sample is a group of units selected from a larger 
group (the population). By studying the sample it is 
hoped to draw valid conclusions about the larger group.
Populations and Samples 
Population 
The term "population" is used in statistics to represent all possible 
measurements or outcomes that are of interest to us in a particular 
study." 
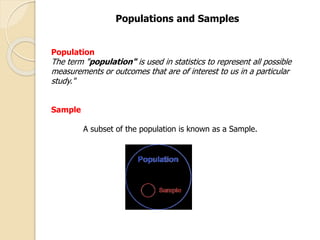
Sample 
A subset of the population is known as a Sample.
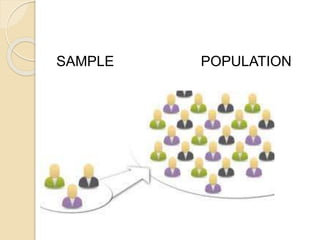
SAMPLE POPULATION
SAMPLE SIZE 
Sample size is the number of 
observations used for calculating 
estimates of a given population. 
For example, if we interviewed 30 
random students at a given high 
school to see if they liked a certain 
movie star, "30 students" would be our 
sample size. 
All students in the school is 
Population.
Examples: 
1. You want to know the average height of men 
aged 15-30 
Population: Everyone in that age range 
Sample: selections made from the population 
2. The population for a study of infant health for 
all Children born in 1980. 
The sample might be all babies born on 7th May 
in any of the years 
There are also various ways in selecting the 
sample.
3. Population: All Saudis who played 
soccer during the last year. 
Sample: Random number and 
samples of those people selected.
Data : A collection of facts or information. 
Examples: 
Restaurants in Saudi 
Arabia. 
Types of Cars 
Heights of all students in 
your class 
Age of all students in 
YUC
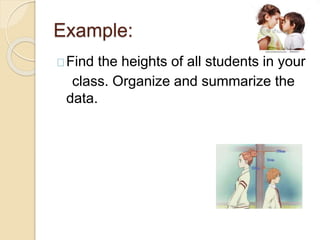
Example: 
Find the heights of all students in your 
class. Organize and summarize the 
data.
Statistic in real life? 
How many of you like Albaik, 
KFC, McDonalds, or Pizza 
hut? 
Albaik 32% 
KFC 36% 
McDonalds 11% 
All 21%
DIFFERENT TYPES OF 
DATA: 
1. Primary Data 
2. Secondary Data 
3. Qualitative Data 
4. Quantitative Data
Primary and Secondary Data 
Data can be classified as either Primary 
or Secondary. 
Primary Data: 
Primary data means original data that 
has been collected specially for the 
purpose in mind. It means when an 
authorized organization, investigator or 
an enumerator collects the data for the 
first time from the original source. Data 
collected this way is called primary data. 
For example: Your own questionnaire, 
survey, information.
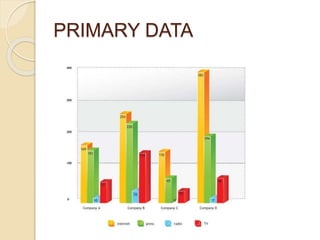
PRIMARY DATA
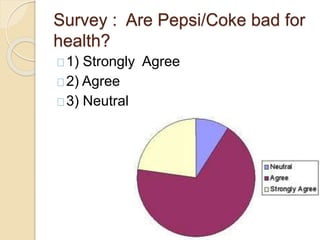
Survey : Are Pepsi/Coke bad for 
health? 
1) Strongly Agree 
2) Agree 
3) Neutral
Secondary Data: 
Secondary data is data that has been 
collected for another purpose. When we 
use Statistical Method with Primary Data 
from another purpose for our purpose we 
refer to it as Secondary Data. It means 
that one purpose's Primary Data is 
another purpose's Secondary Data. 
Secondary data is data that is being 
reused. Usually in a different context. 
For example: Data from a Book, 
Newspaper, Magazine, or Internet.
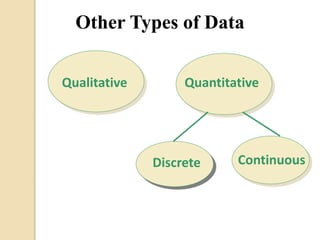
Other Types of Data 
Qualitative Quantitative 
Discrete Continuous
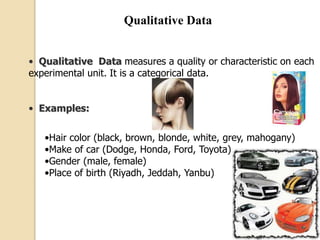
Qualitative Data 
• Qualitative Data measures a quality or characteristic on each 
experimental unit. It is a categorical data. 
• Examples: 
•Hair color (black, brown, blonde, white, grey, mahogany) 
•Make of car (Dodge, Honda, Ford, Toyota) 
•Gender (male, female) 
•Place of birth (Riyadh, Jeddah, Yanbu)
Quantitative Data 
Quantitative data is a numerical measurement 
expressed in terms of numbers. 
For example: Temperature= “26 degrees" 
Height = "1.8 meters" 
Length = “2.5 feet” 
Age = “9 years” 
Note: Quantitative data always are associated with 
a scale measure (degree/feet/years).
•Quantitative Data measure a numerical 
quantity on each experimental unit. 
Examples 
• For each orange tree, the number of oranges 
is measured. 
– Quantitative 
• For a particular day, the number of cars 
entering a college campus is measured. 
– Quantitative 
• Time until a light bulb burns out (4 months) 
– Quantitative
Qualitative vs Quantitative 
Data 
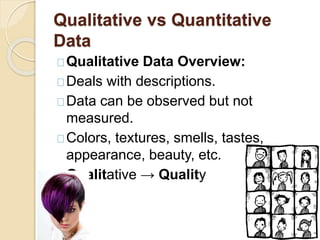
Qualitative Data Overview: 
Deals with descriptions. 
Data can be observed but not 
measured. 
Colors, textures, smells, tastes, 
appearance, beauty, etc. 
Qualitative → Quality
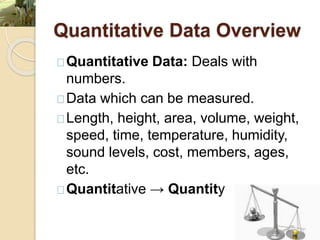
Quantitative Data Overview 
Quantitative Data: Deals with 
numbers. 
Data which can be measured. 
Length, height, area, volume, weight, 
speed, time, temperature, humidity, 
sound levels, cost, members, ages, 
etc. 
Quantitative → Quantity
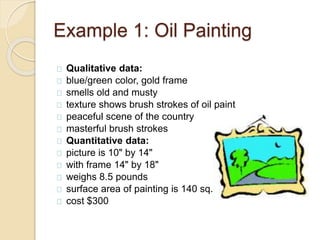
Example 1: Oil Painting 
Qualitative data: 
blue/green color, gold frame 
smells old and musty 
texture shows brush strokes of oil paint 
peaceful scene of the country 
masterful brush strokes 
Quantitative data: 
picture is 10" by 14" 
with frame 14" by 18" 
weighs 8.5 pounds 
surface area of painting is 140 sq. in. 
cost $300
Example 2: Coffee Latte 
Qualitative data: 
robust aroma 
frothy appearance 
strong taste 
burgundy cup 
Quantitative data: 
12 ounces of latte 
serving temperature 150º F. 
serving cup 7 inches in height 
cost $4.95
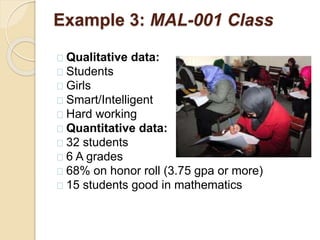
Example 3: MAL-001 Class 
Qualitative data: 
Students 
Girls 
Smart/Intelligent 
Hard working 
Quantitative data: 
32 students 
6 A grades 
68% on honor roll (3.75 gpa or more) 
15 students good in mathematics
Discrete and Continuous Data 
There are two types of Quantitative Data: 
1. Discrete (in whole numbers) 
Exp: Number of Questions in Exam 5, 7, 14 
Number of cars, 
Number of students 3000 
2. Continuous (in decimal points) 
Exp: Temperature of Yanbu on Sunday 26.5 
degrees 
Your Height 5.3” 
Your Weight 120.5 lbs 
Shoe size 7.5
Discrete and Continuous Data 
Discrete data usually occurs in a case 
where there are only a certain number of 
values, or when we are counting 
something (using whole numbers). 
Continuous data makes up the rest of 
numerical data. This is a type of data 
that is usually associated with some sort 
of physical measurement (like 
feet/inches/kilogram).
Question: 
Check for Discrete or 
Continuous: 
Your phone number 
Height of a tree 
Id number 
Length of a skirt 
The number of goals scored by a 
hockey team 
The number of subjects your school 
offered 
Shoe size
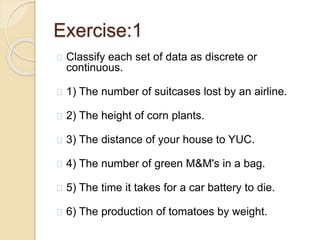
Exercise:1 
Classify each set of data as discrete or 
continuous. 
1) The number of suitcases lost by an airline. 
2) The height of corn plants. 
3) The distance of your house to YUC. 
4) The number of green M&M's in a bag. 
5) The time it takes for a car battery to die. 
6) The production of tomatoes by weight.
Exercise-2 
Identify each of the following variables as qualitative 
or quantitative, if quantitative is it discrete or 
continuous? 
•Weight of two dozen shrimps. 
________________________ 
•A person’s body temperature. 
_________________________ 
•Rating of a newly-hired lecturer in the University 
(excellent, good, fair, poor)._____________________ 
•Number of people waiting for treatment at a hospital 
emergency room.________________________