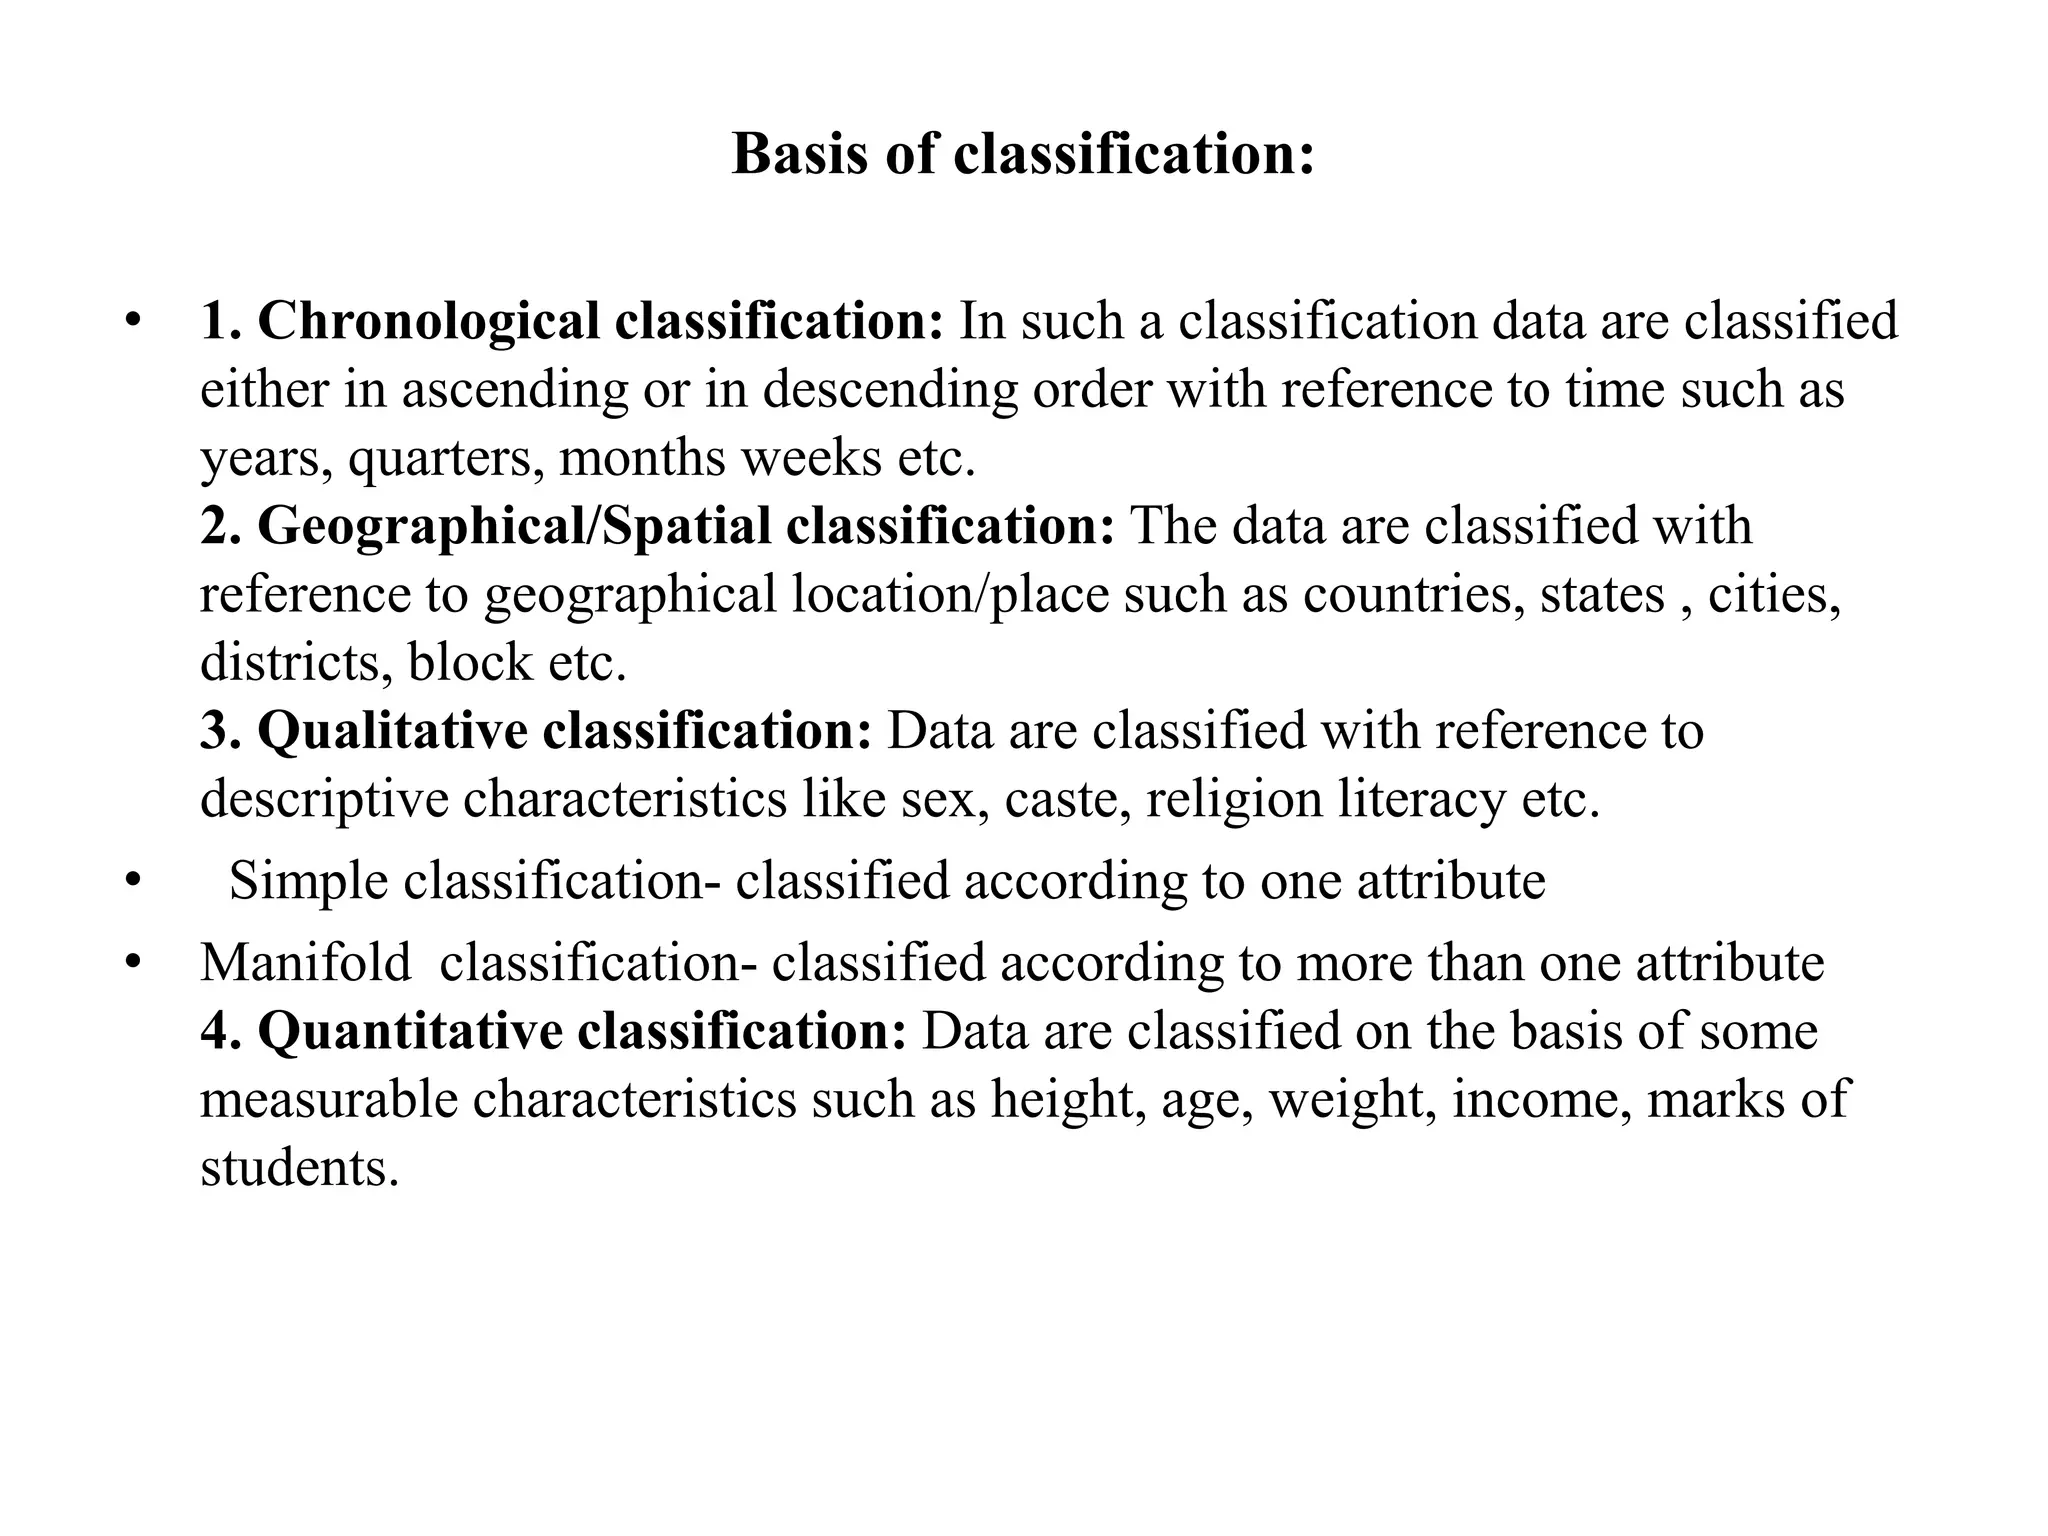
Unit III
Organization of data
Mrs. Sonam Omar
PGT Economics
JNV Ballia
• Organization of data refers to the systematic arrangement of collected
figures (raw data), so that the data becomes easy to understand and more
convenient for further statistical treatment .
• Classification is the process of arranging data into sequences and groups
according to their common characteristics or separating them in to different
but related parts.
• Raw data -A mass of data in its original form is called raw data. It is an
unorganized mass of various items.
Objectives of classification
• To simplify and condense the mass of data
• To explain similarity and dissimilarity of data
• To facilitate comparison
• To study the relationships
• To prepare the data for tabulation
Characteristic of a Good Classification
• Comprehensiveness
• Clarity
• Homogeneity
• Suitability
• Stability
• Elastic
Basis of classification:
• 1. Chronological classification: In such a classification data are classified
either in ascending or in descending order with reference to time such as
years, quarters, months weeks etc.
2. Geographical/Spatial classification: The data are classified with
reference to geographical location/place such as countries, states , cities,
districts, block etc.
3. Qualitative classification: Data are classified with reference to
descriptive characteristics like sex, caste, religion literacy etc.
• Simple classification- classified according to one attribute
• Manifold classification- classified according to more than one attribute
4. Quantitative classification: Data are classified on the basis of some
measurable characteristics such as height, age, weight, income, marks of
students.
Variable
• A variable is a characteristic which is capable of being measured and
capable of change in its value from time to time.
• It is of two types.
(a) Discrete
(b) Continuous
• Discrete: Discrete variable are those variables that increase in jumps or in
complete numbers and are not fractional. Ex.-number of student in a class
could be 2, 4, 10, 15,, 20, 25, etc. It does not take any fractional value
between them.
• Continuous variable: Continuous variables are those variables that can
takes any value i.e. integral value or fractional value in a specified interval.
Ex- Wages of workers in a factory.
Basic terms
• A frequency distribution is a comprehensive way to classify raw data of a
quantitative variable. It shows how different values of a variable is
distributed in different classes along with their corresponding class
frequencies.
• The class mid-point or class mark is the middle value of a class. It lies
halfway between the lower class limit and the upper class limit of a class
and can be ascertained in the following manner.
• Class mid-point = upper class limit + lower class limit / 2.
• Class frequency: It means the number of values in a particular class.
Class width or class interval:- It is the difference between the upper class
limit and lower class limit
• Class width = upper class Limit – Lower class Limit
• Class Limits:- There are two ends of a class. The lowest value is called
lower class limit and highest value is called upper class limit.
Types of Series
• Types of series
1. Individual series
2. Discrete series Or frequency array
3.Frequency distribution or continuous series
• Individual series are those series in which the items are listed singly.
Marks distribution of 5 students- 12, 15 , 17, 15, 12
• A discrete series or frequency array is that series in which data are
prescribed in a way that exact measurements of items are clearly shown.
Cont.
• A continuous series: It is that series in which items cannot be exactly
measured. The items assume a range of values and are placed within the
range of limits. In other words, data are classified into different classes with
a range, the range is called class-intervals.
• Types of continuous series-
 Exclusive series --- 10-20 20-30 30-40
 Inclusive series----- 10-19 20-29 10-19
 Open ended distribution below 20 , 20-30 , 30-40, above40
 Cumulative frequency series(less than and more than series)
 Equal and unequal class- interval series
 Mid value series
The difference between Univariate and Bivariate Frequency distribution
• Univariate frequency distribution.--When data is classified on the basis
of single variable, the distribution is known as univariate frequency
distribution.
Ex. Height of students in a class
• Bivariate frequency distribution-- when data is classified on the basis of
two variables, the distribution is known as bivariate frequency distribution.
Ex. Height and weight of students in a class

Organisation of data

  • 1.
    Unit III Organization ofdata Mrs. Sonam Omar PGT Economics JNV Ballia
  • 2.
    • Organization ofdata refers to the systematic arrangement of collected figures (raw data), so that the data becomes easy to understand and more convenient for further statistical treatment . • Classification is the process of arranging data into sequences and groups according to their common characteristics or separating them in to different but related parts. • Raw data -A mass of data in its original form is called raw data. It is an unorganized mass of various items.
  • 3.
    Objectives of classification •To simplify and condense the mass of data • To explain similarity and dissimilarity of data • To facilitate comparison • To study the relationships • To prepare the data for tabulation
  • 4.
    Characteristic of aGood Classification • Comprehensiveness • Clarity • Homogeneity • Suitability • Stability • Elastic
  • 5.
    Basis of classification: •1. Chronological classification: In such a classification data are classified either in ascending or in descending order with reference to time such as years, quarters, months weeks etc. 2. Geographical/Spatial classification: The data are classified with reference to geographical location/place such as countries, states , cities, districts, block etc. 3. Qualitative classification: Data are classified with reference to descriptive characteristics like sex, caste, religion literacy etc. • Simple classification- classified according to one attribute • Manifold classification- classified according to more than one attribute 4. Quantitative classification: Data are classified on the basis of some measurable characteristics such as height, age, weight, income, marks of students.
  • 6.
    Variable • A variableis a characteristic which is capable of being measured and capable of change in its value from time to time. • It is of two types. (a) Discrete (b) Continuous • Discrete: Discrete variable are those variables that increase in jumps or in complete numbers and are not fractional. Ex.-number of student in a class could be 2, 4, 10, 15,, 20, 25, etc. It does not take any fractional value between them. • Continuous variable: Continuous variables are those variables that can takes any value i.e. integral value or fractional value in a specified interval. Ex- Wages of workers in a factory.
  • 7.
    Basic terms • Afrequency distribution is a comprehensive way to classify raw data of a quantitative variable. It shows how different values of a variable is distributed in different classes along with their corresponding class frequencies. • The class mid-point or class mark is the middle value of a class. It lies halfway between the lower class limit and the upper class limit of a class and can be ascertained in the following manner. • Class mid-point = upper class limit + lower class limit / 2. • Class frequency: It means the number of values in a particular class. Class width or class interval:- It is the difference between the upper class limit and lower class limit • Class width = upper class Limit – Lower class Limit • Class Limits:- There are two ends of a class. The lowest value is called lower class limit and highest value is called upper class limit.
  • 8.
    Types of Series •Types of series 1. Individual series 2. Discrete series Or frequency array 3.Frequency distribution or continuous series • Individual series are those series in which the items are listed singly. Marks distribution of 5 students- 12, 15 , 17, 15, 12 • A discrete series or frequency array is that series in which data are prescribed in a way that exact measurements of items are clearly shown.
  • 9.
    Cont. • A continuousseries: It is that series in which items cannot be exactly measured. The items assume a range of values and are placed within the range of limits. In other words, data are classified into different classes with a range, the range is called class-intervals. • Types of continuous series-  Exclusive series --- 10-20 20-30 30-40  Inclusive series----- 10-19 20-29 10-19  Open ended distribution below 20 , 20-30 , 30-40, above40  Cumulative frequency series(less than and more than series)  Equal and unequal class- interval series  Mid value series
  • 10.
    The difference betweenUnivariate and Bivariate Frequency distribution • Univariate frequency distribution.--When data is classified on the basis of single variable, the distribution is known as univariate frequency distribution. Ex. Height of students in a class • Bivariate frequency distribution-- when data is classified on the basis of two variables, the distribution is known as bivariate frequency distribution. Ex. Height and weight of students in a class