What is Statistics
•Statistics is a science that involves the use of numerical
data.
• It can be defined as “science of collecting, organizing,
presenting, analyzing, and interpreting numerical data to
help in process of making decisions
• The profession that involve statistics is called a “statistician”.
• Statistics use in marketing, accounting, quality control,
and others.
3.
Why study Statistics?
1.Data are everywhere
2. Statistical techniques are used to make many decisions
that affect our lives
3. No matter what your career, you will make
professional decisions that involve data. An
understanding of statistical methods will help you
make these decisions efectively
4.
Applications of statisticalconcepts
in the business world
• Finance – correlation and regression, index numbers,
time series analysis
• Marketing – hypothesis testing, chi-square tests,
nonparametric statistics
• Personel – hypothesis testing, chi-square tests,
nonparametric tests
• Operating management – hypothesis testing,
estimation, analysis of variance, time series analysis
5.
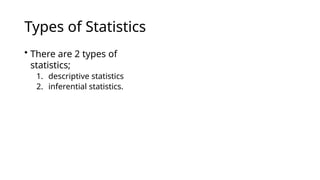
Types of Statistics
•There are 2 types of
statistics;
1. descriptive statistics
2. inferential statistics.
6.
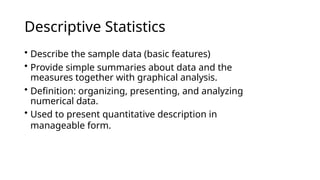
Descriptive Statistics
• Describethe sample data (basic features)
• Provide simple summaries about data and the
measures together with graphical analysis.
• Definition: organizing, presenting, and analyzing
numerical data.
• Used to present quantitative description in
manageable form.
7.
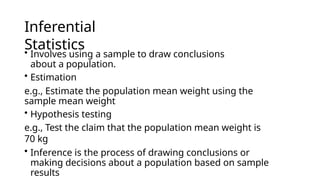
Inferential
Statistics
• Involves usinga sample to draw conclusions
about a population.
• Estimation
e.g., Estimate the population mean weight using the
sample mean weight
• Hypothesis testing
e.g., Test the claim that the population mean weight is
70 kg
• Inference is the process of drawing conclusions or
making decisions about a population based on sample
results
8.
Term in Statistics
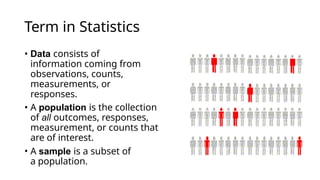
•Data consists of
information coming from
observations, counts,
measurements, or
responses.
• A population is the collection
of all outcomes, responses,
measurement, or counts that
are of interest.
• A sample is a subset of
a population.
9.
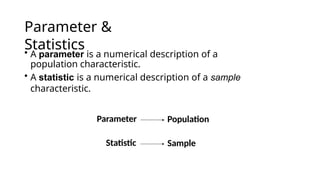
Parameter &
Statistics
• Aparameter is a numerical description of a
population characteristic.
• A statistic is a numerical description of a sample
characteristic.
Parameter Population
Statistic Sample
10.
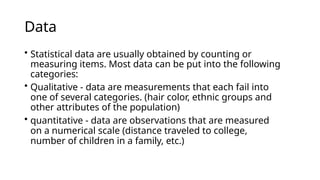
Data
• Statistical dataare usually obtained by counting or
measuring items. Most data can be put into the following
categories:
• Qualitative - data are measurements that each fail into
one of several categories. (hair color, ethnic groups and
other attributes of the population)
• quantitative - data are observations that are measured
on a numerical scale (distance traveled to college,
number of children in a family, etc.)
11.
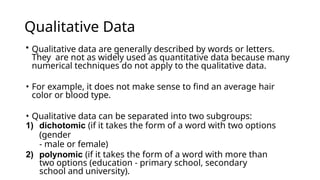
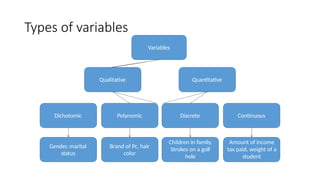
Qualitative Data
• Qualitativedata are generally described by words or letters.
They are not as widely used as quantitative data because many
numerical techniques do not apply to the qualitative data.
• For example, it does not make sense to find an average hair
color or blood type.
• Qualitative data can be separated into two subgroups:
1) dichotomic (if it takes the form of a word with two options
(gender
- male or female)
2) polynomic (if it takes the form of a word with more than
two options (education - primary school, secondary
school and university).
12.
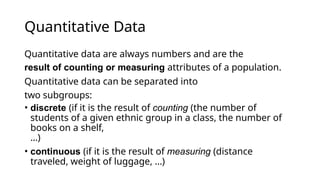
Quantitative Data
Quantitative dataare always numbers and are the
result of counting or measuring attributes of a population.
Quantitative data can be separated into
two subgroups:
• discrete (if it is the result of counting (the number of
students of a given ethnic group in a class, the number of
books on a shelf,
...)
• continuous (if it is the result of measuring (distance
traveled, weight of luggage, …)
13.
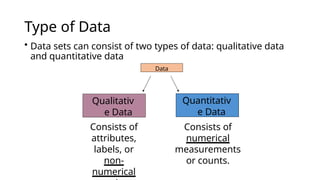
Type of Data
•Data sets can consist of two types of data: qualitative data
and quantitative data
Data
Qualitativ
e Data
Quantitativ
e Data
Consists of
attributes,
labels, or
non-
numerical
Consists of
numerical
measurements
or counts.
Level of Measurement
•The level of measurement determines which statistical
calculations are meaningful. The four levels of
measurement are: nominal, ordinal, interval, and ratio.
Nominal
Levels
of
Measurement
Ordinal
Interval
Ratio
Lowest to
highest
16.
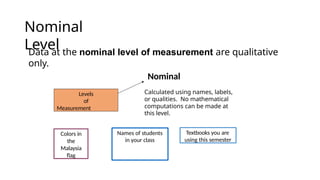
Nominal
Level
Data at thenominal level of measurement are qualitative
only.
Levels
of
Measurement
Nominal
Calculated using names, labels,
or qualities. No mathematical
computations can be made at
this level.
Colors in
the
Malaysia
flag
Names of students
in your class
Textbooks you are
using this semester
17.
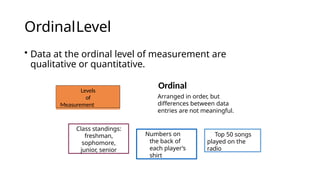
OrdinalLevel
• Data atthe ordinal level of measurement are
qualitative or quantitative.
Levels
of
Measurement
Class standings:
freshman,
sophomore,
junior, senior
Numbers on
the back of
each player’s
shirt
Ordinal
Arranged in order, but
differences between data
entries are not meaningful.
Top 50 songs
played on the
radio
18.
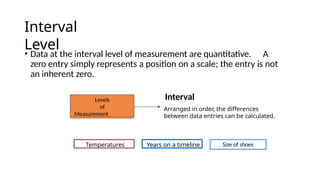
Interval
Level
• Data atthe interval level of measurement are quantitative. A
zero entry simply represents a position on a scale; the entry is not
an inherent zero.
Levels
of
Measurement
Temperatures Years on a timeline
Interval
Arranged in order, the differences
between data entries can be calculated.
Size of shoes
19.
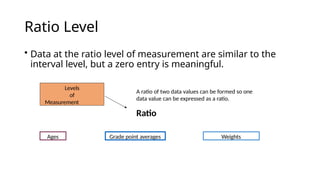
Ratio Level
• Dataat the ratio level of measurement are similar to the
interval level, but a zero entry is meaningful.
Levels
of
Measurement
A ratio of two data values can be formed so one
data value can be expressed as a ratio.
Ratio
Ages Grade point averages Weights
20.
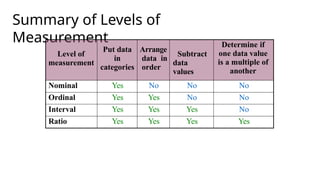
Summary of Levelsof
Measurement
Level of
measurement
Put data
in
categories
Arrange
data in
order
Subtract
data
values
Determine if
one data value
is a multiple of
another
Nominal Yes No No No
Ordinal Yes Yes No No
Interval Yes Yes Yes No
Ratio Yes Yes Yes Yes
Primary Data
• Specificinformation collected by the person who is doing
the research
• Data collect through survey, interviews, direct observations
and experiment. Example: Population Census
• Advantage:
1. High Respond rate
2. Accurate
• Disadvantage
1. Lot of time consuming, effort, and cost
23.
Secondary Data
• Datathat has been collected form other parties. Eg.
Journals, yearly report etc.
• Easily available
• Advantage
1.Convenient and less time effort, and cost
• Disadvantage
2. Produce error
3. May not meet specific needs
24.
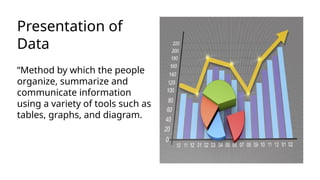
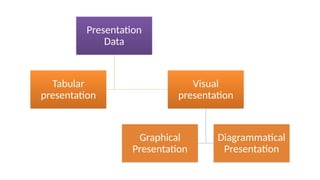
Presentation of
Data
“Method bywhich the people
organize, summarize and
communicate information
using a variety of tools such as
tables, graphs, and diagram.
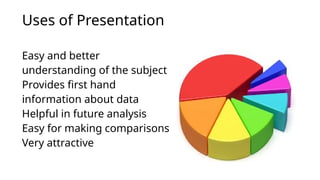
Uses of Presentation
Easyand better
understanding of the subject
Provides first hand
information about data
Helpful in future analysis
Easy for making comparisons
Very attractive
27.
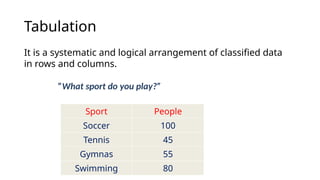
Tabulation
It is asystematic and logical arrangement of classified data
in rows and columns.
”What sport do you play?”
Sport People
Soccer 100
Tennis 45
Gymnas 55
Swimming 80
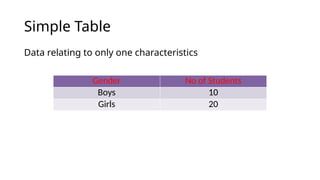
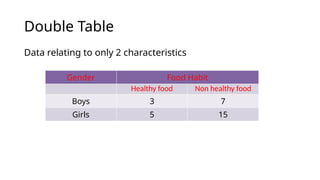
Double Table
Data relatingto only 2 characteristics
Gender Food Habit
Healthy food Non healthy food
Boys 3 7
Girls 5 15
30.
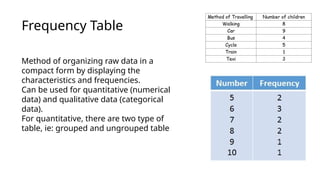
Frequency Table
Method oforganizing raw data in a
compact form by displaying the
characteristics and frequencies.
Can be used for quantitative (numerical
data) and qualitative data (categorical
data).
For quantitative, there are two type of
table, ie: grouped and ungrouped table
31.
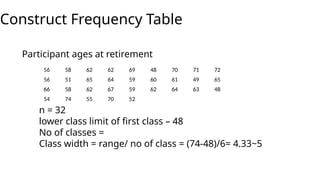
Construct Frequency Table
Participantages at retirement
n = 32
lower class limit of first class – 48
No of classes =
Class width = range/ no of class = (74-48)/6= 4.33~5
56 58 62 62 69 48 70 71 72
56 51 65 64 59 60 61 49 65
66 58 62 67 59 62 64 63 48
54 74 55 70 52
32.
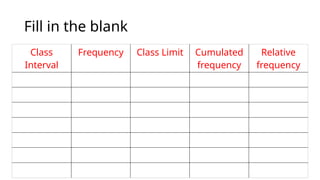
Fill in theblank
Class
Interval
Frequency Class Limit Cumulated
frequency
Relative
frequency
33.
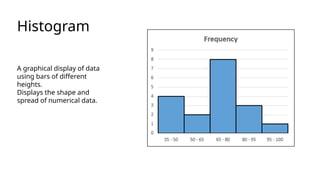
Histogram
A graphical displayof data
using bars of different
heights.
Displays the shape and
spread of numerical data.
34.
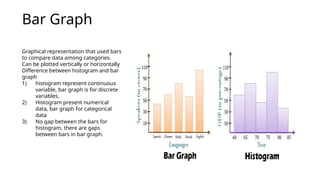
Bar Graph
Graphical representationthat used bars
to compare data among categories.
Can be plotted vertically or horizontally
Difference between histogram and bar
graph
1) histogram represent continuous
variable, bar graph is for discrete
variables.
2) Histogram present numerical
data, bar graph for categorical
data
3) No gap between the bars for
histogram, there are gaps
between bars in bar graph.
35.
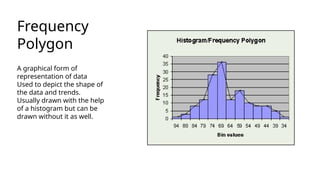
Frequency
Polygon
A graphical formof
representation of data
Used to depict the shape of
the data and trends.
Usually drawn with the help
of a histogram but can be
drawn without it as well.
36.
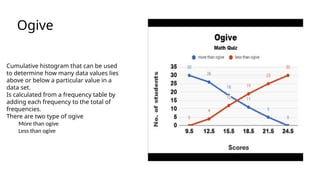
Ogive
Cumulative histogram thatcan be used
to determine how many data values lies
above or below a particular value in a
data set.
Is calculated from a frequency table by
adding each frequency to the total of
frequencies.
There are two type of ogive
More than ogive
Less than ogive
37.
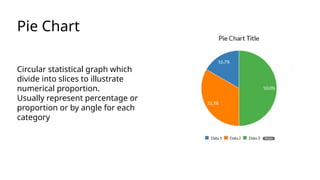
Pie Chart
Circular statisticalgraph which
divide into slices to illustrate
numerical proportion.
Usually represent percentage or
proportion or by angle for each
category
38.
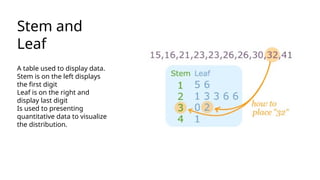
Stem and
Leaf
A tableused to display data.
Stem is on the left displays
the first digit
Leaf is on the right and
display last digit
Is used to presenting
quantitative data to visualize
the distribution.