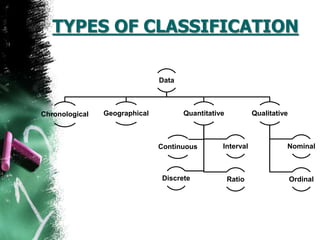
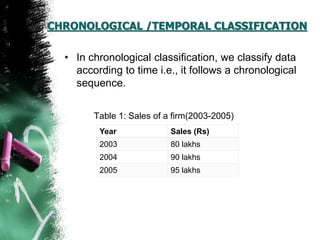
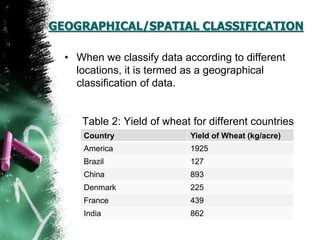
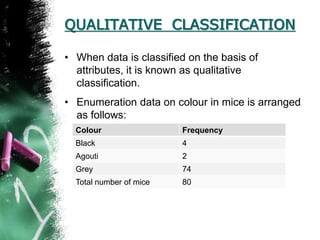
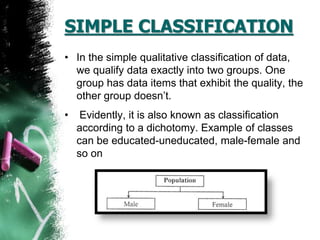
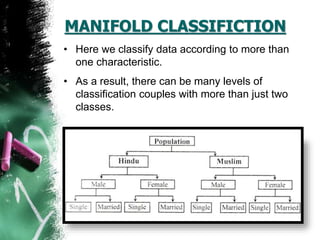
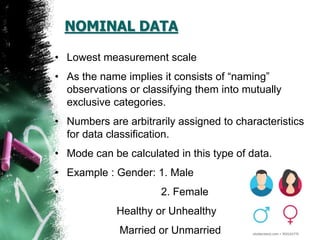
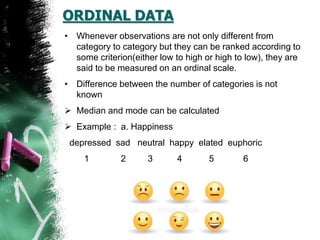
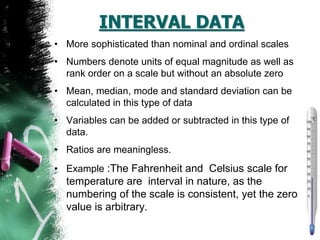
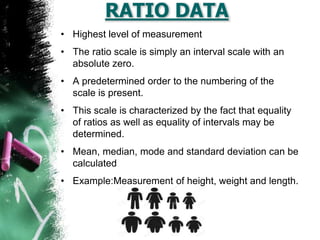
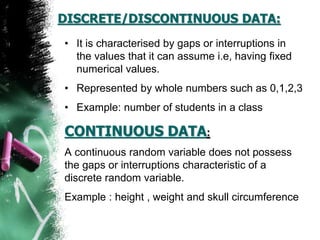
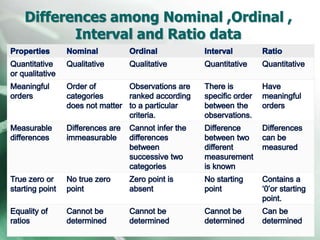
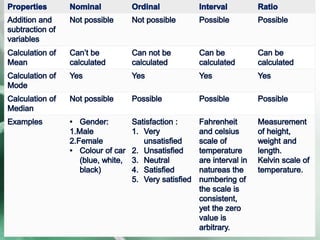
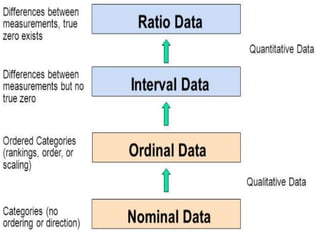
SlideShare a Scribd company logo
Classification of data
Submitted by : Aditya Kiran
1834104
B.Sc(H) Botany,3rd year
CLASSIFICATION OF DATA
• It is the process of arranging data
into homogeneous (similar) groups
according to their common
characteristics.
OBJECTIVES OF CLASSIFICATION
• Simplification and briefness
• Utility
• Distinctiveness
• Comparability
• Scientific arrangement
• Attractive and effective
CHARACTERISTICS
• Comprehensive
• Clarity
• Homogeneity
• Suitability
• Stability
• Elastic
TYPES OF CLASSIFICATION
Data
Chronological Geographical Quantitative
Interval
Ratio
Continuous
Discrete
Qualitative
Nominal
Ordinal
CHRONOLOGICAL /TEMPORAL CLASSIFICATION
• In chronological classification, we classify data
according to time i.e., it follows a chronological
sequence.
Table 1: Sales of a firm(2003-2005)
Year Sales (Rs)
2003 80 lakhs
2004 90 lakhs
2005 95 lakhs
GEOGRAPHICAL/SPATIAL CLASSIFICATION
• When we classify data according to different
locations, it is termed as a geographical
classification of data.
Table 2: Yield of wheat for different countries
Country Yield of Wheat (kg/acre)
America 1925
Brazil 127
China 893
Denmark 225
France 439
India 862
QUALITATIVE CLASSIFICATION
• When data is classified on the basis of
attributes, it is known as qualitative
classification.
• Enumeration data on colour in mice is arranged
as follows:
Colour Frequency
Black 4
Agouti 2
Grey 74
Total number of mice 80
SIMPLE CLASSIFICATION
• In the simple qualitative classification of data,
we qualify data exactly into two groups. One
group has data items that exhibit the quality, the
other group doesn’t.
• Evidently, it is also known as classification
according to a dichotomy. Example of classes
can be educated-uneducated, male-female and
so on
MANIFOLD CLASSIFICTION
• Here we classify data according to more than
one characteristic.
• As a result, there can be many levels of
classification couples with more than just two
classes.
NOMINAL DATA
• Lowest measurement scale
• As the name implies it consists of “naming”
observations or classifying them into mutually
exclusive categories.
• Numbers are arbitrarily assigned to characteristics
for data classification.
• Mode can be calculated in this type of data.
• Example : Gender: 1. Male
• 2. Female
Healthy or Unhealthy
Married or Unmarried
ORDINAL DATA
• Whenever observations are not only different from
category to category but they can be ranked according to
some criterion(either low to high or high to low), they are
said to be measured on an ordinal scale.
• Difference between the number of categories is not
known
 Median and mode can be calculated
 Example : a. Happiness
depressed sad neutral happy elated euphoric
1 2 3 4 5 6
QUANTITATIVE CLASSIFICATION
• This type of classification is made on the basis
some measurable characteristics like height,
weight, age, income, marks of students, etc.
Table 3 :Annual profit of small scale firms in UP
Annual profit Number of firms
0-100,000 5
100,000-200,000 150
200,000-300,000 1500
300,000-400,000 800
400,000-500,000 400
Above 500,000 200
INTERVAL DATA
• More sophisticated than nominal and ordinal scales
• Numbers denote units of equal magnitude as well as
rank order on a scale but without an absolute zero
• Mean, median, mode and standard deviation can be
calculated in this type of data
• Variables can be added or subtracted in this type of
data.
• Ratios are meaningless.
• Example :The Fahrenheit and Celsius scale for
temperature are interval in nature, as the
numbering of the scale is consistent, yet the zero
value is arbitrary.
RATIO DATA
• Highest level of measurement
• The ratio scale is simply an interval scale with an
absolute zero.
• A predetermined order to the numbering of the
scale is present.
• This scale is characterized by the fact that equality
of ratios as well as equality of intervals may be
determined.
• Mean, median, mode and standard deviation can be
calculated
• Example:Measurement of height, weight and length.
DISCRETE/DISCONTINUOUS DATA:
• It is characterised by gaps or interruptions in
the values that it can assume i.e, having fixed
numerical values.
• Represented by whole numbers such as 0,1,2,3
• Example: number of students in a class
CONTINUOUS DATA:
A continuous random variable does not possess
the gaps or interruptions characteristic of a
discrete random variable.
Example : height , weight and skull circumference
Differences among Nominal ,Ordinal ,
Interval and Ratio data
https://youtu.be/yp8zReT3AfY
https://www.youtube.com/watch?v=xgjMmpv7r4M&t=295s
REFERENCES :
• Biostatistics (by Daniel)
• Introduction of biostatistics by Sokal and Rohlf
• www.sciencedirect.com (introduction to
biostatistics part 2 basic concepts)
• https://byjus.com/commerce/meaning-and-
objectives-of-classification-of-data/
• https://www.toppr.com/guides/economics/organi
sation-of-data/raw-data-classification-of-data-
and-variables/
Classification of data ppt.pptx

More Related Content

What's hot

DATA PRESENTATION METHODS - 1.pptx
DATA PRESENTATION METHODS - 1.pptxDATA PRESENTATION METHODS - 1.pptx
DATA PRESENTATION METHODS - 1.pptx
vineetarun1
 
Classification and tabulation of data
Classification and tabulation of dataClassification and tabulation of data
Classification and tabulation of data
Jagdish Powar
 
Statistics in research
Statistics in researchStatistics in research
Statistics in research
Balaji P
 
Types of Statistics Descriptive and Inferential Statistics
Types of Statistics Descriptive and Inferential StatisticsTypes of Statistics Descriptive and Inferential Statistics
Types of Statistics Descriptive and Inferential Statistics
Dr. Amjad Ali Arain
 
Data presentation 2
Data presentation 2Data presentation 2
Data presentation 2
Rawalpindi Medical College
 
Data presentation/ How to present Research outcome data
Data presentation/ How to present Research outcome dataData presentation/ How to present Research outcome data
Data presentation/ How to present Research outcome data
Dr-Jitendra Patel
 
DIAGRAMMATIC REPRESENTATION.pptx
DIAGRAMMATIC REPRESENTATION.pptxDIAGRAMMATIC REPRESENTATION.pptx
DIAGRAMMATIC REPRESENTATION.pptx
JEEVARATHINAM ANTONY
 
Data organization
Data organizationData organization
Data organization
rowell balala
 
Presentation of Data
Presentation of DataPresentation of Data
Presentation of Data
Umair Anwar
 
Biostatistics Tabulation of data
Biostatistics Tabulation of dataBiostatistics Tabulation of data
Biostatistics Tabulation of data
HARINATHA REDDY ASWARTHA
 
Classification of data
Classification of dataClassification of data
Classification of data
ligaya06
 
Presentation of data ppt
Presentation of data pptPresentation of data ppt
Four data types Data Scientist should know
Four data types Data Scientist should knowFour data types Data Scientist should know
Four data types Data Scientist should know
Ranjit Nambisan
 
Bar Diagram (chart) in Statistics presentation
Bar Diagram (chart) in Statistics presentationBar Diagram (chart) in Statistics presentation
Bar Diagram (chart) in Statistics presentation
sheiblu
 
diagrammatic and graphical representation of data
 diagrammatic and graphical representation of data diagrammatic and graphical representation of data
diagrammatic and graphical representation of data
Varun Prem Varu
 
Data collection,tabulation,processing and analysis
Data collection,tabulation,processing and analysisData collection,tabulation,processing and analysis
Data collection,tabulation,processing and analysis
RobinsonRaja1
 
Type of data
Type of dataType of data
Type of data
Amit Sharma
 
Graphical Representation In Statistics.
Graphical Representation In Statistics.Graphical Representation In Statistics.
Graphical Representation In Statistics.
Anumadil1
 
Tabulation
TabulationTabulation
Tabulation
Nirmal Singh
 
Statistics report THE RANGE
Statistics report THE RANGEStatistics report THE RANGE
Statistics report THE RANGE
Charliez Jane Soriano
 

What's hot (20)

DATA PRESENTATION METHODS - 1.pptx
DATA PRESENTATION METHODS - 1.pptxDATA PRESENTATION METHODS - 1.pptx
DATA PRESENTATION METHODS - 1.pptx
 
Classification and tabulation of data
Classification and tabulation of dataClassification and tabulation of data
Classification and tabulation of data
 
Statistics in research
Statistics in researchStatistics in research
Statistics in research
 
Types of Statistics Descriptive and Inferential Statistics
Types of Statistics Descriptive and Inferential StatisticsTypes of Statistics Descriptive and Inferential Statistics
Types of Statistics Descriptive and Inferential Statistics
 
Data presentation 2
Data presentation 2Data presentation 2
Data presentation 2
 
Data presentation/ How to present Research outcome data
Data presentation/ How to present Research outcome dataData presentation/ How to present Research outcome data
Data presentation/ How to present Research outcome data
 
DIAGRAMMATIC REPRESENTATION.pptx
DIAGRAMMATIC REPRESENTATION.pptxDIAGRAMMATIC REPRESENTATION.pptx
DIAGRAMMATIC REPRESENTATION.pptx
 
Data organization
Data organizationData organization
Data organization
 
Presentation of Data
Presentation of DataPresentation of Data
Presentation of Data
 
Biostatistics Tabulation of data
Biostatistics Tabulation of dataBiostatistics Tabulation of data
Biostatistics Tabulation of data
 
Classification of data
Classification of dataClassification of data
Classification of data
 
Presentation of data ppt
Presentation of data pptPresentation of data ppt
Presentation of data ppt
 
Four data types Data Scientist should know
Four data types Data Scientist should knowFour data types Data Scientist should know
Four data types Data Scientist should know
 
Bar Diagram (chart) in Statistics presentation
Bar Diagram (chart) in Statistics presentationBar Diagram (chart) in Statistics presentation
Bar Diagram (chart) in Statistics presentation
 
diagrammatic and graphical representation of data
 diagrammatic and graphical representation of data diagrammatic and graphical representation of data
diagrammatic and graphical representation of data
 
Data collection,tabulation,processing and analysis
Data collection,tabulation,processing and analysisData collection,tabulation,processing and analysis
Data collection,tabulation,processing and analysis
 
Type of data
Type of dataType of data
Type of data
 
Graphical Representation In Statistics.
Graphical Representation In Statistics.Graphical Representation In Statistics.
Graphical Representation In Statistics.
 
Tabulation
TabulationTabulation
Tabulation
 
Statistics report THE RANGE
Statistics report THE RANGEStatistics report THE RANGE
Statistics report THE RANGE
 

Similar to Classification of data ppt.pptx

ANALYSIS OF DATA.pptx
ANALYSIS OF DATA.pptxANALYSIS OF DATA.pptx
ANALYSIS OF DATA.pptx
PRADEEP ABOTHU
 
PRESENTATION.pptx
PRESENTATION.pptxPRESENTATION.pptx
PRESENTATION.pptx
MedicalEducation7
 
Epidemiolgy and biostatistics notes
Epidemiolgy and biostatistics notesEpidemiolgy and biostatistics notes
Epidemiolgy and biostatistics notes
Charles Ntwale
 
Introduction to basics of bio statistics.
Introduction to basics of bio statistics.Introduction to basics of bio statistics.
Introduction to basics of bio statistics.
AB Rajar
 
Introduction to Statistics in Nursing.
Introduction to Statistics in Nursing.Introduction to Statistics in Nursing.
Introduction to Statistics in Nursing.
Johny Kutty Joseph
 
Data And Variable In Scientific Research
Data And Variable In Scientific ResearchData And Variable In Scientific Research
Data And Variable In Scientific Research
Aswin Sarath
 
Organisation of data
Organisation of dataOrganisation of data
Organisation of data
Sonam Omar
 
SCALE , CLASSIFICATION OF SCALE AND IMPORTANCE OF SCALING TECHNIQUES.pptx
SCALE , CLASSIFICATION OF SCALE AND IMPORTANCE OF SCALING TECHNIQUES.pptxSCALE , CLASSIFICATION OF SCALE AND IMPORTANCE OF SCALING TECHNIQUES.pptx
SCALE , CLASSIFICATION OF SCALE AND IMPORTANCE OF SCALING TECHNIQUES.pptx
AnshutChitransh
 
scales of measurment
scales of measurmentscales of measurment
scales of measurment
keerthi samuel
 
Probability_and_Statistics_lecture_notes_1.pptx
Probability_and_Statistics_lecture_notes_1.pptxProbability_and_Statistics_lecture_notes_1.pptx
Probability_and_Statistics_lecture_notes_1.pptx
AliMurat5
 
Sampling-A compact study of different types of sample
Sampling-A compact study of different types of sampleSampling-A compact study of different types of sample
Sampling-A compact study of different types of sample
Asith Paul.K
 
Statistics Mathematics B.sc -week-2.pptx
Statistics  Mathematics B.sc -week-2.pptxStatistics  Mathematics B.sc -week-2.pptx
Statistics Mathematics B.sc -week-2.pptx
ZiaOul
 
Statistics Mathematics B.sc -week-2.pptx
Statistics  Mathematics B.sc -week-2.pptxStatistics  Mathematics B.sc -week-2.pptx
Statistics Mathematics B.sc -week-2.pptx
ZiaOul
 
Biostatistic 2.pptx
Biostatistic 2.pptxBiostatistic 2.pptx
Biostatistic 2.pptx
imrantestmails
 
types of measurement scale (1).pptx
types of measurement scale (1).pptxtypes of measurement scale (1).pptx
types of measurement scale (1).pptx
ShoaibWani10
 
Data analysis for business decisions
Data analysis for business decisionsData analysis for business decisions
Data analysis for business decisions
Md Salman Ashrafi
 
Types of data and graphical representation
Types of data and graphical representationTypes of data and graphical representation
Types of data and graphical representation
Reena Titoria
 
Levels of Measurement
Levels of MeasurementLevels of Measurement
Levels of Measurement
Sarfraz Ahmad
 
Levels of measurement
Levels of measurementLevels of measurement
Levels of measurement
Sarfraz Ahmad
 
2_Types_of_Data.pdf
2_Types_of_Data.pdf2_Types_of_Data.pdf
2_Types_of_Data.pdf
JpXtyrael
 

Similar to Classification of data ppt.pptx (20)

ANALYSIS OF DATA.pptx
ANALYSIS OF DATA.pptxANALYSIS OF DATA.pptx
ANALYSIS OF DATA.pptx
 
PRESENTATION.pptx
PRESENTATION.pptxPRESENTATION.pptx
PRESENTATION.pptx
 
Epidemiolgy and biostatistics notes
Epidemiolgy and biostatistics notesEpidemiolgy and biostatistics notes
Epidemiolgy and biostatistics notes
 
Introduction to basics of bio statistics.
Introduction to basics of bio statistics.Introduction to basics of bio statistics.
Introduction to basics of bio statistics.
 
Introduction to Statistics in Nursing.
Introduction to Statistics in Nursing.Introduction to Statistics in Nursing.
Introduction to Statistics in Nursing.
 
Data And Variable In Scientific Research
Data And Variable In Scientific ResearchData And Variable In Scientific Research
Data And Variable In Scientific Research
 
Organisation of data
Organisation of dataOrganisation of data
Organisation of data
 
SCALE , CLASSIFICATION OF SCALE AND IMPORTANCE OF SCALING TECHNIQUES.pptx
SCALE , CLASSIFICATION OF SCALE AND IMPORTANCE OF SCALING TECHNIQUES.pptxSCALE , CLASSIFICATION OF SCALE AND IMPORTANCE OF SCALING TECHNIQUES.pptx
SCALE , CLASSIFICATION OF SCALE AND IMPORTANCE OF SCALING TECHNIQUES.pptx
 
scales of measurment
scales of measurmentscales of measurment
scales of measurment
 
Probability_and_Statistics_lecture_notes_1.pptx
Probability_and_Statistics_lecture_notes_1.pptxProbability_and_Statistics_lecture_notes_1.pptx
Probability_and_Statistics_lecture_notes_1.pptx
 
Sampling-A compact study of different types of sample
Sampling-A compact study of different types of sampleSampling-A compact study of different types of sample
Sampling-A compact study of different types of sample
 
Statistics Mathematics B.sc -week-2.pptx
Statistics  Mathematics B.sc -week-2.pptxStatistics  Mathematics B.sc -week-2.pptx
Statistics Mathematics B.sc -week-2.pptx
 
Statistics Mathematics B.sc -week-2.pptx
Statistics  Mathematics B.sc -week-2.pptxStatistics  Mathematics B.sc -week-2.pptx
Statistics Mathematics B.sc -week-2.pptx
 
Biostatistic 2.pptx
Biostatistic 2.pptxBiostatistic 2.pptx
Biostatistic 2.pptx
 
types of measurement scale (1).pptx
types of measurement scale (1).pptxtypes of measurement scale (1).pptx
types of measurement scale (1).pptx
 
Data analysis for business decisions
Data analysis for business decisionsData analysis for business decisions
Data analysis for business decisions
 
Types of data and graphical representation
Types of data and graphical representationTypes of data and graphical representation
Types of data and graphical representation
 
Levels of Measurement
Levels of MeasurementLevels of Measurement
Levels of Measurement
 
Levels of measurement
Levels of measurementLevels of measurement
Levels of measurement
 
2_Types_of_Data.pdf
2_Types_of_Data.pdf2_Types_of_Data.pdf
2_Types_of_Data.pdf
 

Recently uploaded

在线办理(英国UCA毕业证书)创意艺术大学毕业证在读证明一模一样
在线办理(英国UCA毕业证书)创意艺术大学毕业证在读证明一模一样在线办理(英国UCA毕业证书)创意艺术大学毕业证在读证明一模一样
在线办理(英国UCA毕业证书)创意艺术大学毕业证在读证明一模一样
v7oacc3l
 
4th Modern Marketing Reckoner by MMA Global India & Group M: 60+ experts on W...
4th Modern Marketing Reckoner by MMA Global India & Group M: 60+ experts on W...4th Modern Marketing Reckoner by MMA Global India & Group M: 60+ experts on W...
4th Modern Marketing Reckoner by MMA Global India & Group M: 60+ experts on W...
Social Samosa
 
Natural Language Processing (NLP), RAG and its applications .pptx
Natural Language Processing (NLP), RAG and its applications .pptxNatural Language Processing (NLP), RAG and its applications .pptx
Natural Language Processing (NLP), RAG and its applications .pptx
fkyes25
 
06-04-2024 - NYC Tech Week - Discussion on Vector Databases, Unstructured Dat...
06-04-2024 - NYC Tech Week - Discussion on Vector Databases, Unstructured Dat...06-04-2024 - NYC Tech Week - Discussion on Vector Databases, Unstructured Dat...
06-04-2024 - NYC Tech Week - Discussion on Vector Databases, Unstructured Dat...
Timothy Spann
 
Challenges of Nation Building-1.pptx with more important
Challenges of Nation Building-1.pptx with more importantChallenges of Nation Building-1.pptx with more important
Challenges of Nation Building-1.pptx with more important
Sm321
 
原版制作(Deakin毕业证书)迪肯大学毕业证学位证一模一样
原版制作(Deakin毕业证书)迪肯大学毕业证学位证一模一样原版制作(Deakin毕业证书)迪肯大学毕业证学位证一模一样
原版制作(Deakin毕业证书)迪肯大学毕业证学位证一模一样
u86oixdj
 
一比一原版(UCSF文凭证书)旧金山分校毕业证如何办理
一比一原版(UCSF文凭证书)旧金山分校毕业证如何办理一比一原版(UCSF文凭证书)旧金山分校毕业证如何办理
一比一原版(UCSF文凭证书)旧金山分校毕业证如何办理
nuttdpt
 
Everything you wanted to know about LIHTC
Everything you wanted to know about LIHTCEverything you wanted to know about LIHTC
Everything you wanted to know about LIHTC
Roger Valdez
 
University of New South Wales degree offer diploma Transcript
University of New South Wales degree offer diploma TranscriptUniversity of New South Wales degree offer diploma Transcript
University of New South Wales degree offer diploma Transcript
soxrziqu
 
一比一原版(Dalhousie毕业证书)达尔豪斯大学毕业证如何办理
一比一原版(Dalhousie毕业证书)达尔豪斯大学毕业证如何办理一比一原版(Dalhousie毕业证书)达尔豪斯大学毕业证如何办理
一比一原版(Dalhousie毕业证书)达尔豪斯大学毕业证如何办理
mzpolocfi
 
一比一原版(UofS毕业证书)萨省大学毕业证如何办理
一比一原版(UofS毕业证书)萨省大学毕业证如何办理一比一原版(UofS毕业证书)萨省大学毕业证如何办理
一比一原版(UofS毕业证书)萨省大学毕业证如何办理
v3tuleee
 
一比一原版(爱大毕业证书)爱丁堡大学毕业证如何办理
一比一原版(爱大毕业证书)爱丁堡大学毕业证如何办理一比一原版(爱大毕业证书)爱丁堡大学毕业证如何办理
一比一原版(爱大毕业证书)爱丁堡大学毕业证如何办理
g4dpvqap0
 
Analysis insight about a Flyball dog competition team's performance
Analysis insight about a Flyball dog competition team's performanceAnalysis insight about a Flyball dog competition team's performance
Analysis insight about a Flyball dog competition team's performance
roli9797
 
一比一原版(UniSA毕业证书)南澳大学毕业证如何办理
一比一原版(UniSA毕业证书)南澳大学毕业证如何办理一比一原版(UniSA毕业证书)南澳大学毕业证如何办理
一比一原版(UniSA毕业证书)南澳大学毕业证如何办理
slg6lamcq
 
Palo Alto Cortex XDR presentation .......
Palo Alto Cortex XDR presentation .......Palo Alto Cortex XDR presentation .......
Palo Alto Cortex XDR presentation .......
Sachin Paul
 
Beyond the Basics of A/B Tests: Highly Innovative Experimentation Tactics You...
Beyond the Basics of A/B Tests: Highly Innovative Experimentation Tactics You...Beyond the Basics of A/B Tests: Highly Innovative Experimentation Tactics You...
Beyond the Basics of A/B Tests: Highly Innovative Experimentation Tactics You...
Aggregage
 
STATATHON: Unleashing the Power of Statistics in a 48-Hour Knowledge Extravag...
STATATHON: Unleashing the Power of Statistics in a 48-Hour Knowledge Extravag...STATATHON: Unleashing the Power of Statistics in a 48-Hour Knowledge Extravag...
STATATHON: Unleashing the Power of Statistics in a 48-Hour Knowledge Extravag...
sameer shah
 
ViewShift: Hassle-free Dynamic Policy Enforcement for Every Data Lake
ViewShift: Hassle-free Dynamic Policy Enforcement for Every Data LakeViewShift: Hassle-free Dynamic Policy Enforcement for Every Data Lake
ViewShift: Hassle-free Dynamic Policy Enforcement for Every Data Lake
Walaa Eldin Moustafa
 
Predictably Improve Your B2B Tech Company's Performance by Leveraging Data
Predictably Improve Your B2B Tech Company's Performance by Leveraging DataPredictably Improve Your B2B Tech Company's Performance by Leveraging Data
Predictably Improve Your B2B Tech Company's Performance by Leveraging Data
Kiwi Creative
 
一比一原版(UMN文凭证书)明尼苏达大学毕业证如何办理
一比一原版(UMN文凭证书)明尼苏达大学毕业证如何办理一比一原版(UMN文凭证书)明尼苏达大学毕业证如何办理
一比一原版(UMN文凭证书)明尼苏达大学毕业证如何办理
nyfuhyz
 

Recently uploaded (20)

在线办理(英国UCA毕业证书)创意艺术大学毕业证在读证明一模一样
在线办理(英国UCA毕业证书)创意艺术大学毕业证在读证明一模一样在线办理(英国UCA毕业证书)创意艺术大学毕业证在读证明一模一样
在线办理(英国UCA毕业证书)创意艺术大学毕业证在读证明一模一样
 
4th Modern Marketing Reckoner by MMA Global India & Group M: 60+ experts on W...
4th Modern Marketing Reckoner by MMA Global India & Group M: 60+ experts on W...4th Modern Marketing Reckoner by MMA Global India & Group M: 60+ experts on W...
4th Modern Marketing Reckoner by MMA Global India & Group M: 60+ experts on W...
 
Natural Language Processing (NLP), RAG and its applications .pptx
Natural Language Processing (NLP), RAG and its applications .pptxNatural Language Processing (NLP), RAG and its applications .pptx
Natural Language Processing (NLP), RAG and its applications .pptx
 
06-04-2024 - NYC Tech Week - Discussion on Vector Databases, Unstructured Dat...
06-04-2024 - NYC Tech Week - Discussion on Vector Databases, Unstructured Dat...06-04-2024 - NYC Tech Week - Discussion on Vector Databases, Unstructured Dat...
06-04-2024 - NYC Tech Week - Discussion on Vector Databases, Unstructured Dat...
 
Challenges of Nation Building-1.pptx with more important
Challenges of Nation Building-1.pptx with more importantChallenges of Nation Building-1.pptx with more important
Challenges of Nation Building-1.pptx with more important
 
原版制作(Deakin毕业证书)迪肯大学毕业证学位证一模一样
原版制作(Deakin毕业证书)迪肯大学毕业证学位证一模一样原版制作(Deakin毕业证书)迪肯大学毕业证学位证一模一样
原版制作(Deakin毕业证书)迪肯大学毕业证学位证一模一样
 
一比一原版(UCSF文凭证书)旧金山分校毕业证如何办理
一比一原版(UCSF文凭证书)旧金山分校毕业证如何办理一比一原版(UCSF文凭证书)旧金山分校毕业证如何办理
一比一原版(UCSF文凭证书)旧金山分校毕业证如何办理
 
Everything you wanted to know about LIHTC
Everything you wanted to know about LIHTCEverything you wanted to know about LIHTC
Everything you wanted to know about LIHTC
 
University of New South Wales degree offer diploma Transcript
University of New South Wales degree offer diploma TranscriptUniversity of New South Wales degree offer diploma Transcript
University of New South Wales degree offer diploma Transcript
 
一比一原版(Dalhousie毕业证书)达尔豪斯大学毕业证如何办理
一比一原版(Dalhousie毕业证书)达尔豪斯大学毕业证如何办理一比一原版(Dalhousie毕业证书)达尔豪斯大学毕业证如何办理
一比一原版(Dalhousie毕业证书)达尔豪斯大学毕业证如何办理
 
一比一原版(UofS毕业证书)萨省大学毕业证如何办理
一比一原版(UofS毕业证书)萨省大学毕业证如何办理一比一原版(UofS毕业证书)萨省大学毕业证如何办理
一比一原版(UofS毕业证书)萨省大学毕业证如何办理
 
一比一原版(爱大毕业证书)爱丁堡大学毕业证如何办理
一比一原版(爱大毕业证书)爱丁堡大学毕业证如何办理一比一原版(爱大毕业证书)爱丁堡大学毕业证如何办理
一比一原版(爱大毕业证书)爱丁堡大学毕业证如何办理
 
Analysis insight about a Flyball dog competition team's performance
Analysis insight about a Flyball dog competition team's performanceAnalysis insight about a Flyball dog competition team's performance
Analysis insight about a Flyball dog competition team's performance
 
一比一原版(UniSA毕业证书)南澳大学毕业证如何办理
一比一原版(UniSA毕业证书)南澳大学毕业证如何办理一比一原版(UniSA毕业证书)南澳大学毕业证如何办理
一比一原版(UniSA毕业证书)南澳大学毕业证如何办理
 
Palo Alto Cortex XDR presentation .......
Palo Alto Cortex XDR presentation .......Palo Alto Cortex XDR presentation .......
Palo Alto Cortex XDR presentation .......
 
Beyond the Basics of A/B Tests: Highly Innovative Experimentation Tactics You...
Beyond the Basics of A/B Tests: Highly Innovative Experimentation Tactics You...Beyond the Basics of A/B Tests: Highly Innovative Experimentation Tactics You...
Beyond the Basics of A/B Tests: Highly Innovative Experimentation Tactics You...
 
STATATHON: Unleashing the Power of Statistics in a 48-Hour Knowledge Extravag...
STATATHON: Unleashing the Power of Statistics in a 48-Hour Knowledge Extravag...STATATHON: Unleashing the Power of Statistics in a 48-Hour Knowledge Extravag...
STATATHON: Unleashing the Power of Statistics in a 48-Hour Knowledge Extravag...
 
ViewShift: Hassle-free Dynamic Policy Enforcement for Every Data Lake
ViewShift: Hassle-free Dynamic Policy Enforcement for Every Data LakeViewShift: Hassle-free Dynamic Policy Enforcement for Every Data Lake
ViewShift: Hassle-free Dynamic Policy Enforcement for Every Data Lake
 
Predictably Improve Your B2B Tech Company's Performance by Leveraging Data
Predictably Improve Your B2B Tech Company's Performance by Leveraging DataPredictably Improve Your B2B Tech Company's Performance by Leveraging Data
Predictably Improve Your B2B Tech Company's Performance by Leveraging Data
 
一比一原版(UMN文凭证书)明尼苏达大学毕业证如何办理
一比一原版(UMN文凭证书)明尼苏达大学毕业证如何办理一比一原版(UMN文凭证书)明尼苏达大学毕业证如何办理
一比一原版(UMN文凭证书)明尼苏达大学毕业证如何办理
 

Classification of data ppt.pptx

  • 1. Classification of data Submitted by : Aditya Kiran 1834104 B.Sc(H) Botany,3rd year
  • 2. CLASSIFICATION OF DATA • It is the process of arranging data into homogeneous (similar) groups according to their common characteristics.
  • 3. OBJECTIVES OF CLASSIFICATION • Simplification and briefness • Utility • Distinctiveness • Comparability • Scientific arrangement • Attractive and effective
  • 4. CHARACTERISTICS • Comprehensive • Clarity • Homogeneity • Suitability • Stability • Elastic
  • 5. TYPES OF CLASSIFICATION Data Chronological Geographical Quantitative Interval Ratio Continuous Discrete Qualitative Nominal Ordinal
  • 6. CHRONOLOGICAL /TEMPORAL CLASSIFICATION • In chronological classification, we classify data according to time i.e., it follows a chronological sequence. Table 1: Sales of a firm(2003-2005) Year Sales (Rs) 2003 80 lakhs 2004 90 lakhs 2005 95 lakhs
  • 7. GEOGRAPHICAL/SPATIAL CLASSIFICATION • When we classify data according to different locations, it is termed as a geographical classification of data. Table 2: Yield of wheat for different countries Country Yield of Wheat (kg/acre) America 1925 Brazil 127 China 893 Denmark 225 France 439 India 862
  • 8. QUALITATIVE CLASSIFICATION • When data is classified on the basis of attributes, it is known as qualitative classification. • Enumeration data on colour in mice is arranged as follows: Colour Frequency Black 4 Agouti 2 Grey 74 Total number of mice 80
  • 9. SIMPLE CLASSIFICATION • In the simple qualitative classification of data, we qualify data exactly into two groups. One group has data items that exhibit the quality, the other group doesn’t. • Evidently, it is also known as classification according to a dichotomy. Example of classes can be educated-uneducated, male-female and so on
  • 10. MANIFOLD CLASSIFICTION • Here we classify data according to more than one characteristic. • As a result, there can be many levels of classification couples with more than just two classes.
  • 11. NOMINAL DATA • Lowest measurement scale • As the name implies it consists of “naming” observations or classifying them into mutually exclusive categories. • Numbers are arbitrarily assigned to characteristics for data classification. • Mode can be calculated in this type of data. • Example : Gender: 1. Male • 2. Female Healthy or Unhealthy Married or Unmarried
  • 12. ORDINAL DATA • Whenever observations are not only different from category to category but they can be ranked according to some criterion(either low to high or high to low), they are said to be measured on an ordinal scale. • Difference between the number of categories is not known  Median and mode can be calculated  Example : a. Happiness depressed sad neutral happy elated euphoric 1 2 3 4 5 6
  • 13. QUANTITATIVE CLASSIFICATION • This type of classification is made on the basis some measurable characteristics like height, weight, age, income, marks of students, etc. Table 3 :Annual profit of small scale firms in UP Annual profit Number of firms 0-100,000 5 100,000-200,000 150 200,000-300,000 1500 300,000-400,000 800 400,000-500,000 400 Above 500,000 200
  • 14. INTERVAL DATA • More sophisticated than nominal and ordinal scales • Numbers denote units of equal magnitude as well as rank order on a scale but without an absolute zero • Mean, median, mode and standard deviation can be calculated in this type of data • Variables can be added or subtracted in this type of data. • Ratios are meaningless. • Example :The Fahrenheit and Celsius scale for temperature are interval in nature, as the numbering of the scale is consistent, yet the zero value is arbitrary.
  • 15. RATIO DATA • Highest level of measurement • The ratio scale is simply an interval scale with an absolute zero. • A predetermined order to the numbering of the scale is present. • This scale is characterized by the fact that equality of ratios as well as equality of intervals may be determined. • Mean, median, mode and standard deviation can be calculated • Example:Measurement of height, weight and length.
  • 16. DISCRETE/DISCONTINUOUS DATA: • It is characterised by gaps or interruptions in the values that it can assume i.e, having fixed numerical values. • Represented by whole numbers such as 0,1,2,3 • Example: number of students in a class CONTINUOUS DATA: A continuous random variable does not possess the gaps or interruptions characteristic of a discrete random variable. Example : height , weight and skull circumference
  • 17. Differences among Nominal ,Ordinal , Interval and Ratio data
  • 18.
  • 19.
  • 21. REFERENCES : • Biostatistics (by Daniel) • Introduction of biostatistics by Sokal and Rohlf • www.sciencedirect.com (introduction to biostatistics part 2 basic concepts) • https://byjus.com/commerce/meaning-and- objectives-of-classification-of-data/ • https://www.toppr.com/guides/economics/organi sation-of-data/raw-data-classification-of-data- and-variables/