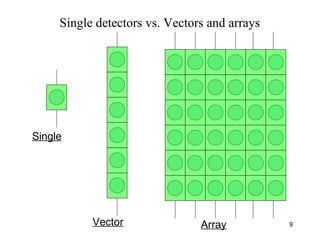
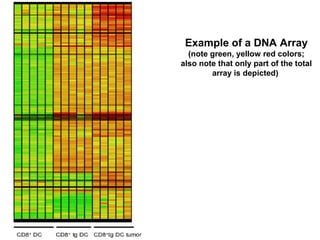
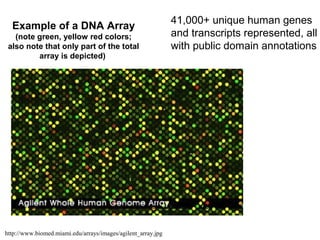
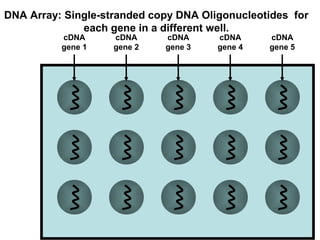
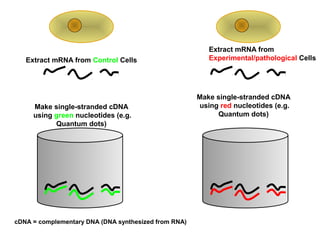
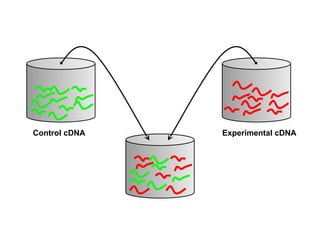
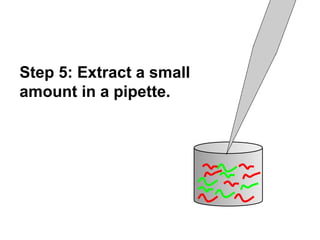
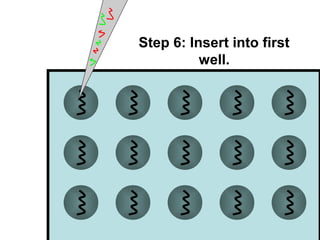
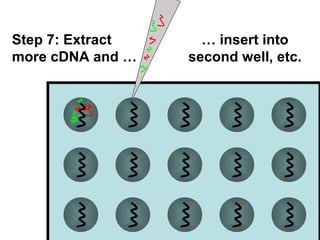
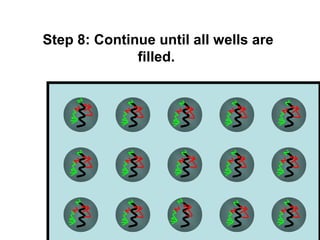
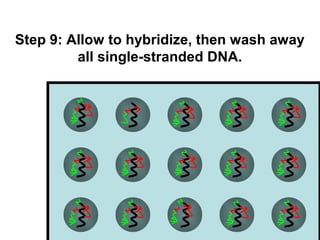
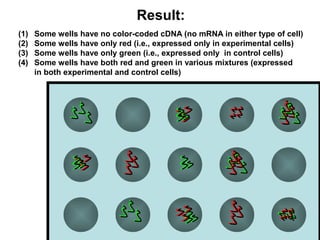
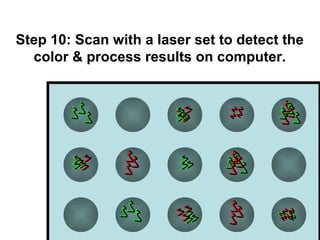
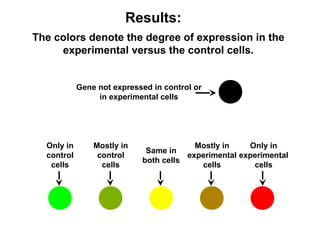
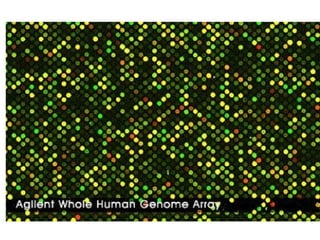
1 
Bio-chips (Lab-on-a-chip)
System architectures
White lines correspond to metal electrodes that 
connect to individual nanowire devices. The 
position of the microfluidic channel used to 
deliver sample is highlighted in blue and has a 
total size of 6 mm × 500 μm, length × width. 
The image field is 4.4 × 3.5 mm. 
(B) Optical image of one row of 
addressable device elements from the 
region highlighted by the red-dashed 
box in A. The red arrow highlights the 
position of a device. The image field is 
500 × 400 μm. 
C) Scanning electron 
microscopy image of one 
silicon nanowire device. 
The electrode contacts are 
visible at the upper right 
and lower left regions of the 
image. (Scale bar: 500 nm.)
4 
Bio-chips 
• Portable, 
• low cost in high volumes, 
• low power, 
• can be integrated with other components 
Chii-Wann Lin et al, DEVELOPMENT OF MICROMACHINED ELECTROCHEMICAL SENSOR 
AND PORTABLE METER SYSTEM, a Proceedings of the 20th Annual International Conference of the IEEE 
Engineering in Medicine and Biology Society, Vol. 20, No 4,1998
System architectures 
• Chips – flat platforms, sensors below or above the chip 
5 
T. Vo-Dinh et al. , Sensors and Actuators, B 74 (2001) 2-11
7 
Schematic diagram of an integrated DNA biochip system 
Vo-Dinh T, Alarie JP, Isola N, Landis D, Wintenberg AL, Ericson, MN (1999) Anal Chem 71 : 
358–363
fluorescence detection of Cy5-labeled Streptavidin using a 4X4 
photodiode array IC biochip. Excitation by a 12 mW He±Ne laser 
(632.8 nm).
9 
Single detectors vs. Vectors and arrays 
Single 
Vector Array
DNA Arrays (Gene chips)
Example of a DNA Array 
(note green, yellow red colors; 
also note that only part of the total 
array is depicted)
Example of a DNA Array 
(note green, yellow red colors; 
also note that only part of the total 
array is depicted) 
http://www.biomed.miami.edu/arrays/images/agilent_array.jpg 
41,000+ unique human genes 
and transcripts represented, all 
with public domain annotations
an arrayed series of thousands of microscopic spots of 
DNA oligonucleotides, called probes, each containing 
picomoles of a specific DNA sequence. This can be a short section 
of a gene or other DNA element that are used as probes to hybridize 
a cDNA or cRNA sample (called target)
• Probe-target hybridization is usually 
detected and quantified by detection of 
fluorophore-, or chemiluminescence-labeled 
targets to determine relative abundance of 
nucleic acid sequences in the target. Since 
an array can contain tens of thousands of 
probes, a microarray experiment can 
accomplish many genetic tests in parallel.
Colloquially known as an Affy chip when an Affymetrix chip is used. 
Other microarray platforms, such as Illumina, use microscopic beads, 
instead of the large solid support. 
Affymetrix 
Agilent Technologies 
Applied 
CombiMatrix 
Eppendorf 
GE Healthcare 
Genetix 
Greiner Bio-One 
Illumina, Inc. 
Kreatech 
Micronit Microfluidics 
Nanogen, Inc. 
NimbleGen 
Ocimum Biosolutions 
Roche Diagnostics 
SCHOTT Nexterion 
STMicroelectronics
• DNA microarrays can be used to measure 
changes in gene expression levels, to detect 
single nucleotide polymorphisms (SNPs) , 
to genotype or resequence mutant genomes.
Step 1: Create a DNA array (gene 
“chip”) by placing single-stranded 
DNA/ Oligonucleotides (probes) for 
each gene to be assayed into a 
separate “well” on the chip.
DNA Array: Single-stranded copy DNA Oligonucleotides for 
cDNA 
gene 1 
cDNA 
gene 2 
cDNA 
gene 3 
cDNA 
gene 4 
cDNA 
gene 5 
each gene in a different well.
the probes are attached to a solid surface by a covalent 
bond to a chemical matrix (via epoxy-silane, amino-silane, 
lysine, polyacrylamide or others). The solid surface can be 
glass or a silicon chip
Step 2: Extract mRNA from biological tissues 
subjected to an experimental treatment and 
from the same tissue subjected to a control 
treatment. Or from normal and from 
pathological tissue
• Step 3- Make single-stranded DNA from the 
mRNA using “color coded” nucleotides.
Extract mRNA from Control Cells 
Extract mRNA from 
Experimental/pathological Cells 
Make single-stranded cDNA 
using green nucleotides (e.g. 
Quantum dots) 
Make single-stranded cDNA 
using red nucleotides (e.g. 
Quantum dots) 
cDNA = complementary DNA (DNA synthesized from RNA)
Step 4: After making many DNA copies of 
the RNA, extract an equal amount of cDNA 
from the controls & experimentals and 
place it into a container.
Control cDNA Experimental cDNA
Step 5: Extract a small 
amount in a pipette.
Step 6: Insert into first 
well.
… insert into 
second well, etc. 
Step 7: Extract 
more cDNA and …
Step 8: Continue until all wells are 
filled.
Step 9: Allow to hybridize, then wash away 
all single-stranded DNA.
Result: 
(1) Some wells have no color-coded cDNA (no mRNA in either type of cell) 
(2) Some wells have only red (i.e., expressed only in experimental cells) 
(3) Some wells have only green (i.e., expressed only in control cells) 
(4) Some wells have both red and green in various mixtures (expressed 
in both experimental and control cells)
Step 10: Scan with a laser set to detect the 
color & process results on computer.
Results: 
The colors denote the degree of expression in the 
experimental versus the control cells. 
Gene not expressed in control or 
in experimental cells 
Only in 
control 
cells 
Mostly in 
control 
cells 
Only in 
experimental 
cells 
Mostly in 
experimental 
cells 
Same in 
both cells
Arrays

Arrays

  • 1.
  • 2.
  • 3.
    White lines correspondto metal electrodes that connect to individual nanowire devices. The position of the microfluidic channel used to deliver sample is highlighted in blue and has a total size of 6 mm × 500 μm, length × width. The image field is 4.4 × 3.5 mm. (B) Optical image of one row of addressable device elements from the region highlighted by the red-dashed box in A. The red arrow highlights the position of a device. The image field is 500 × 400 μm. C) Scanning electron microscopy image of one silicon nanowire device. The electrode contacts are visible at the upper right and lower left regions of the image. (Scale bar: 500 nm.)
  • 4.
    4 Bio-chips •Portable, • low cost in high volumes, • low power, • can be integrated with other components Chii-Wann Lin et al, DEVELOPMENT OF MICROMACHINED ELECTROCHEMICAL SENSOR AND PORTABLE METER SYSTEM, a Proceedings of the 20th Annual International Conference of the IEEE Engineering in Medicine and Biology Society, Vol. 20, No 4,1998
  • 5.
    System architectures •Chips – flat platforms, sensors below or above the chip 5 T. Vo-Dinh et al. , Sensors and Actuators, B 74 (2001) 2-11
  • 7.
    7 Schematic diagramof an integrated DNA biochip system Vo-Dinh T, Alarie JP, Isola N, Landis D, Wintenberg AL, Ericson, MN (1999) Anal Chem 71 : 358–363
  • 8.
    fluorescence detection ofCy5-labeled Streptavidin using a 4X4 photodiode array IC biochip. Excitation by a 12 mW He±Ne laser (632.8 nm).
  • 9.
    9 Single detectorsvs. Vectors and arrays Single Vector Array
  • 10.
  • 11.
    Example of aDNA Array (note green, yellow red colors; also note that only part of the total array is depicted)
  • 12.
    Example of aDNA Array (note green, yellow red colors; also note that only part of the total array is depicted) http://www.biomed.miami.edu/arrays/images/agilent_array.jpg 41,000+ unique human genes and transcripts represented, all with public domain annotations
  • 13.
    an arrayed seriesof thousands of microscopic spots of DNA oligonucleotides, called probes, each containing picomoles of a specific DNA sequence. This can be a short section of a gene or other DNA element that are used as probes to hybridize a cDNA or cRNA sample (called target)
  • 14.
    • Probe-target hybridizationis usually detected and quantified by detection of fluorophore-, or chemiluminescence-labeled targets to determine relative abundance of nucleic acid sequences in the target. Since an array can contain tens of thousands of probes, a microarray experiment can accomplish many genetic tests in parallel.
  • 15.
    Colloquially known asan Affy chip when an Affymetrix chip is used. Other microarray platforms, such as Illumina, use microscopic beads, instead of the large solid support. Affymetrix Agilent Technologies Applied CombiMatrix Eppendorf GE Healthcare Genetix Greiner Bio-One Illumina, Inc. Kreatech Micronit Microfluidics Nanogen, Inc. NimbleGen Ocimum Biosolutions Roche Diagnostics SCHOTT Nexterion STMicroelectronics
  • 16.
    • DNA microarrayscan be used to measure changes in gene expression levels, to detect single nucleotide polymorphisms (SNPs) , to genotype or resequence mutant genomes.
  • 17.
    Step 1: Createa DNA array (gene “chip”) by placing single-stranded DNA/ Oligonucleotides (probes) for each gene to be assayed into a separate “well” on the chip.
  • 18.
    DNA Array: Single-strandedcopy DNA Oligonucleotides for cDNA gene 1 cDNA gene 2 cDNA gene 3 cDNA gene 4 cDNA gene 5 each gene in a different well.
  • 19.
    the probes areattached to a solid surface by a covalent bond to a chemical matrix (via epoxy-silane, amino-silane, lysine, polyacrylamide or others). The solid surface can be glass or a silicon chip
  • 20.
    Step 2: ExtractmRNA from biological tissues subjected to an experimental treatment and from the same tissue subjected to a control treatment. Or from normal and from pathological tissue
  • 21.
    • Step 3-Make single-stranded DNA from the mRNA using “color coded” nucleotides.
  • 22.
    Extract mRNA fromControl Cells Extract mRNA from Experimental/pathological Cells Make single-stranded cDNA using green nucleotides (e.g. Quantum dots) Make single-stranded cDNA using red nucleotides (e.g. Quantum dots) cDNA = complementary DNA (DNA synthesized from RNA)
  • 23.
    Step 4: Aftermaking many DNA copies of the RNA, extract an equal amount of cDNA from the controls & experimentals and place it into a container.
  • 24.
  • 25.
    Step 5: Extracta small amount in a pipette.
  • 26.
    Step 6: Insertinto first well.
  • 27.
    … insert into second well, etc. Step 7: Extract more cDNA and …
  • 28.
    Step 8: Continueuntil all wells are filled.
  • 29.
    Step 9: Allowto hybridize, then wash away all single-stranded DNA.
  • 30.
    Result: (1) Somewells have no color-coded cDNA (no mRNA in either type of cell) (2) Some wells have only red (i.e., expressed only in experimental cells) (3) Some wells have only green (i.e., expressed only in control cells) (4) Some wells have both red and green in various mixtures (expressed in both experimental and control cells)
  • 31.
    Step 10: Scanwith a laser set to detect the color & process results on computer.
  • 32.
    Results: The colorsdenote the degree of expression in the experimental versus the control cells. Gene not expressed in control or in experimental cells Only in control cells Mostly in control cells Only in experimental cells Mostly in experimental cells Same in both cells