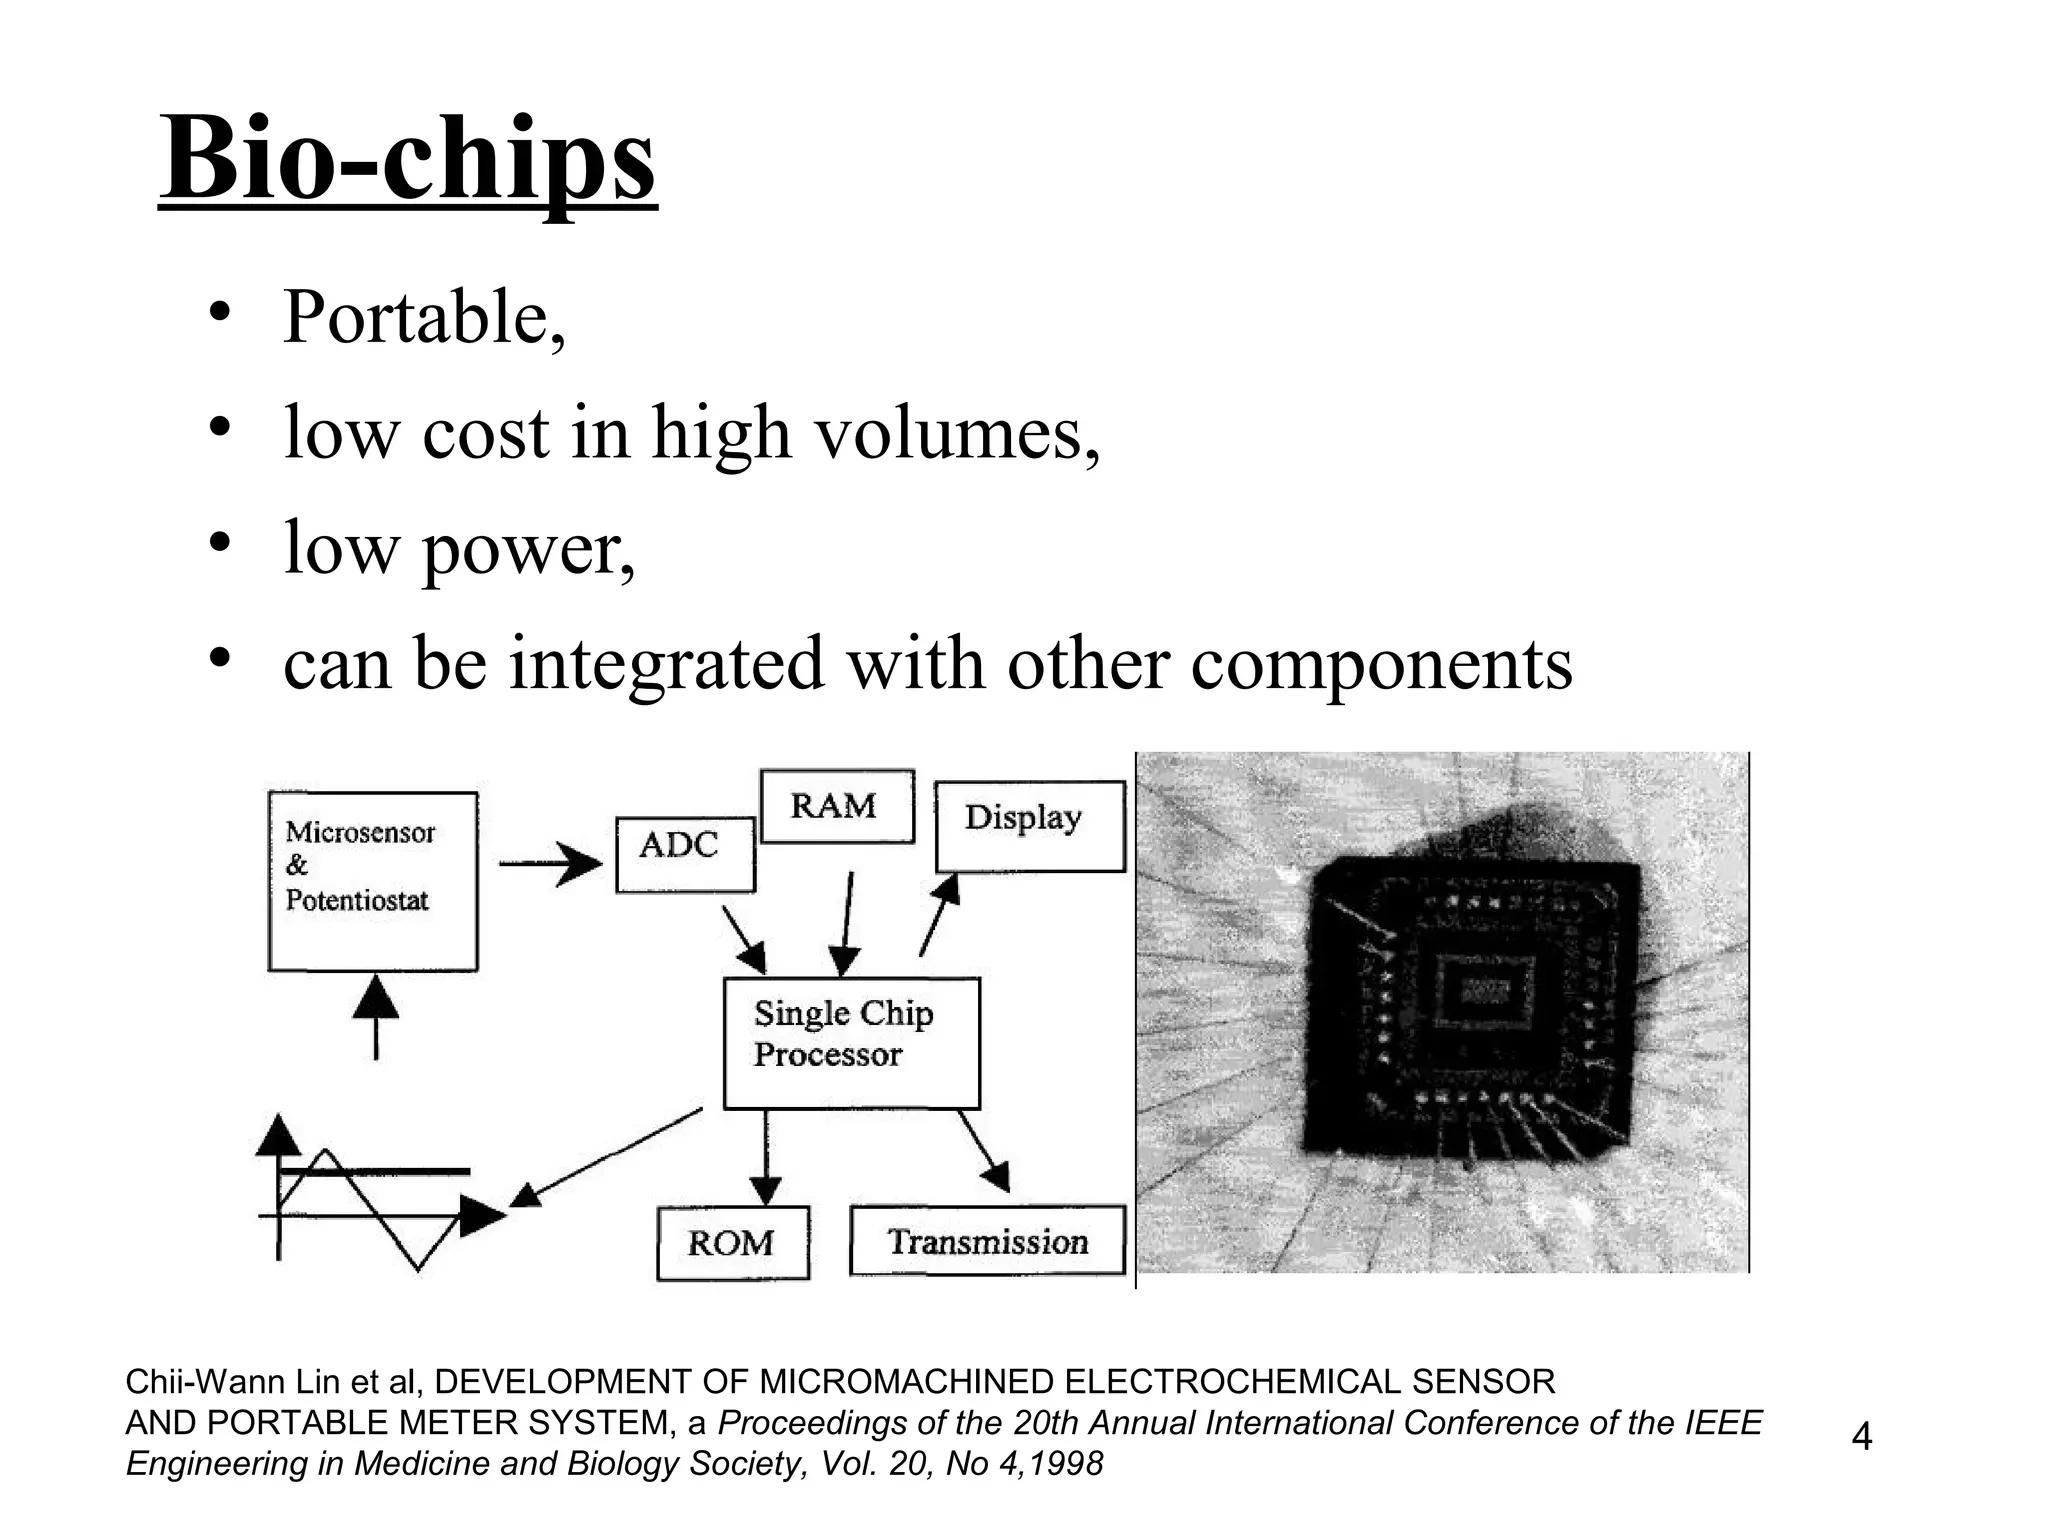
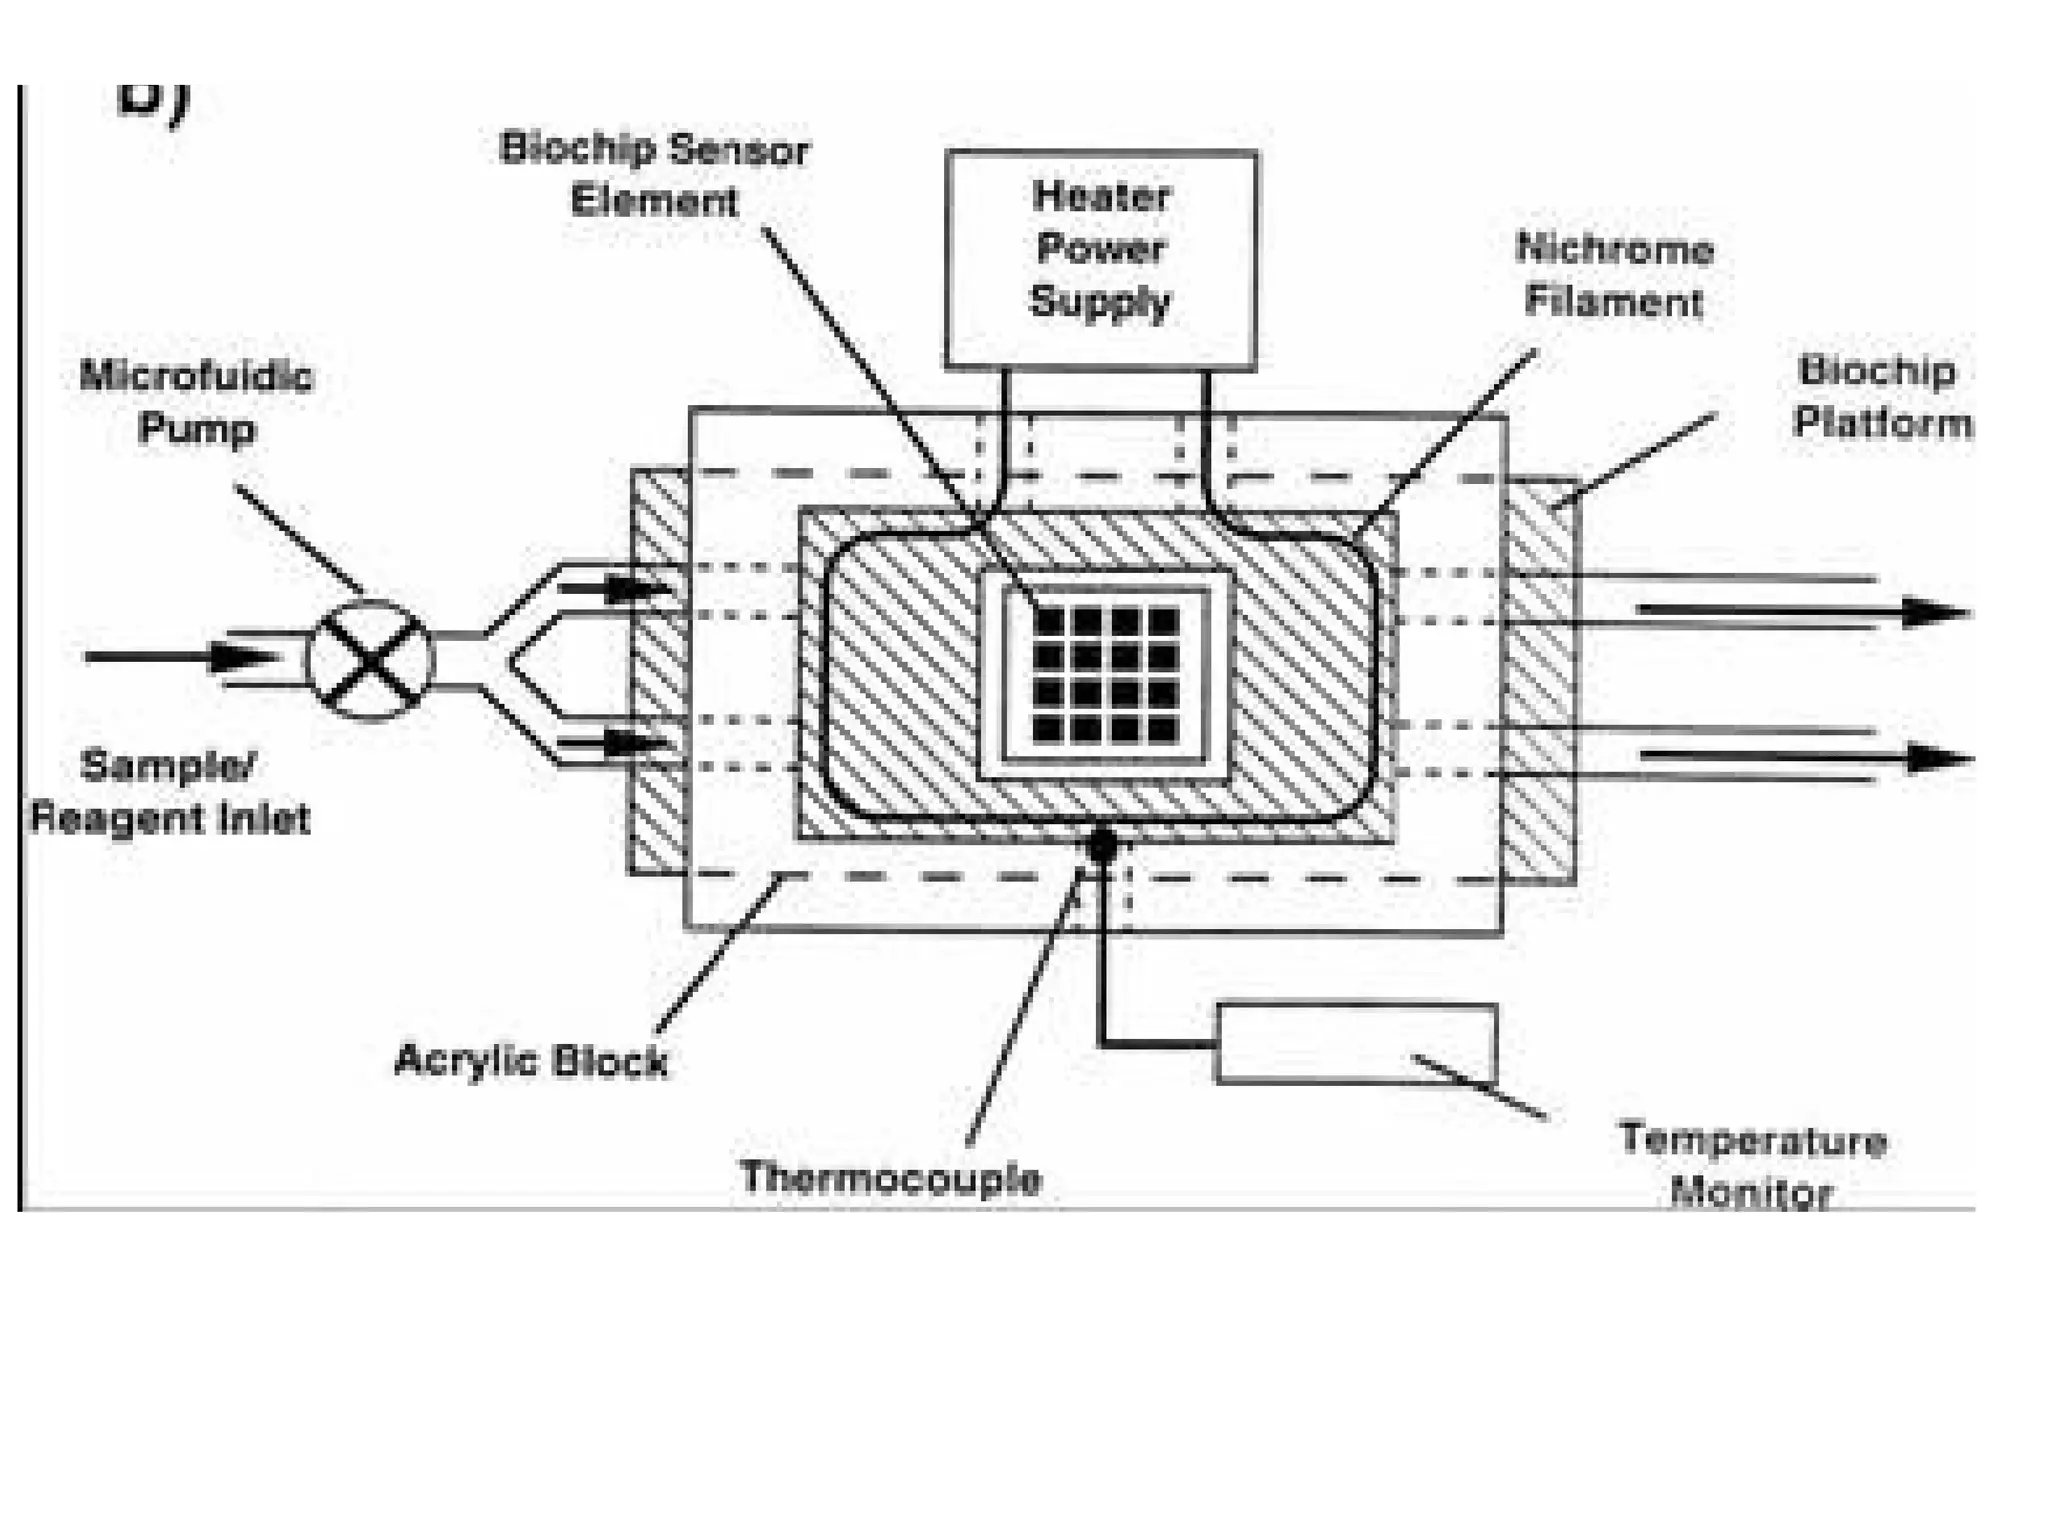
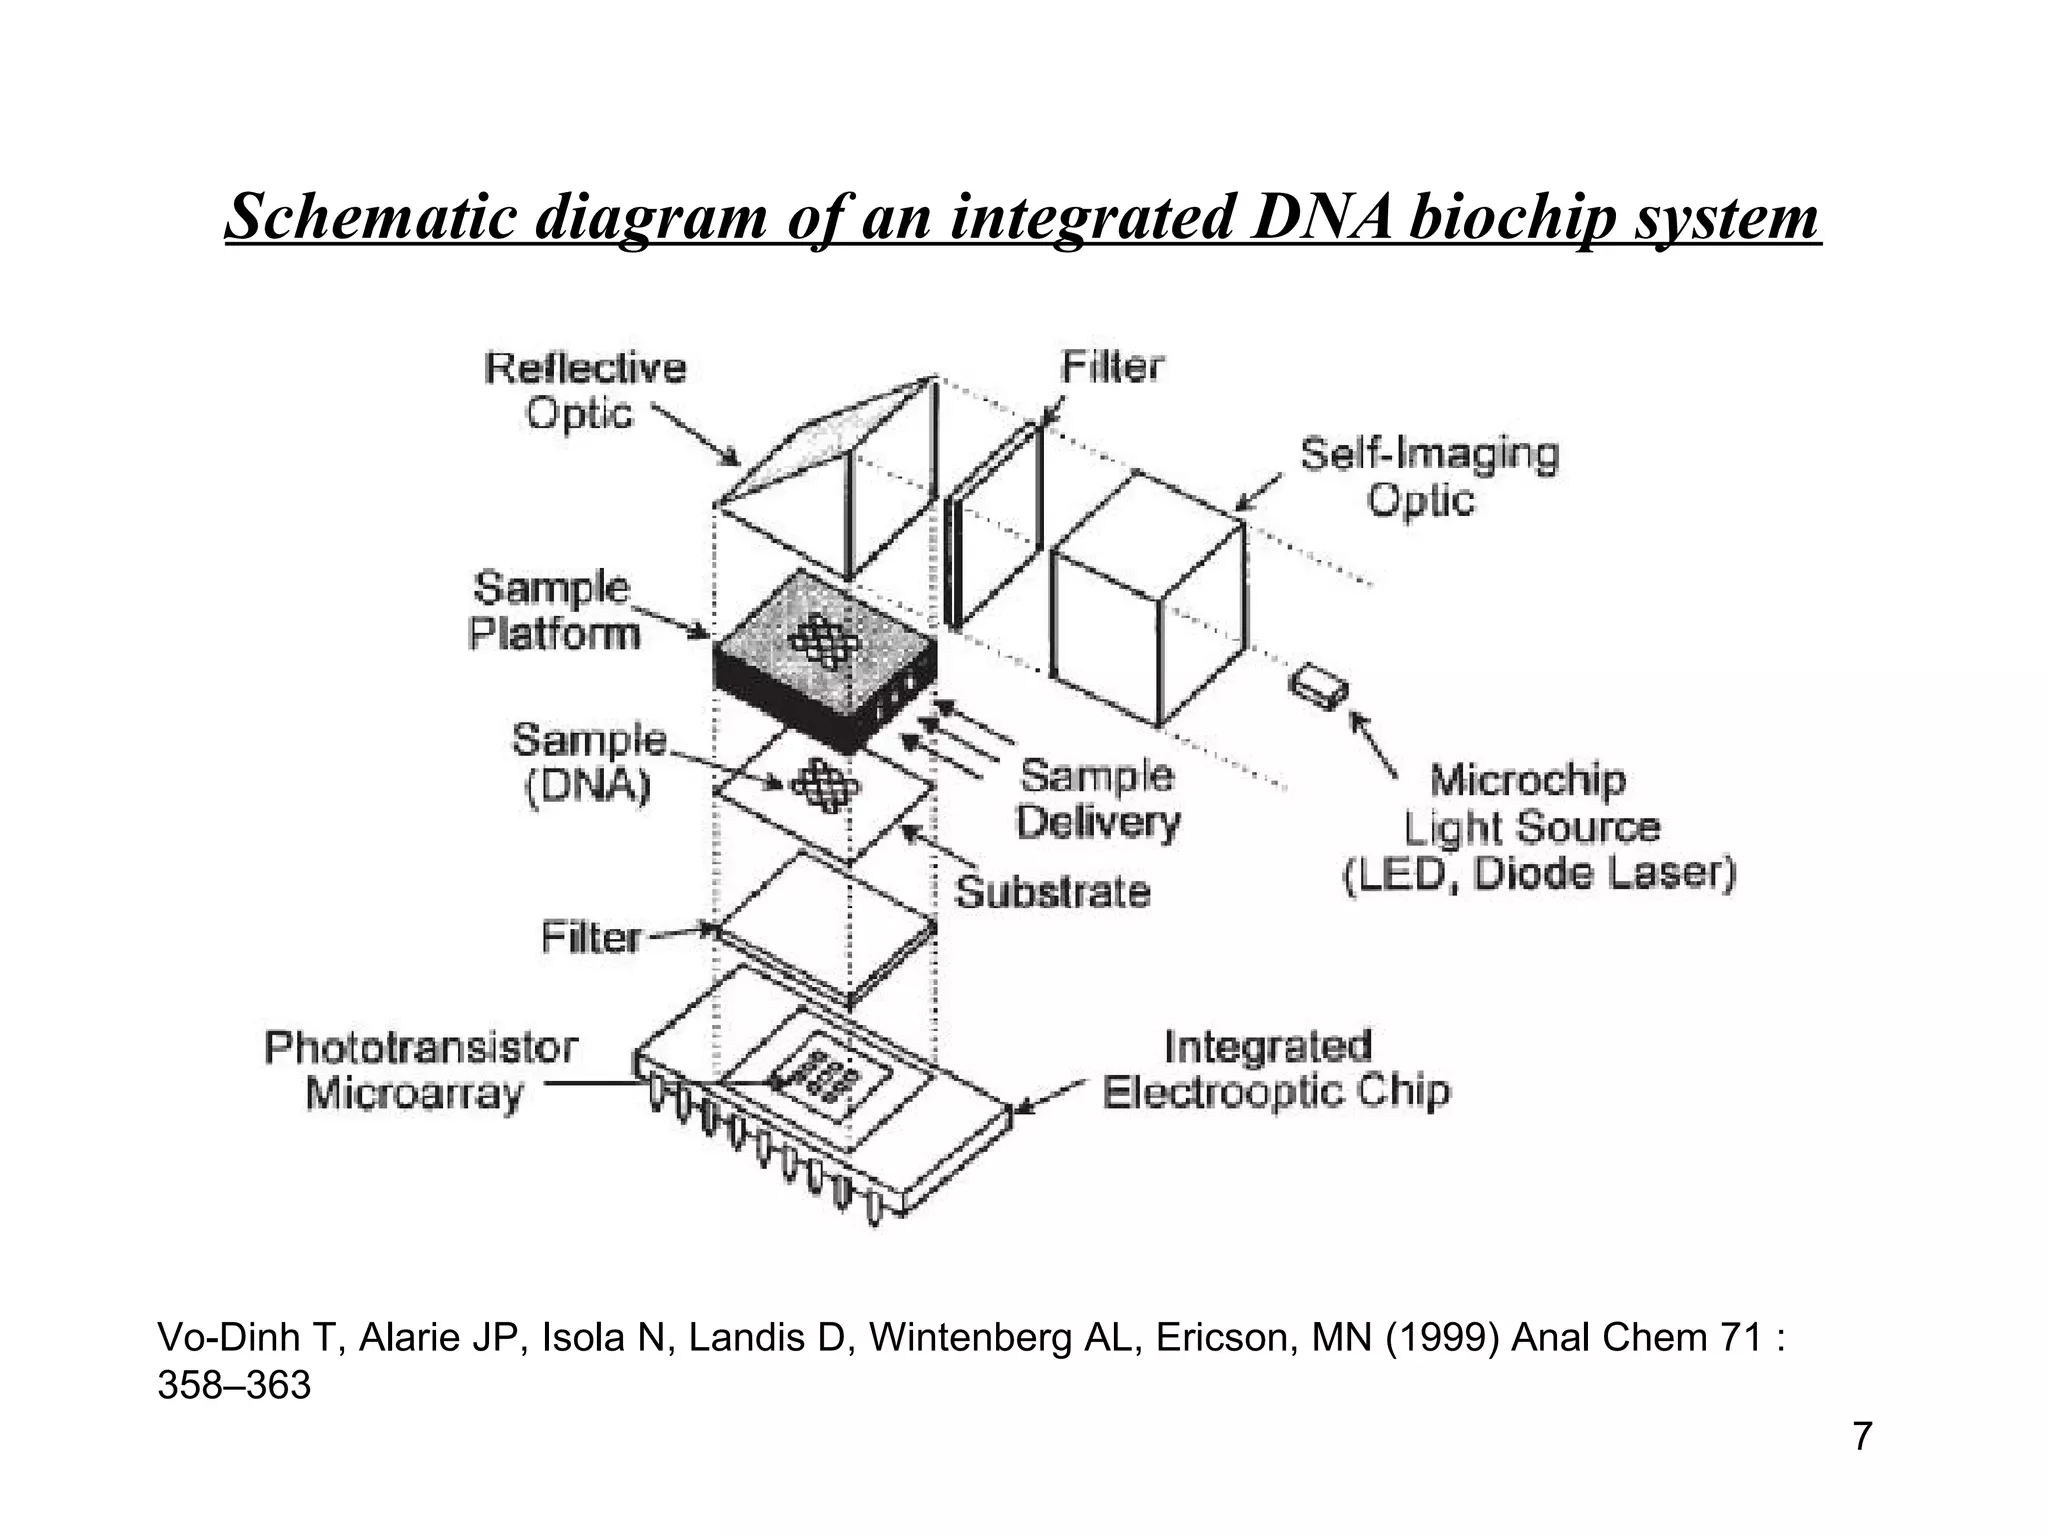
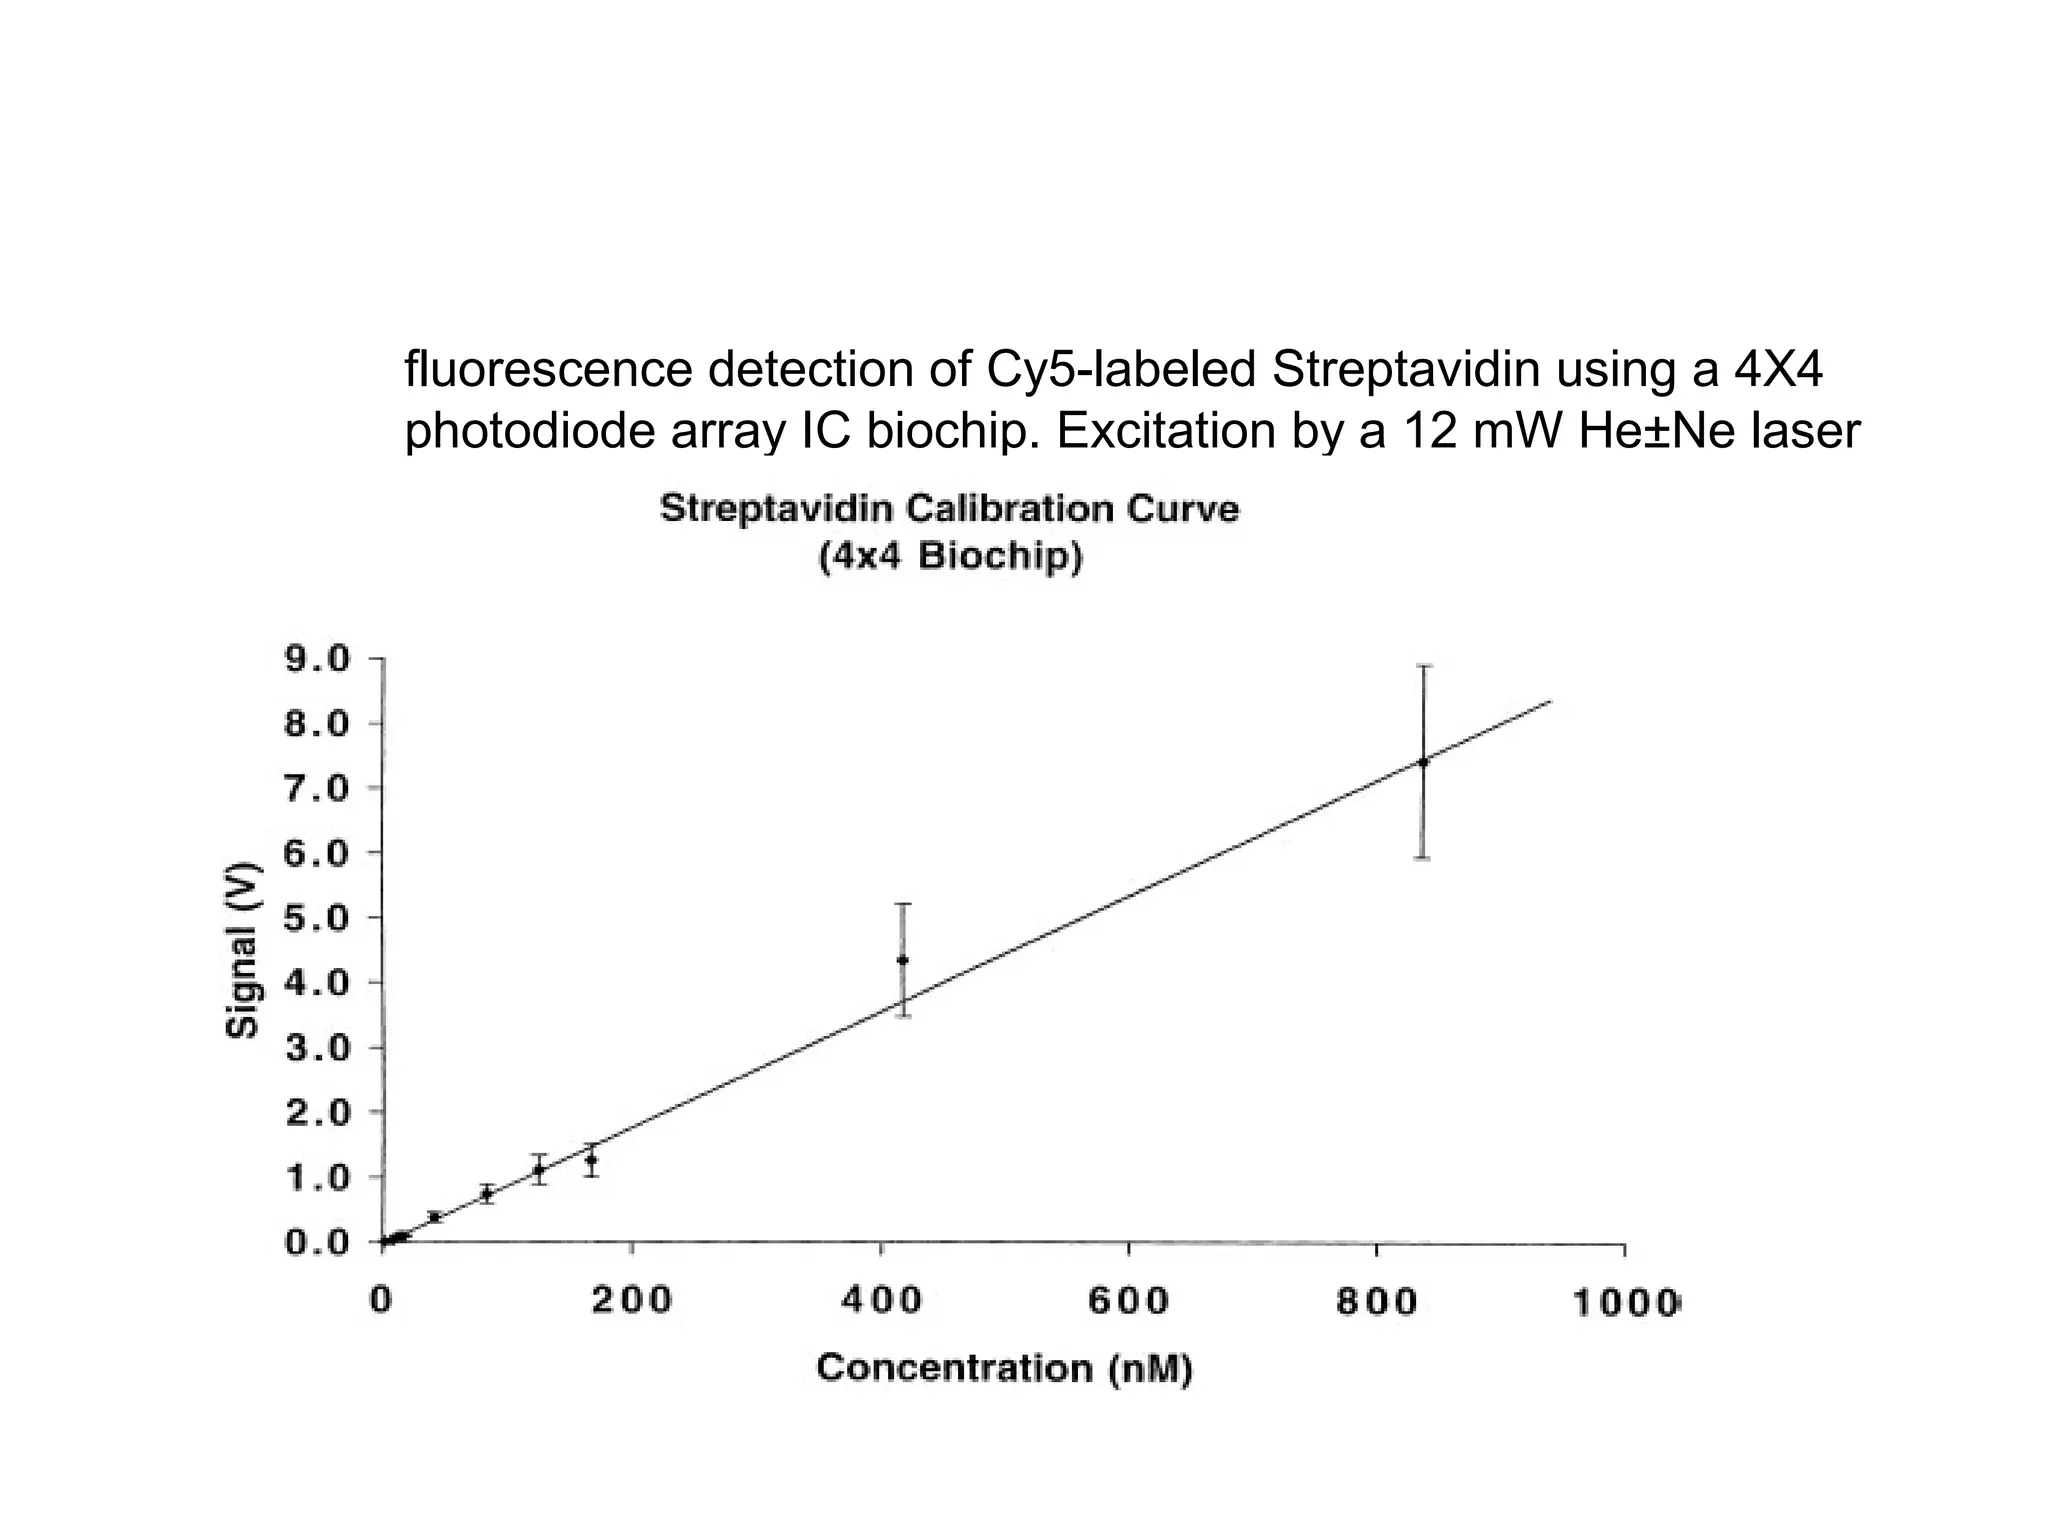
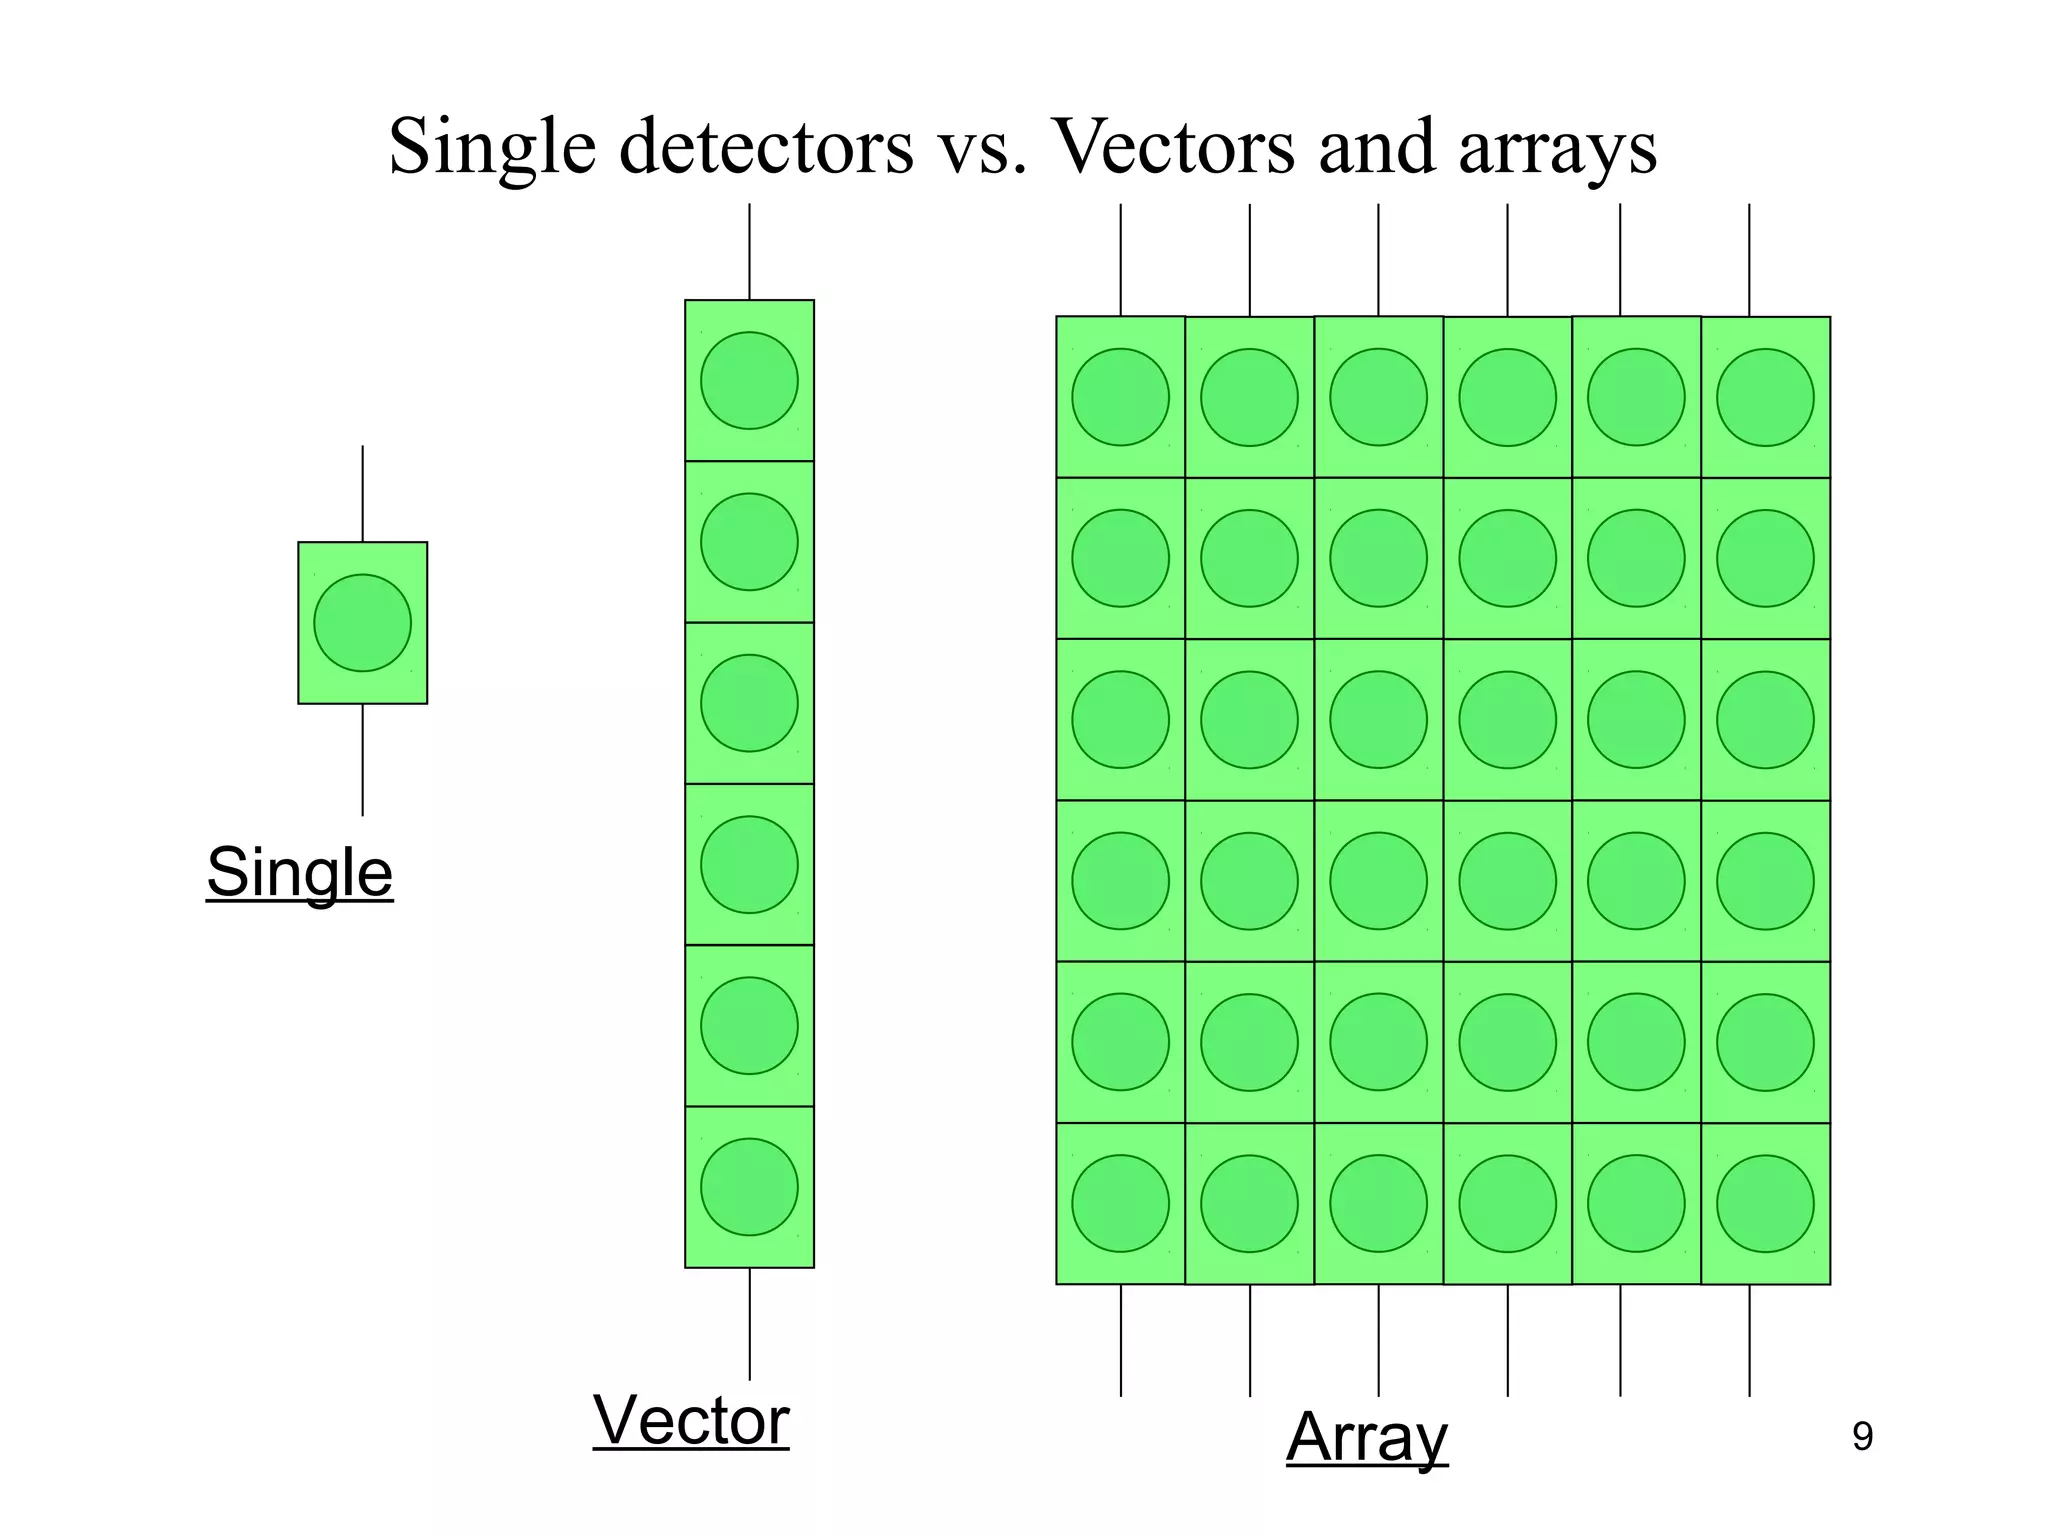
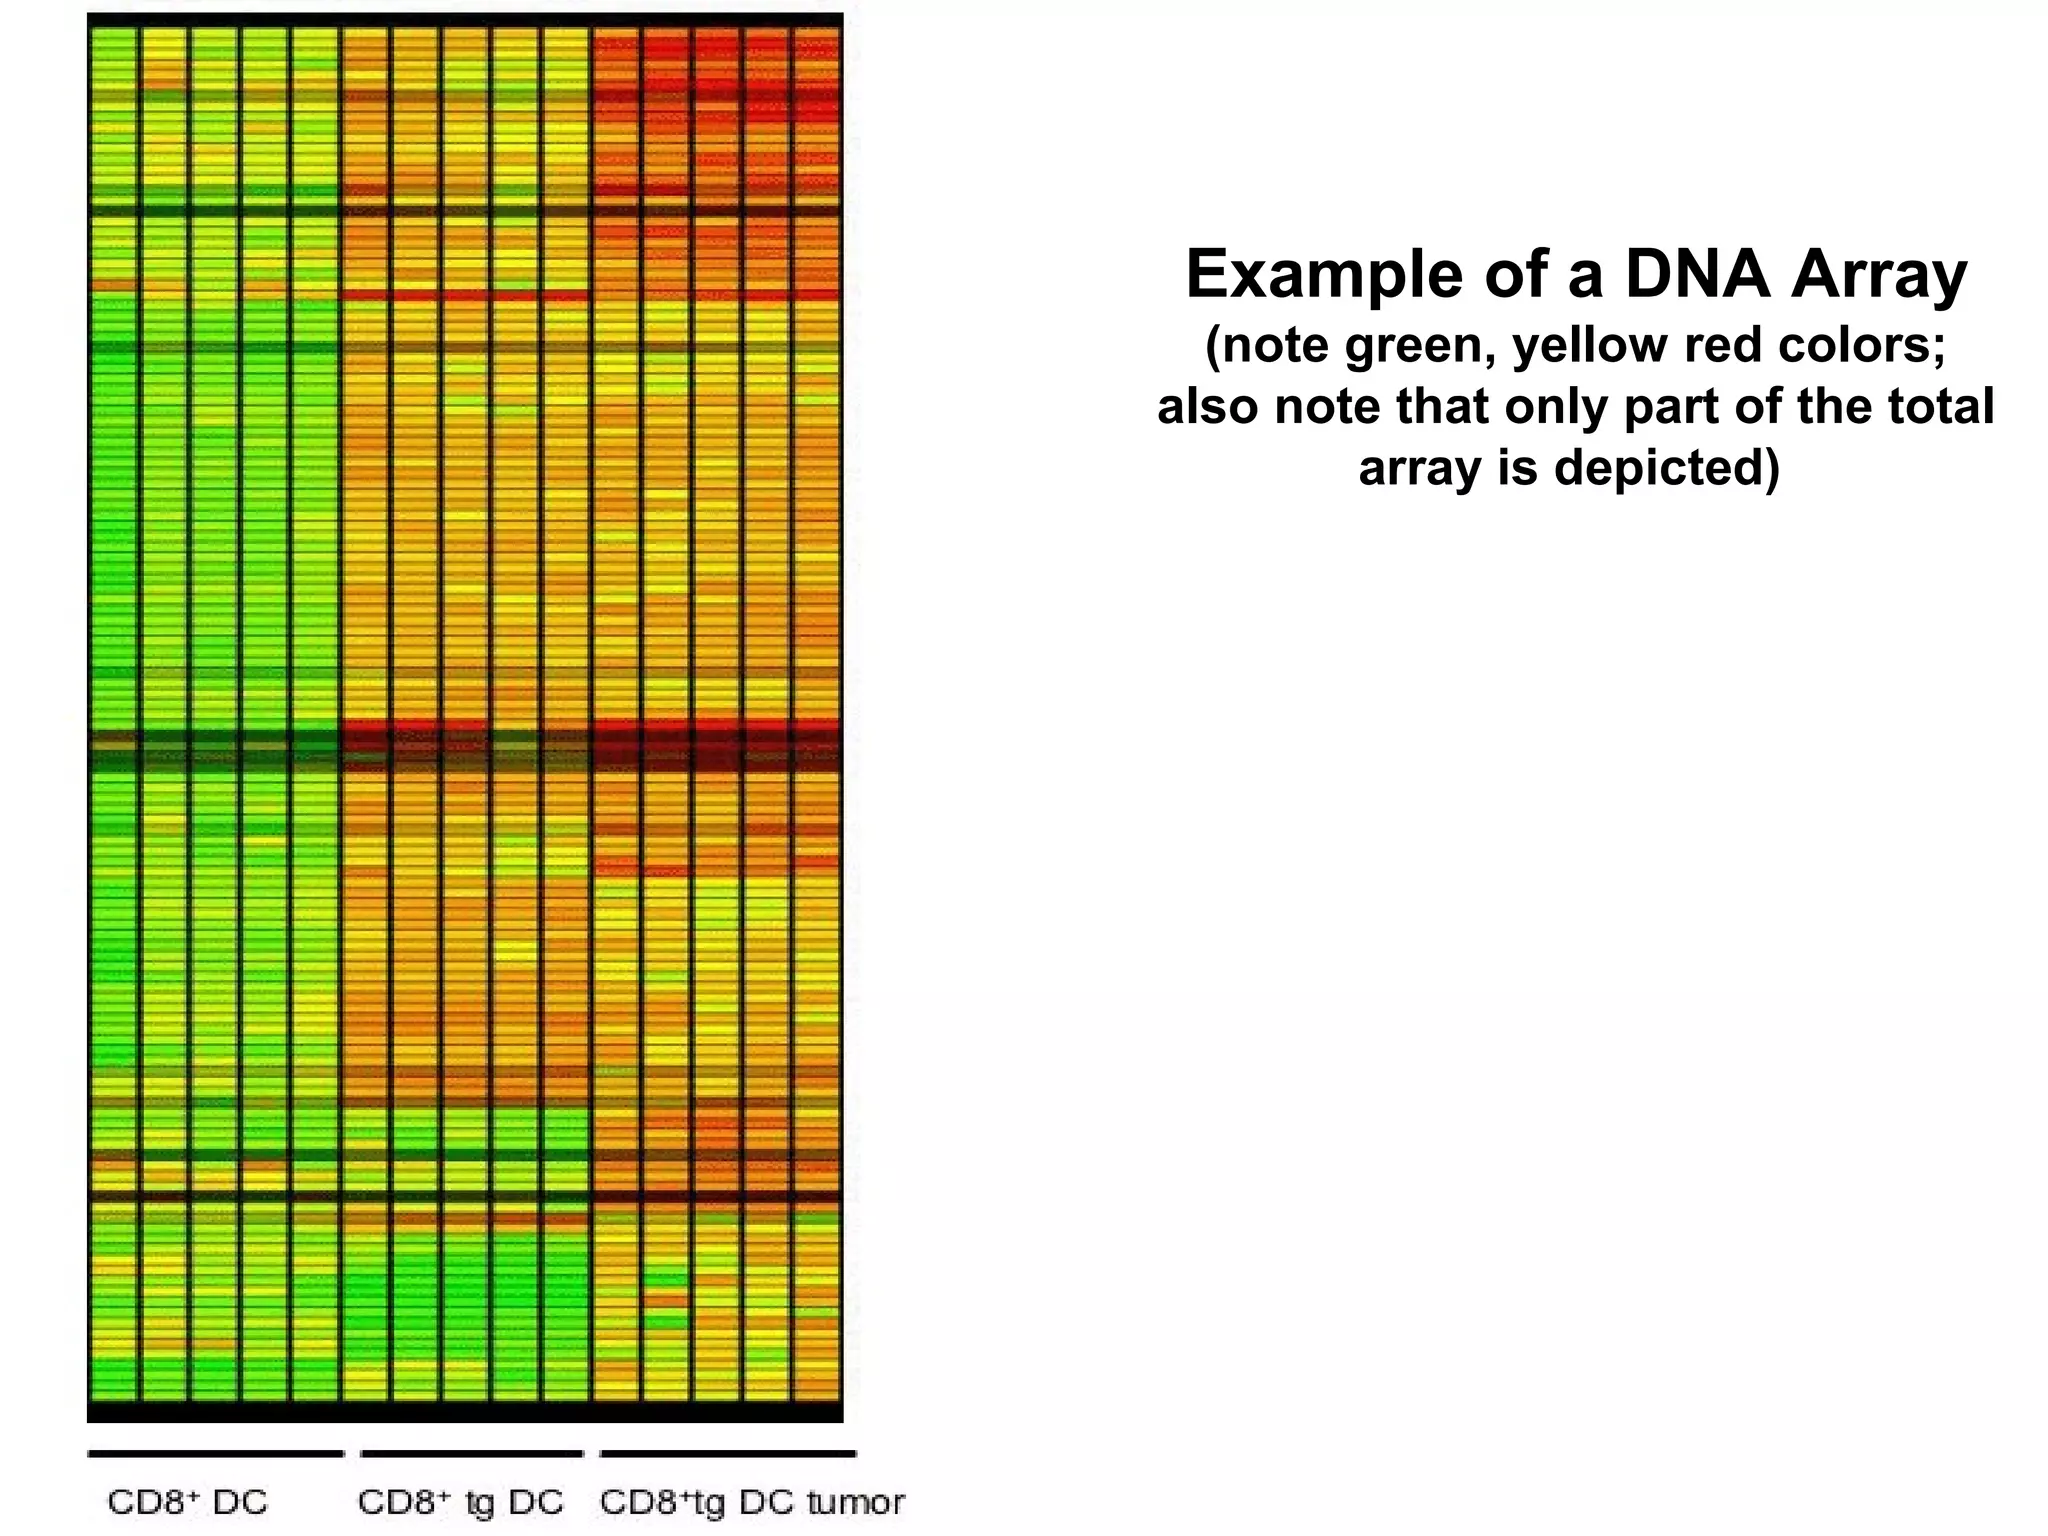
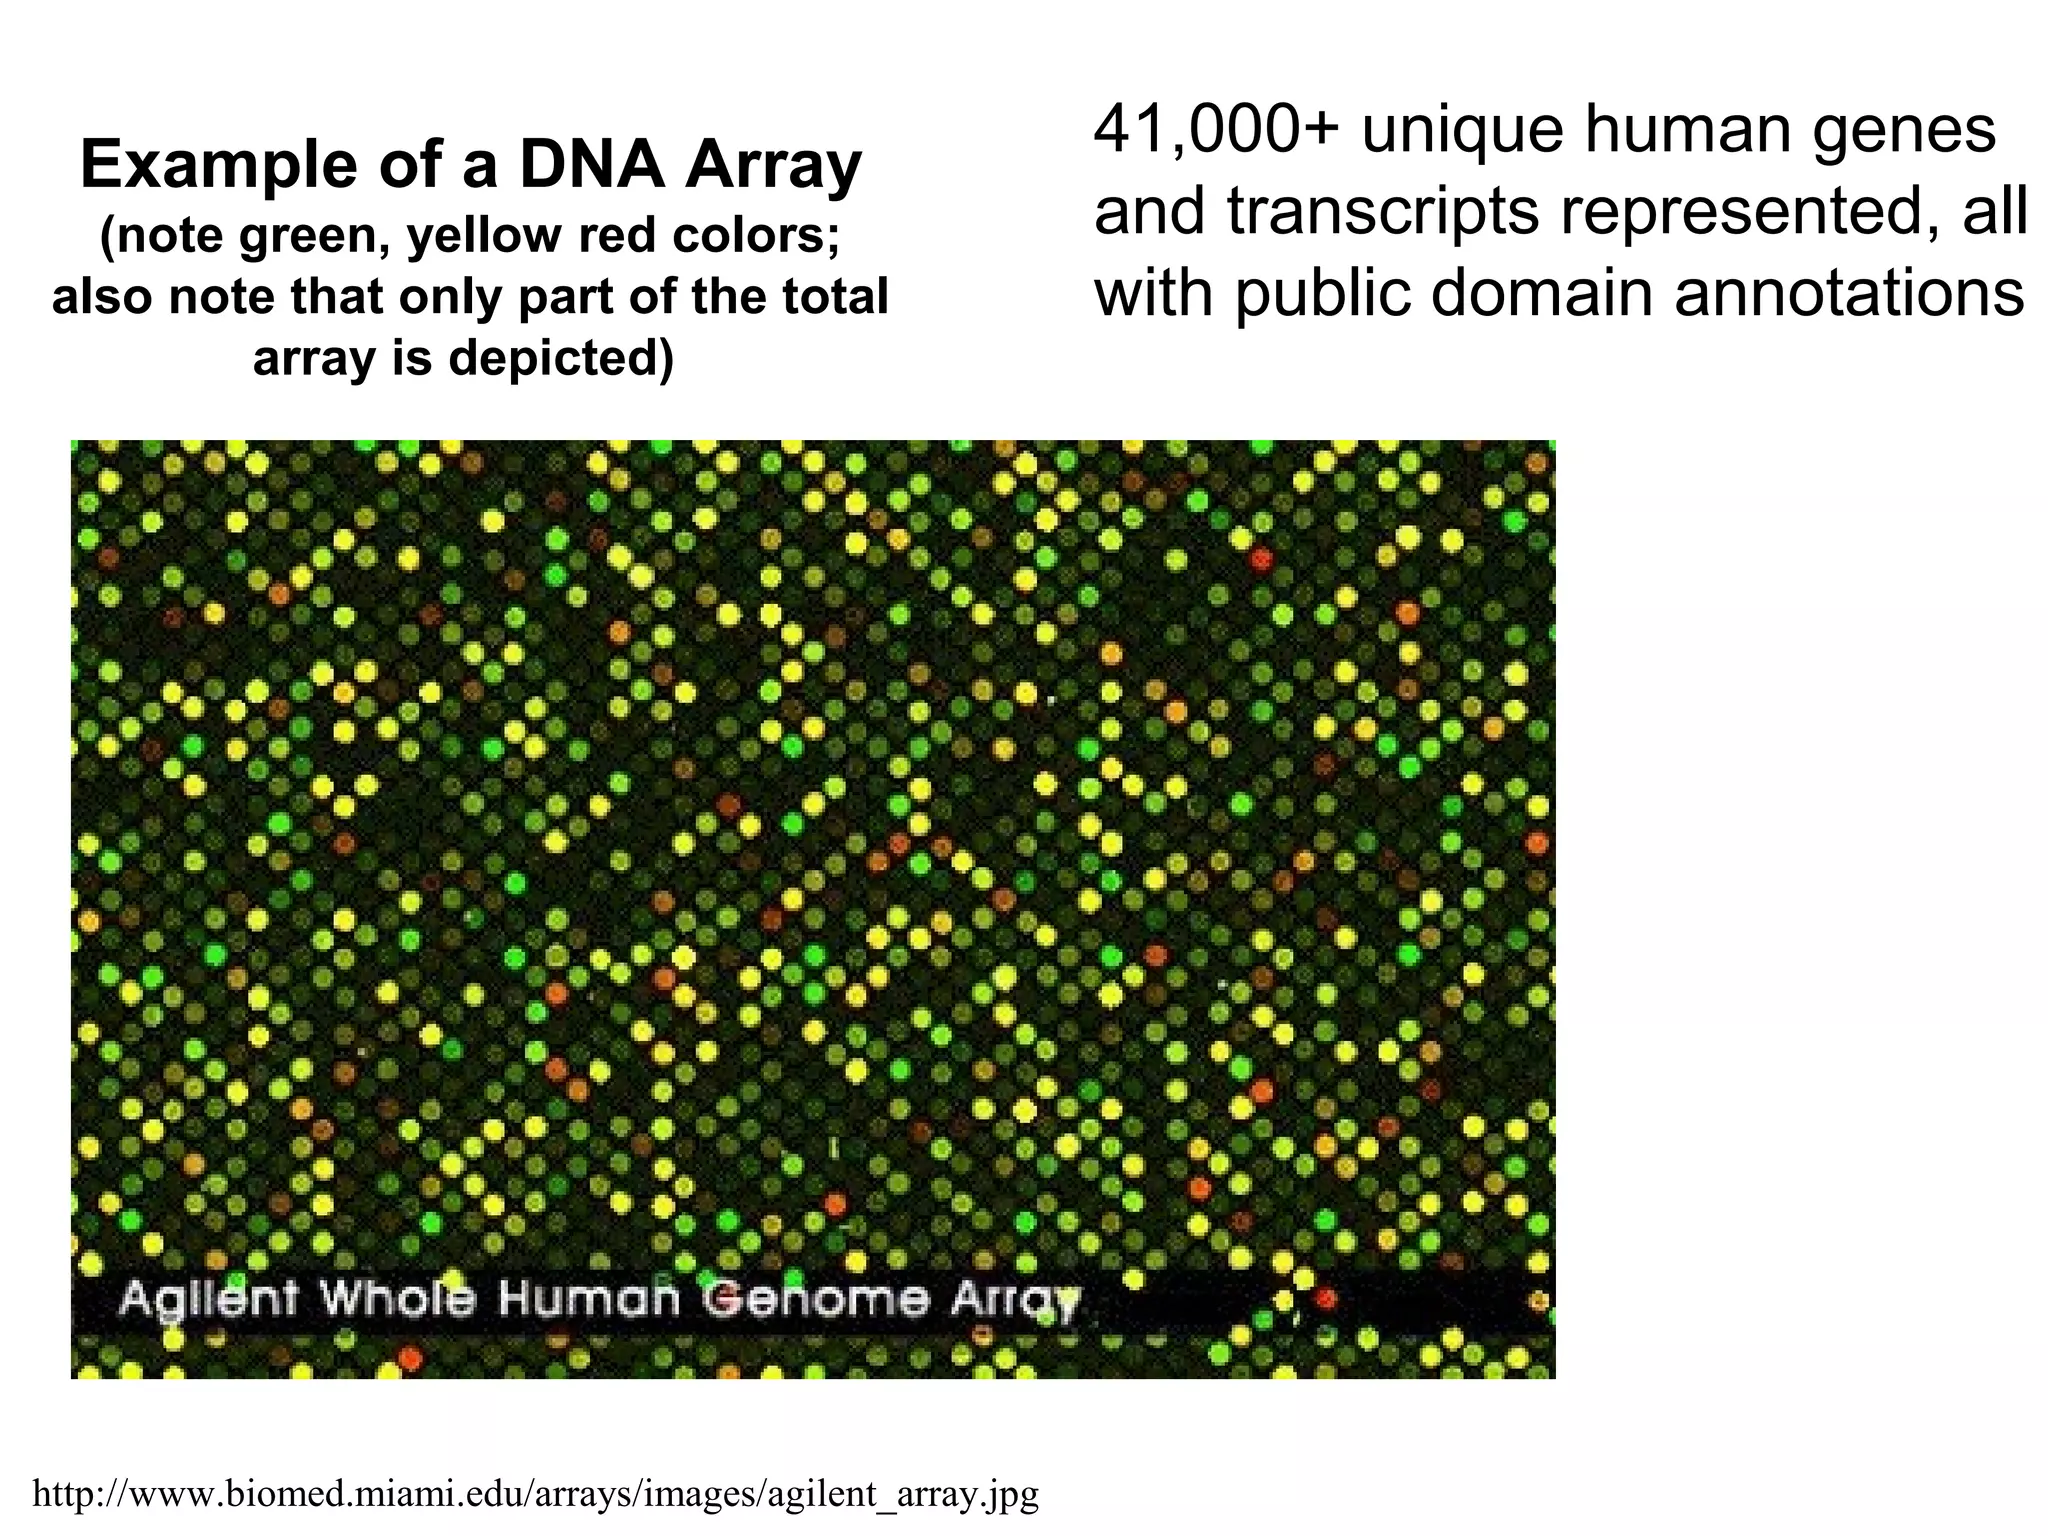
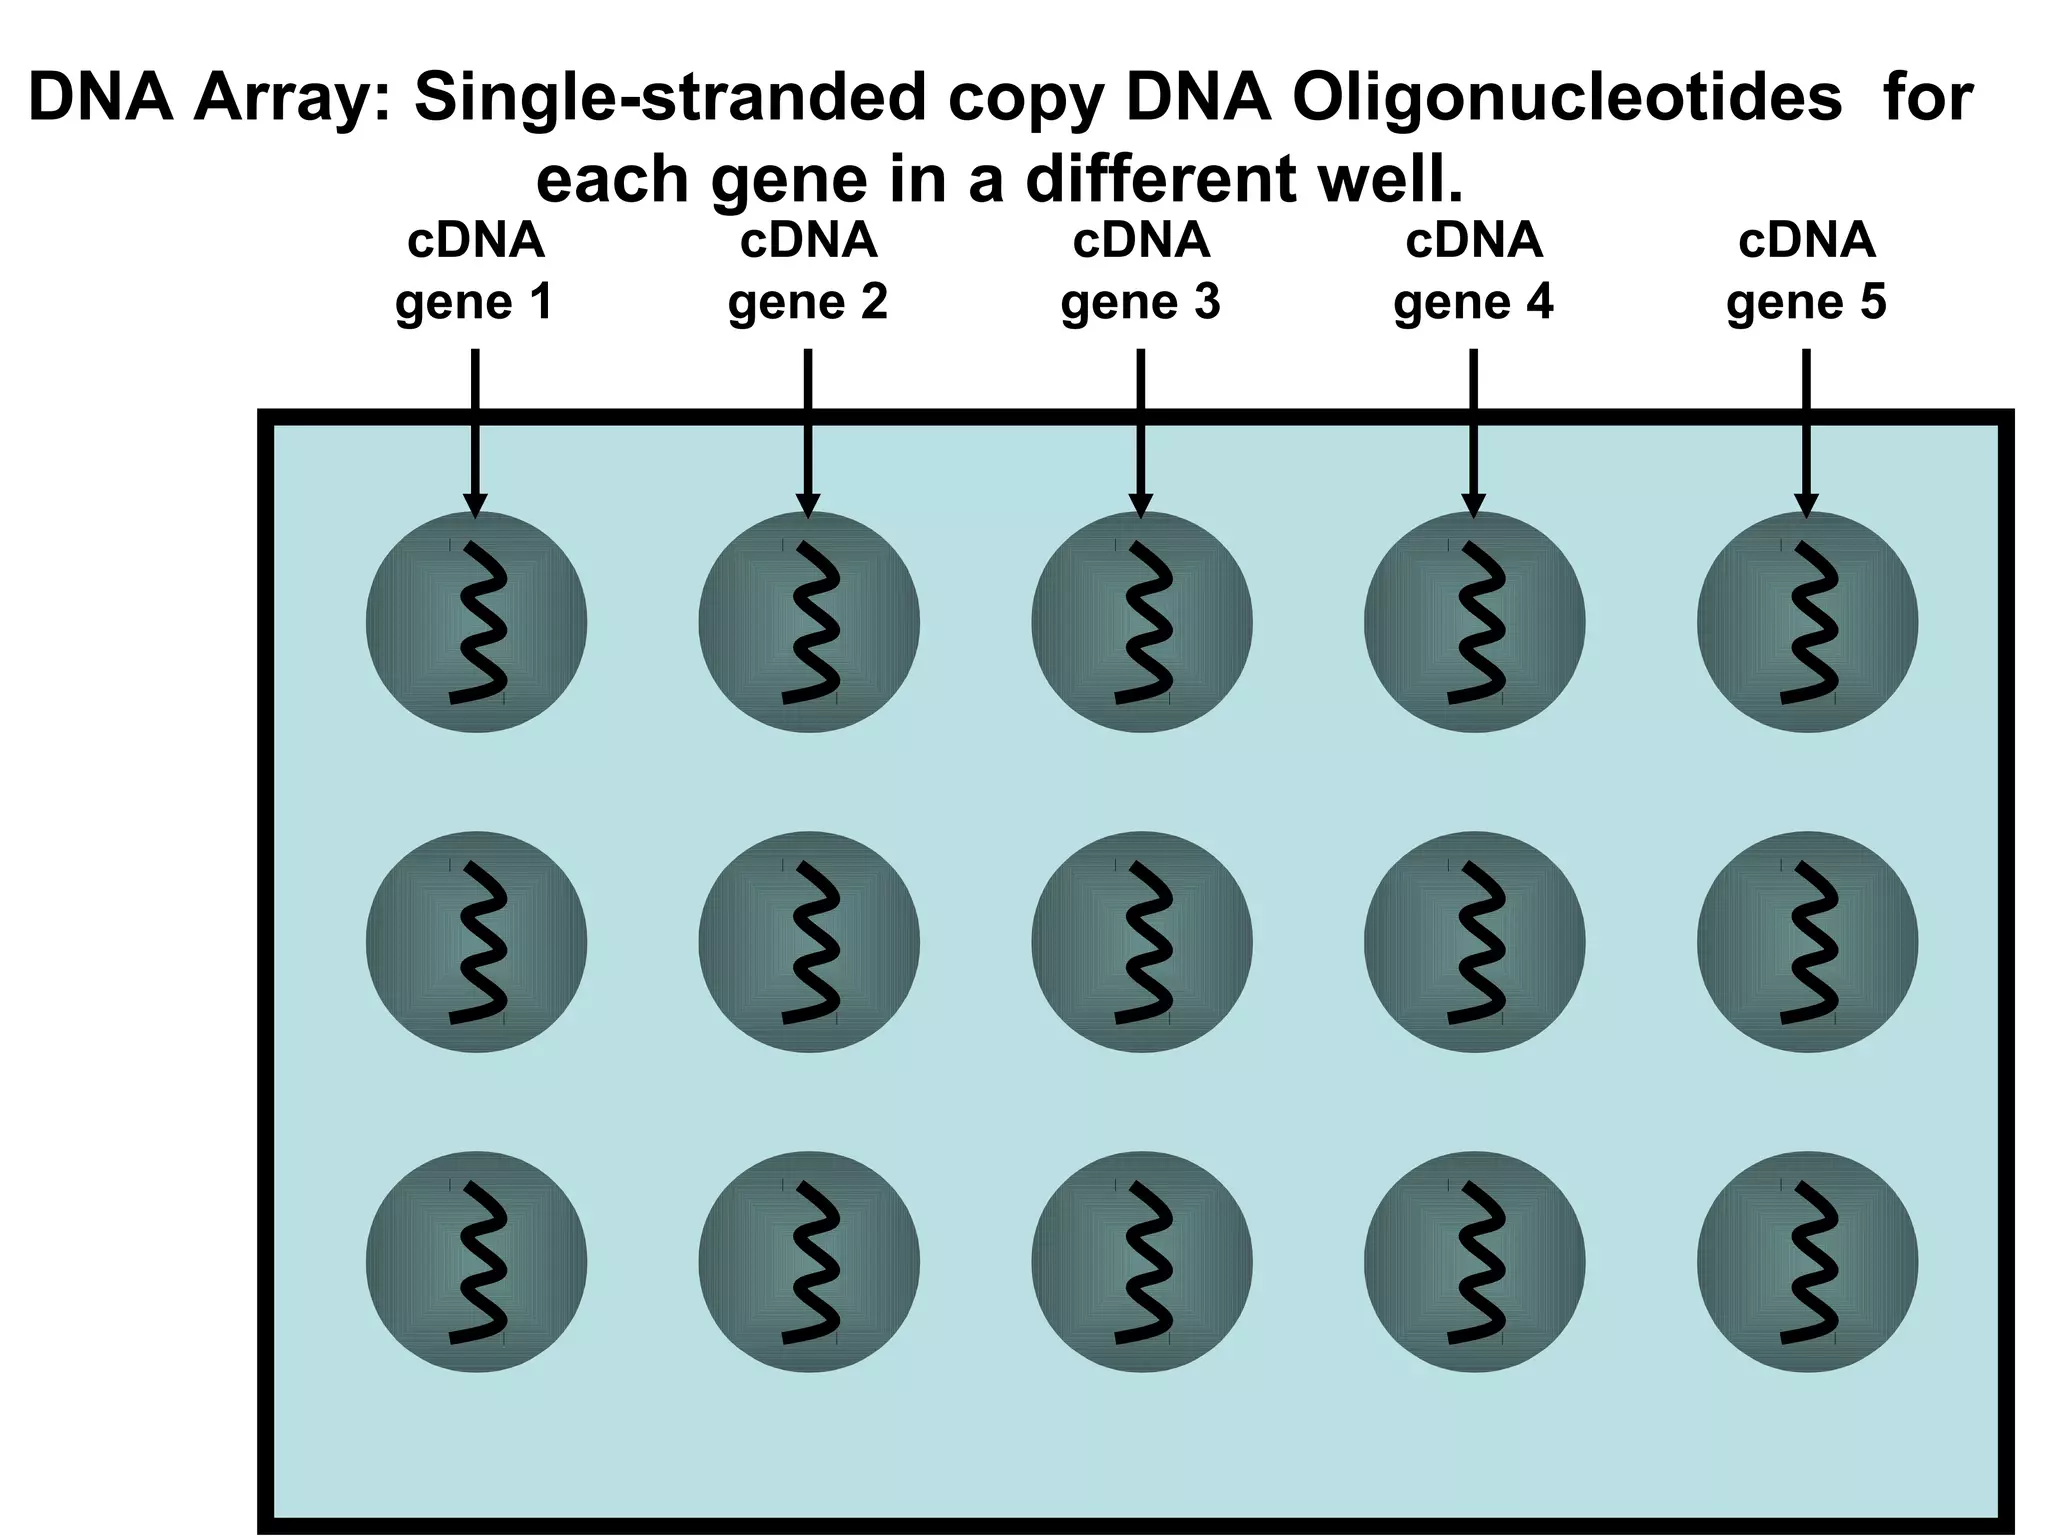
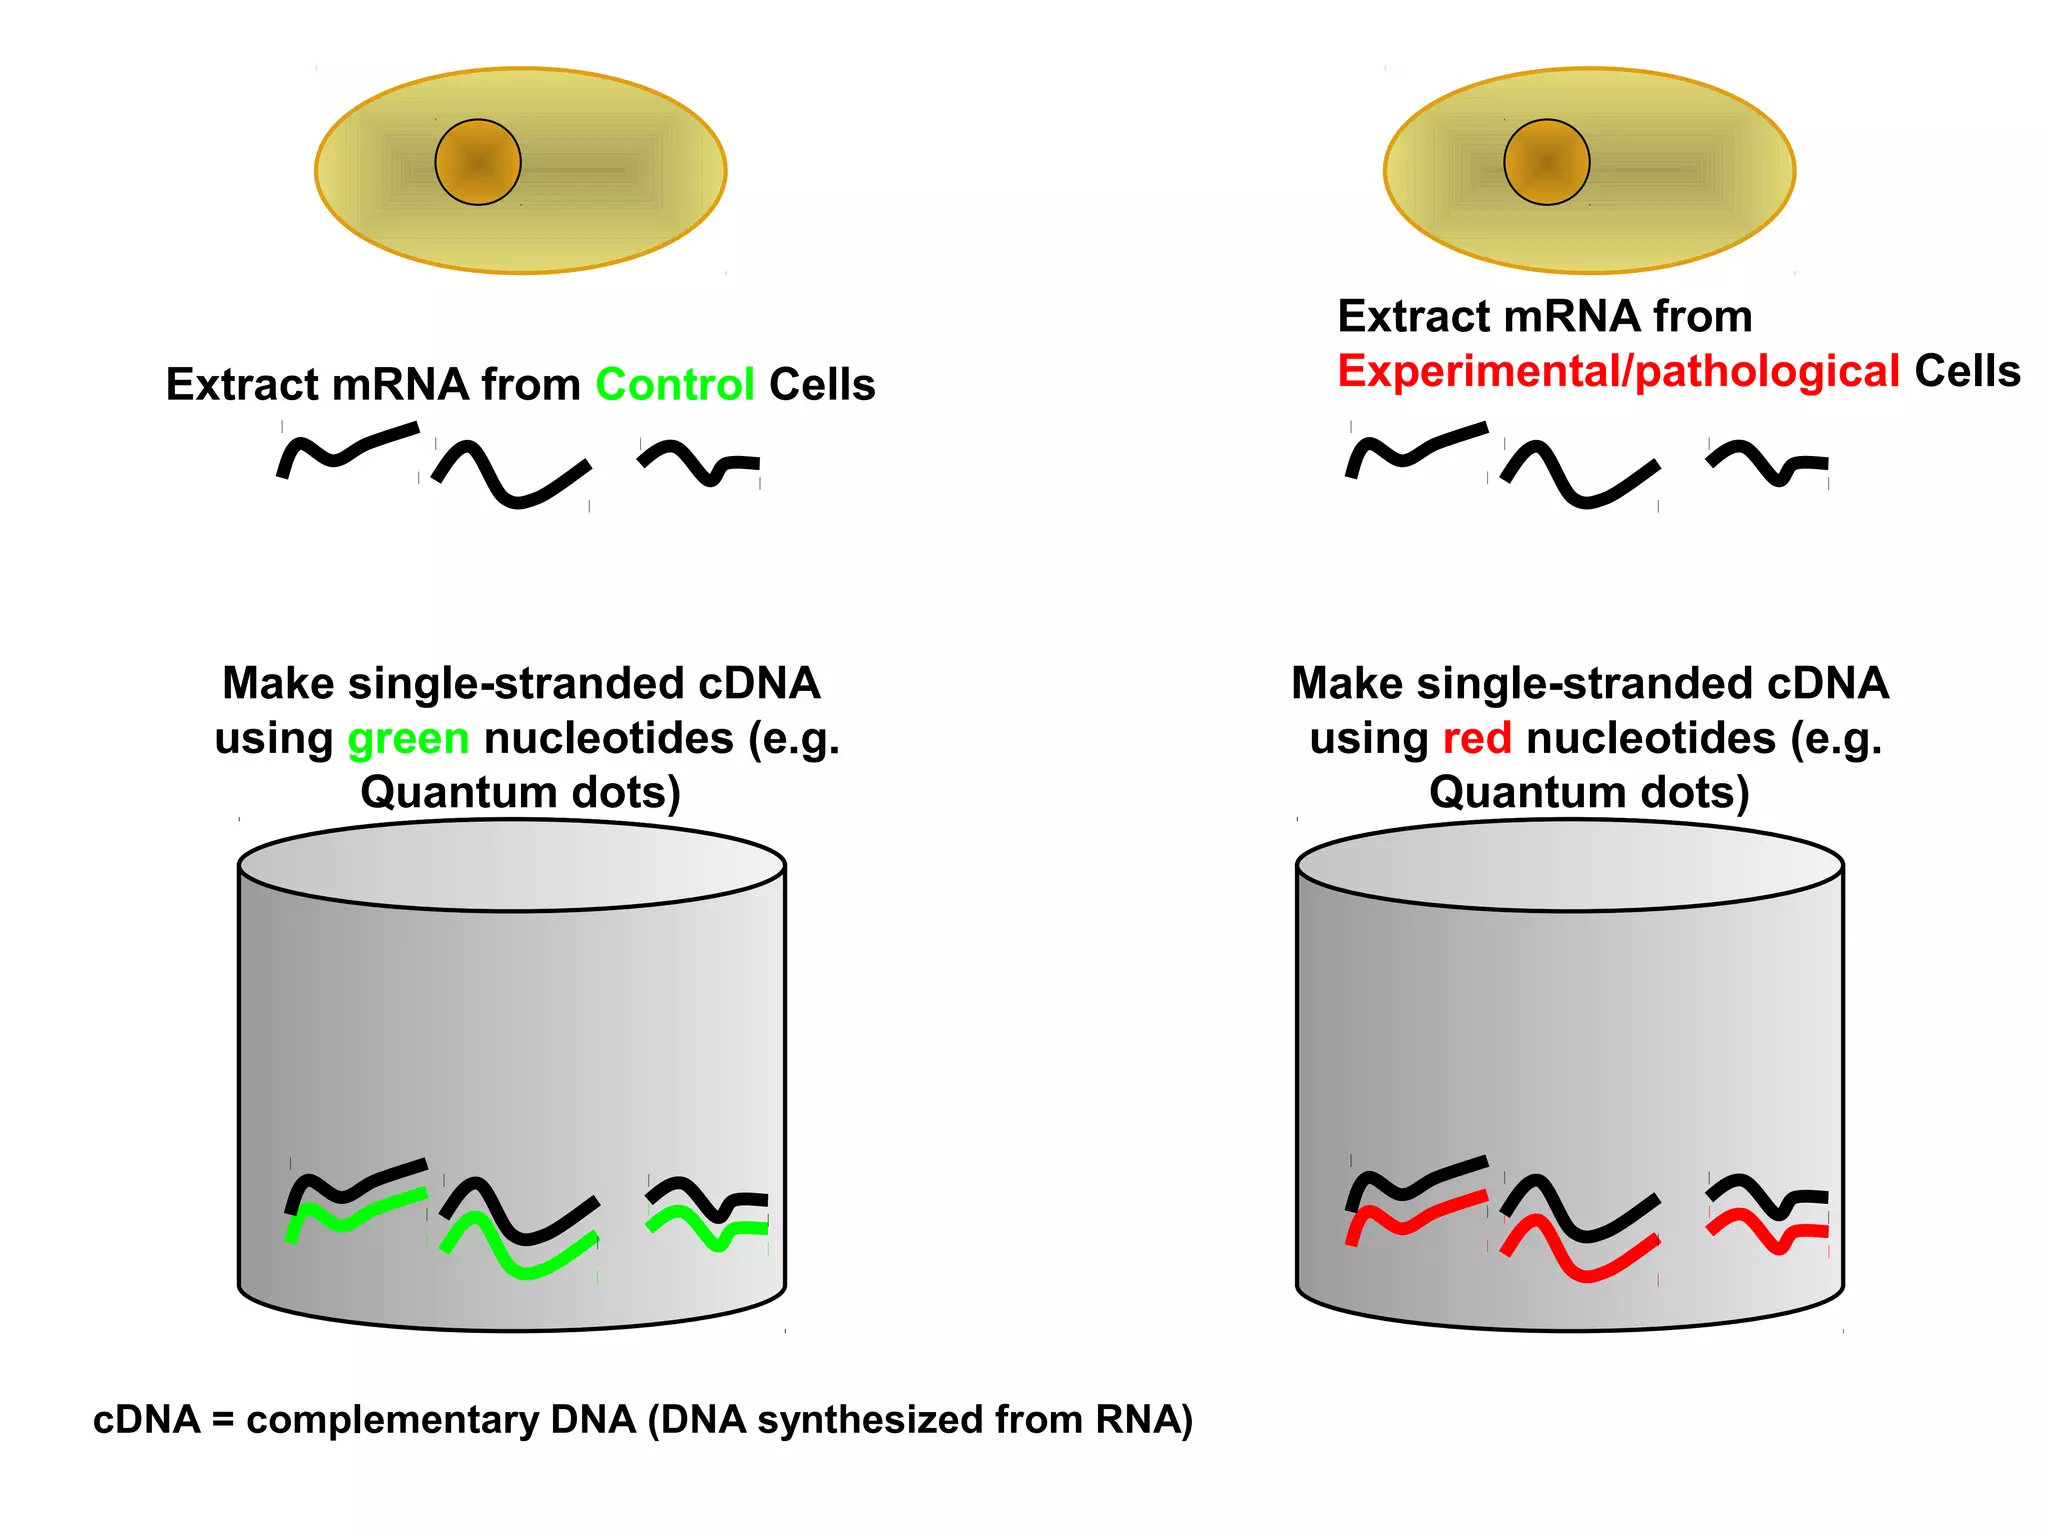
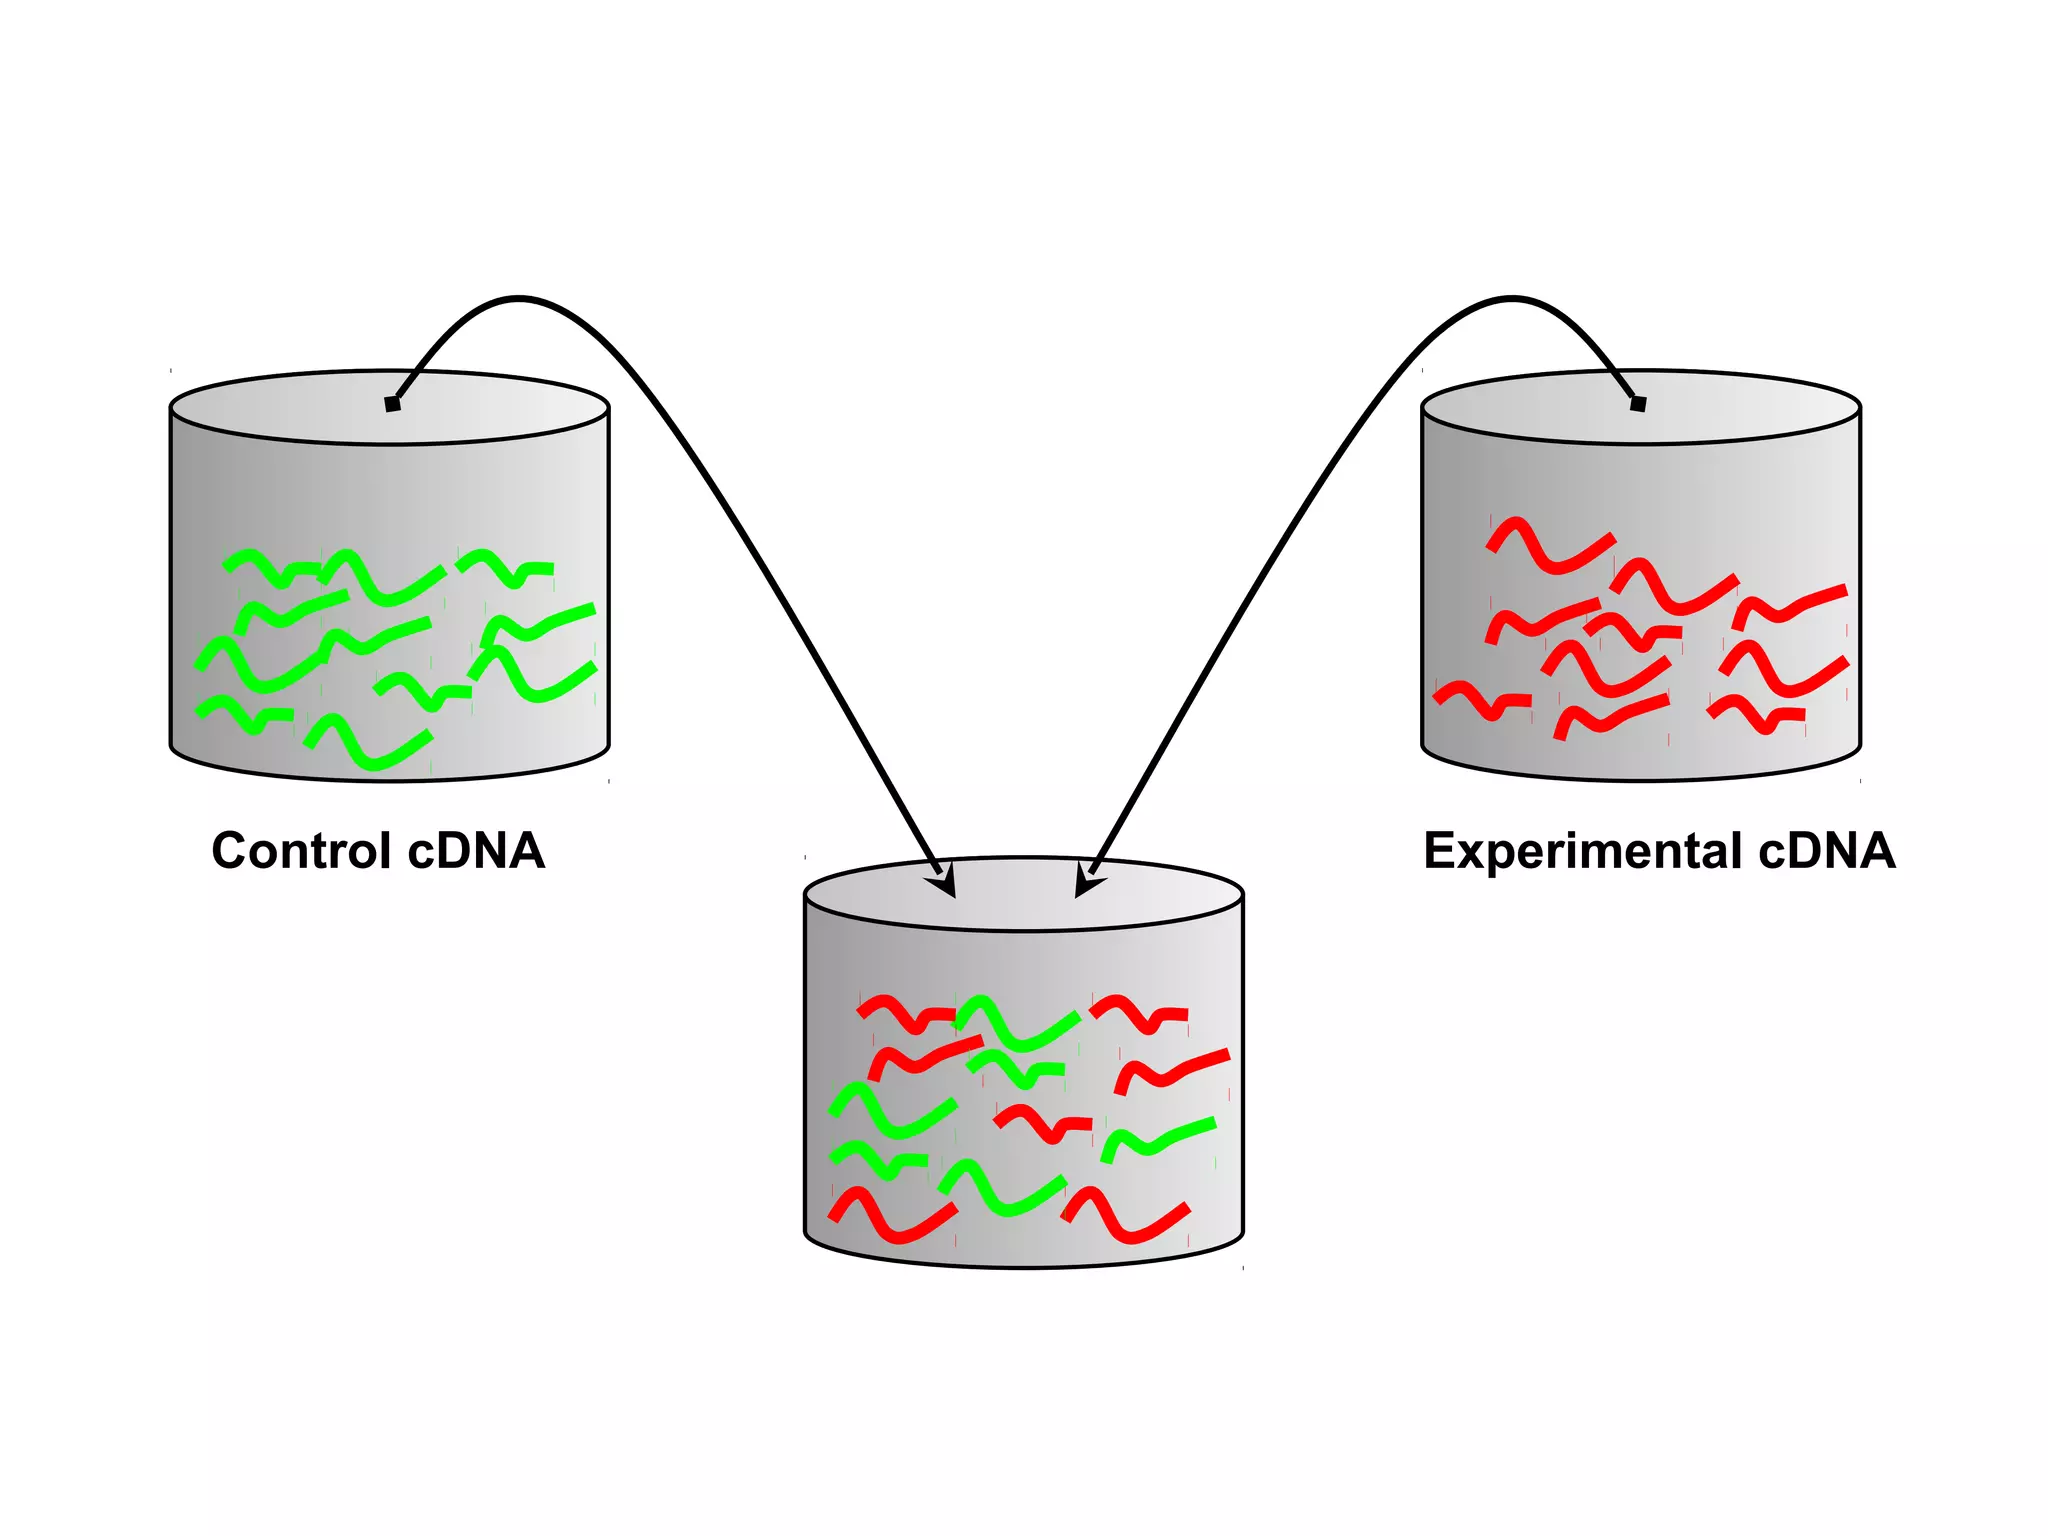
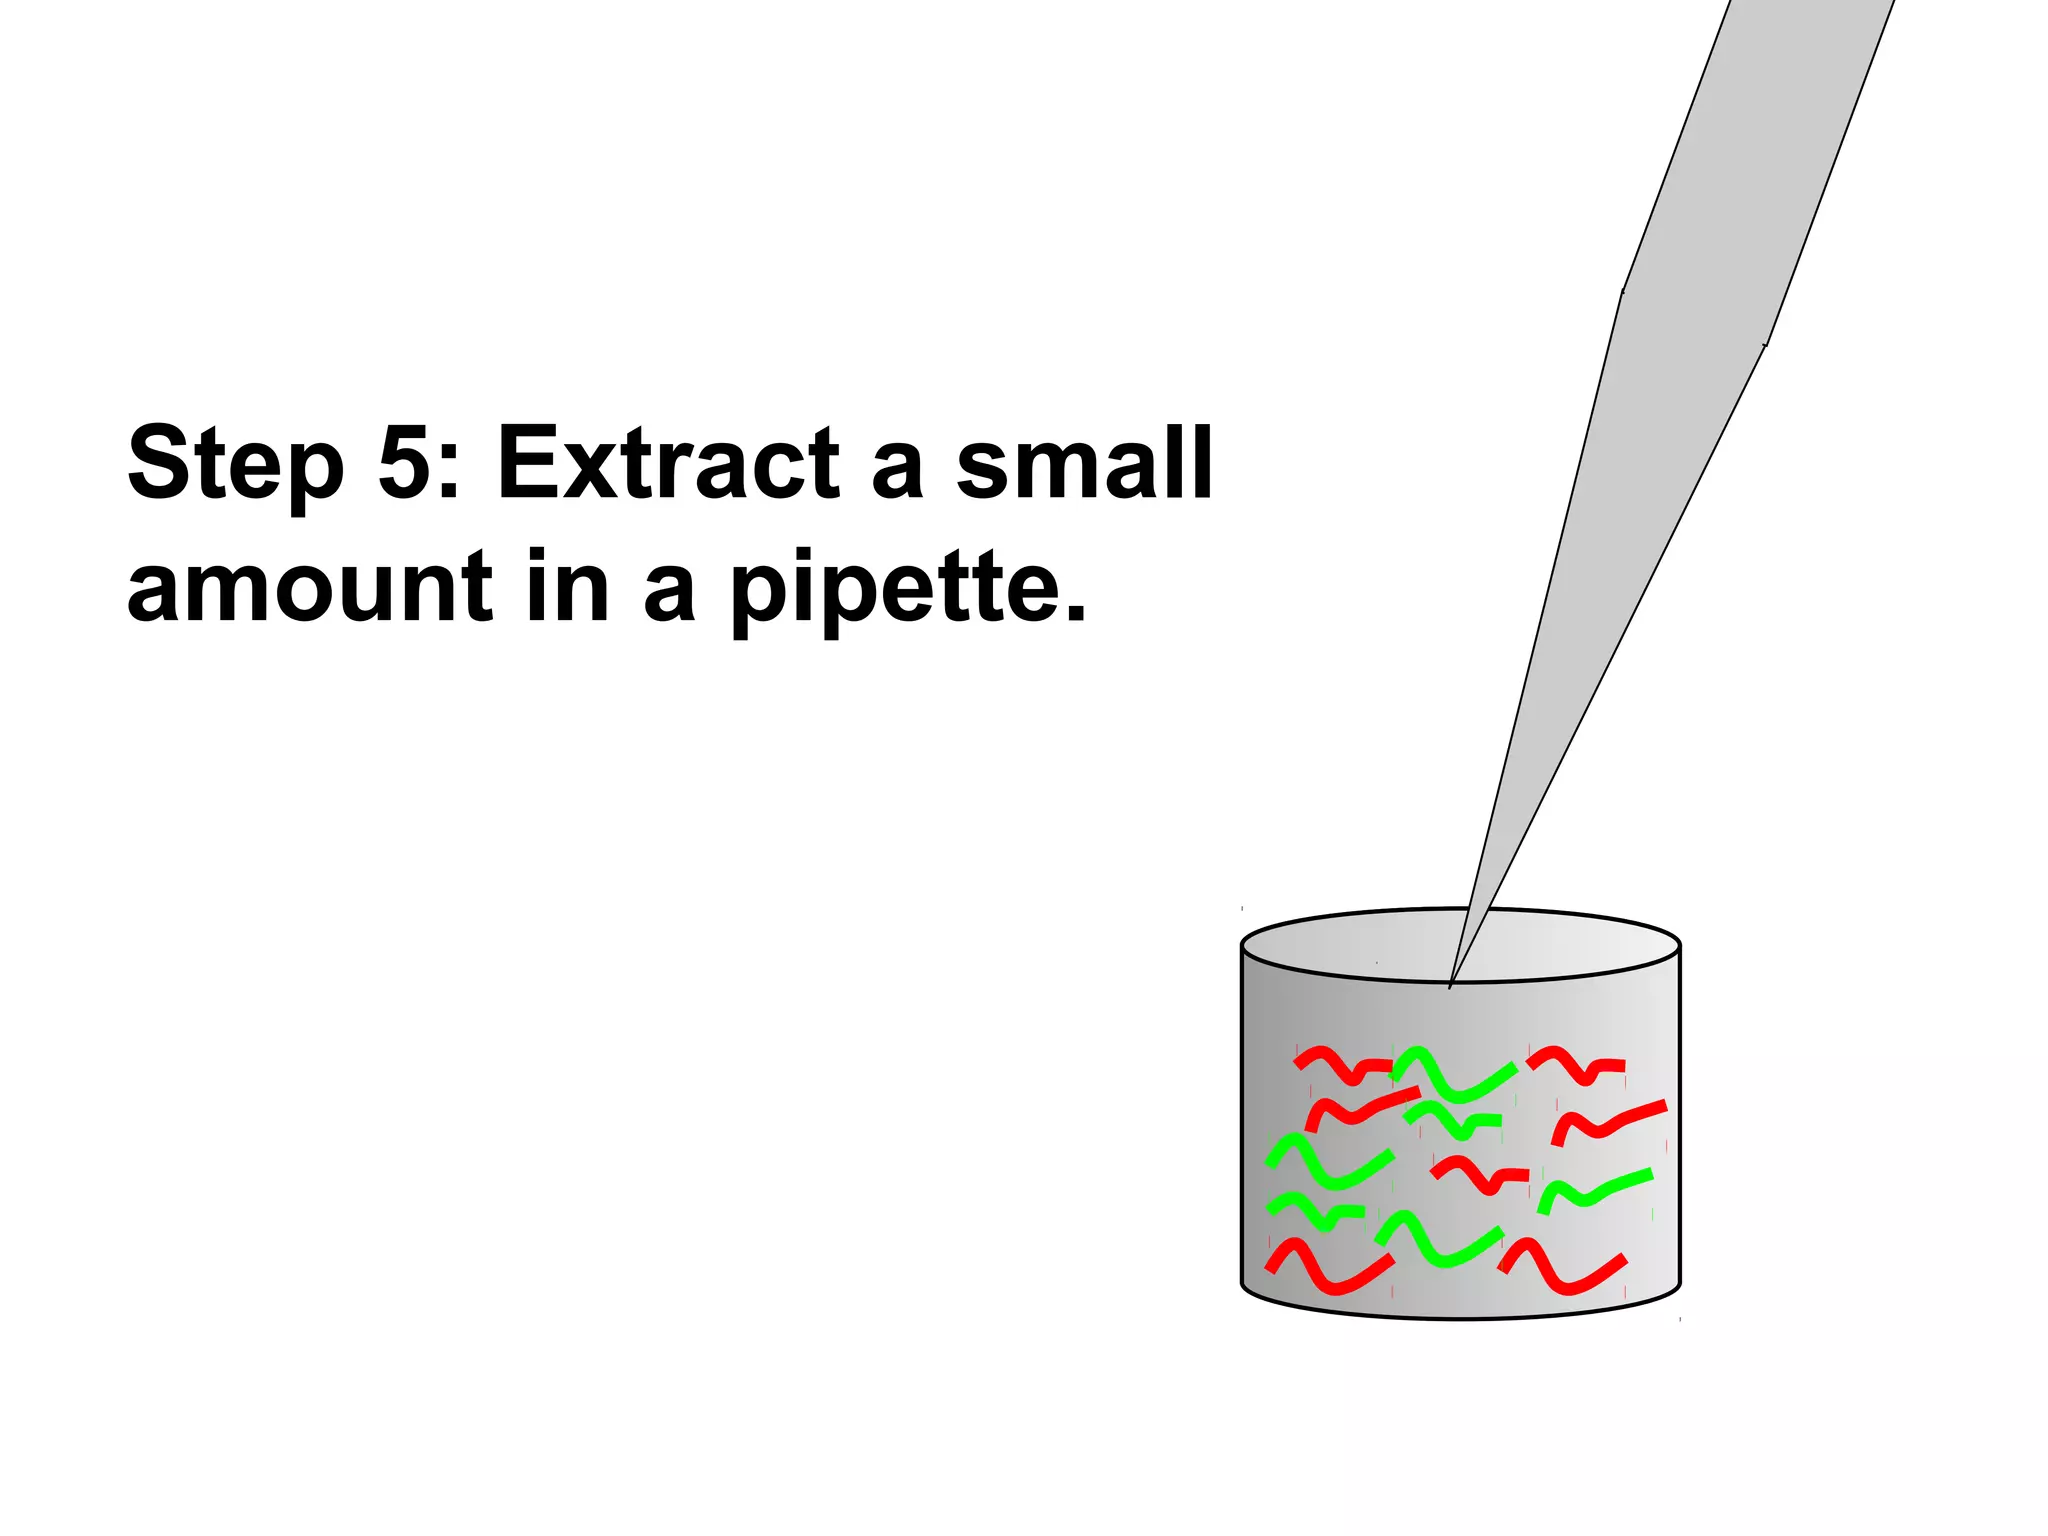
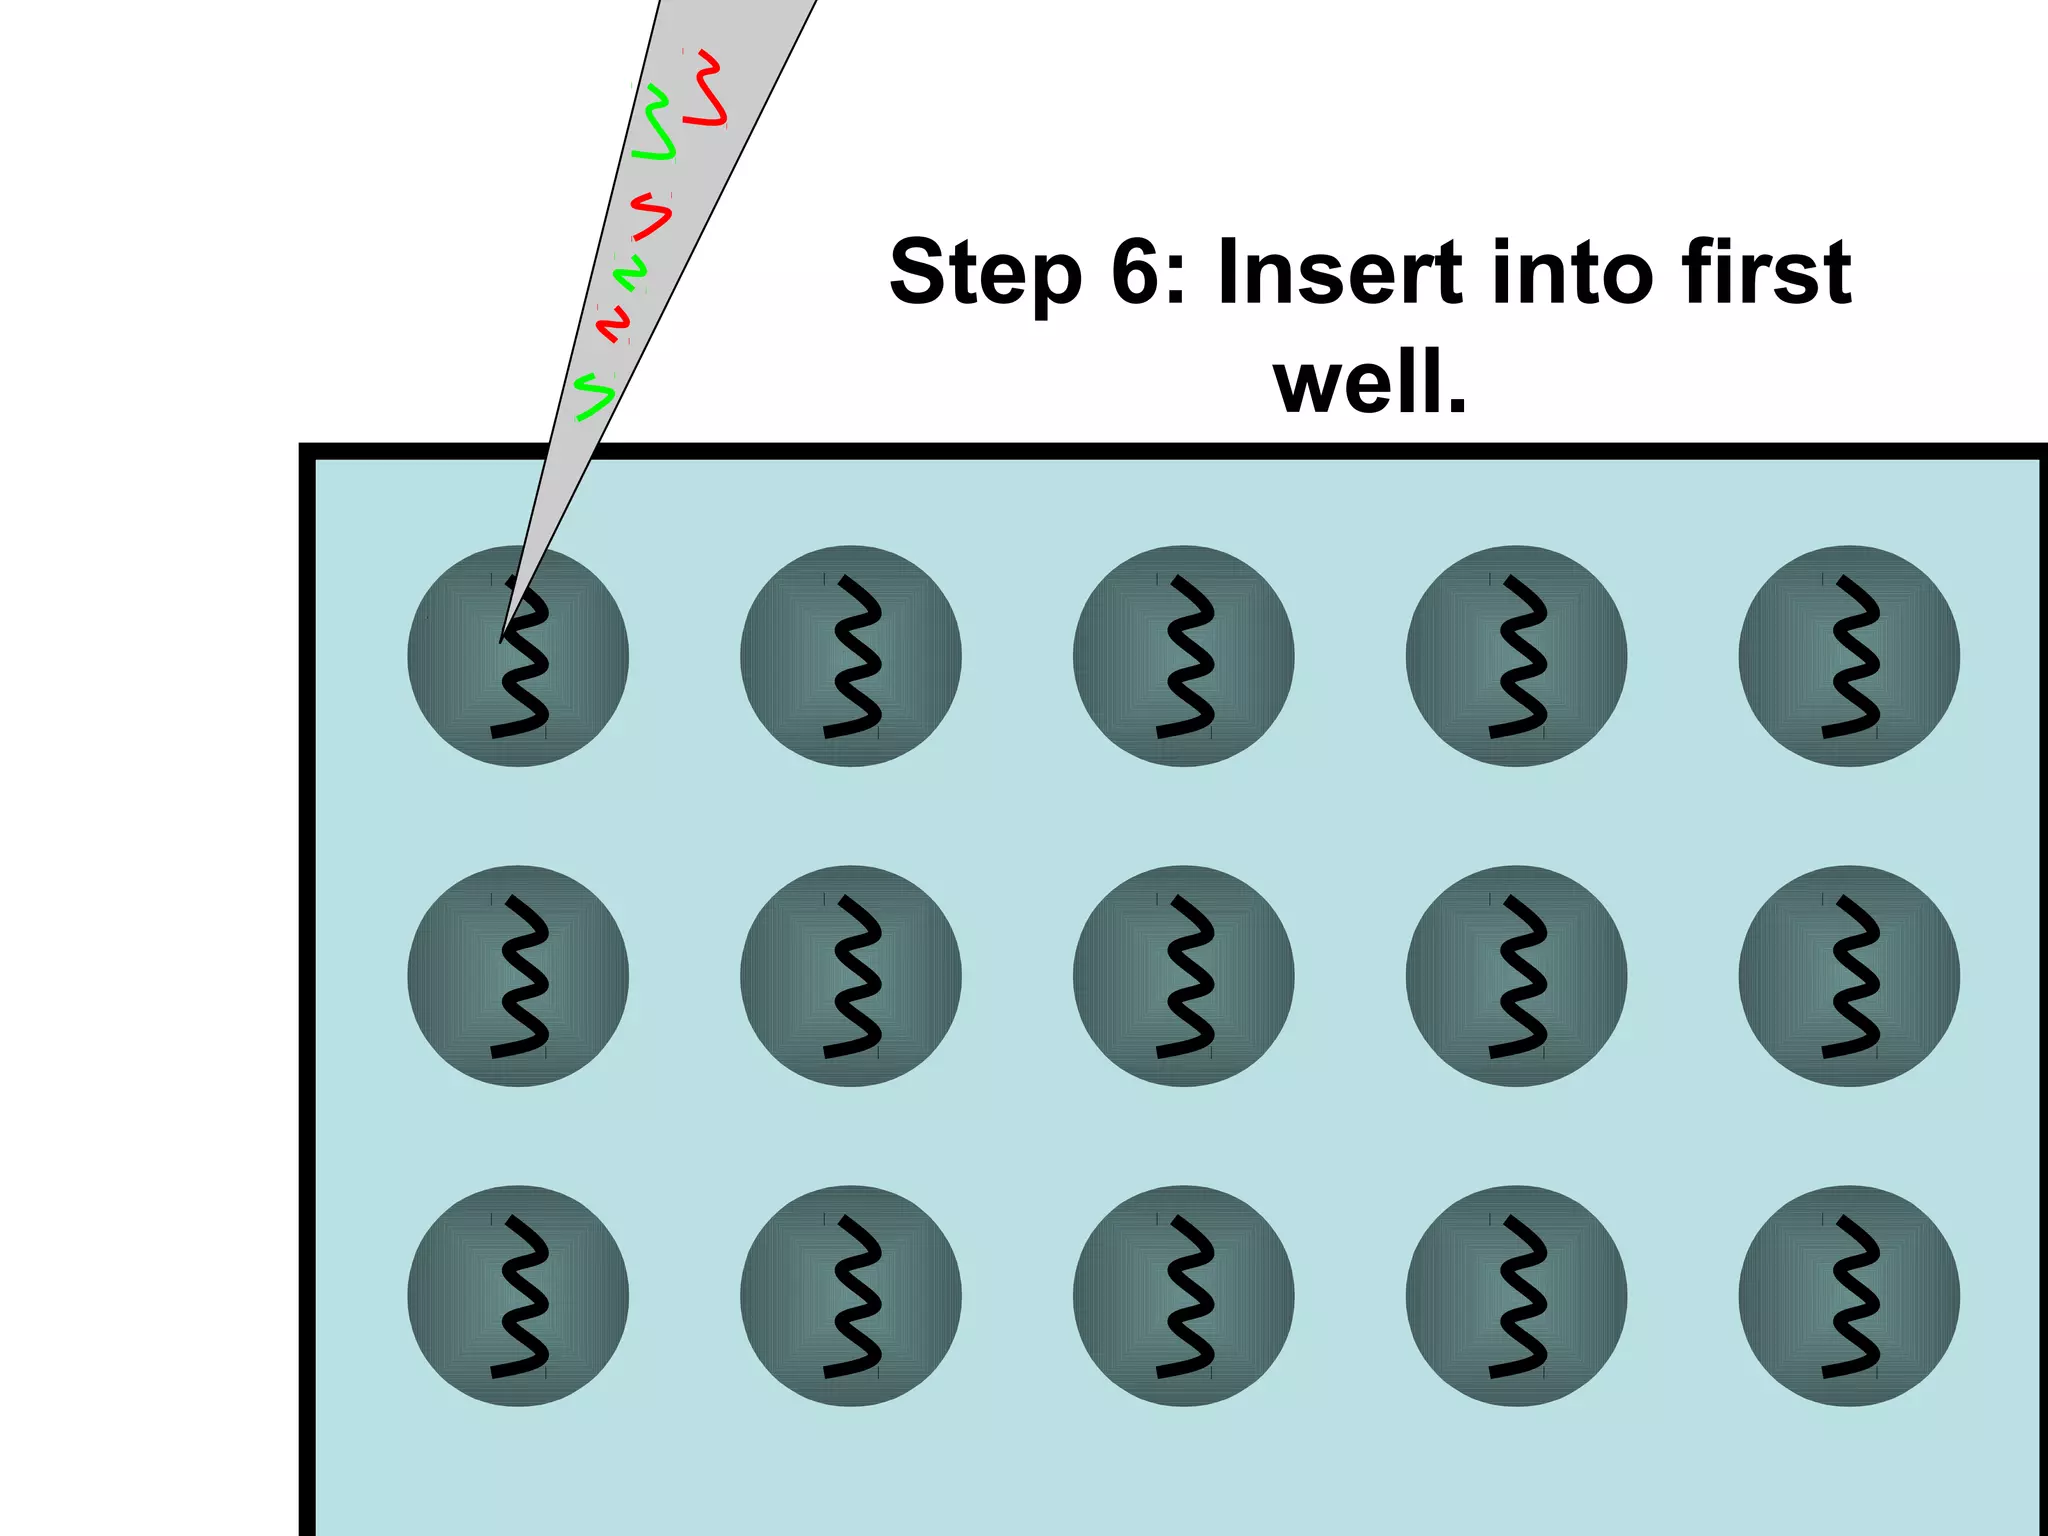
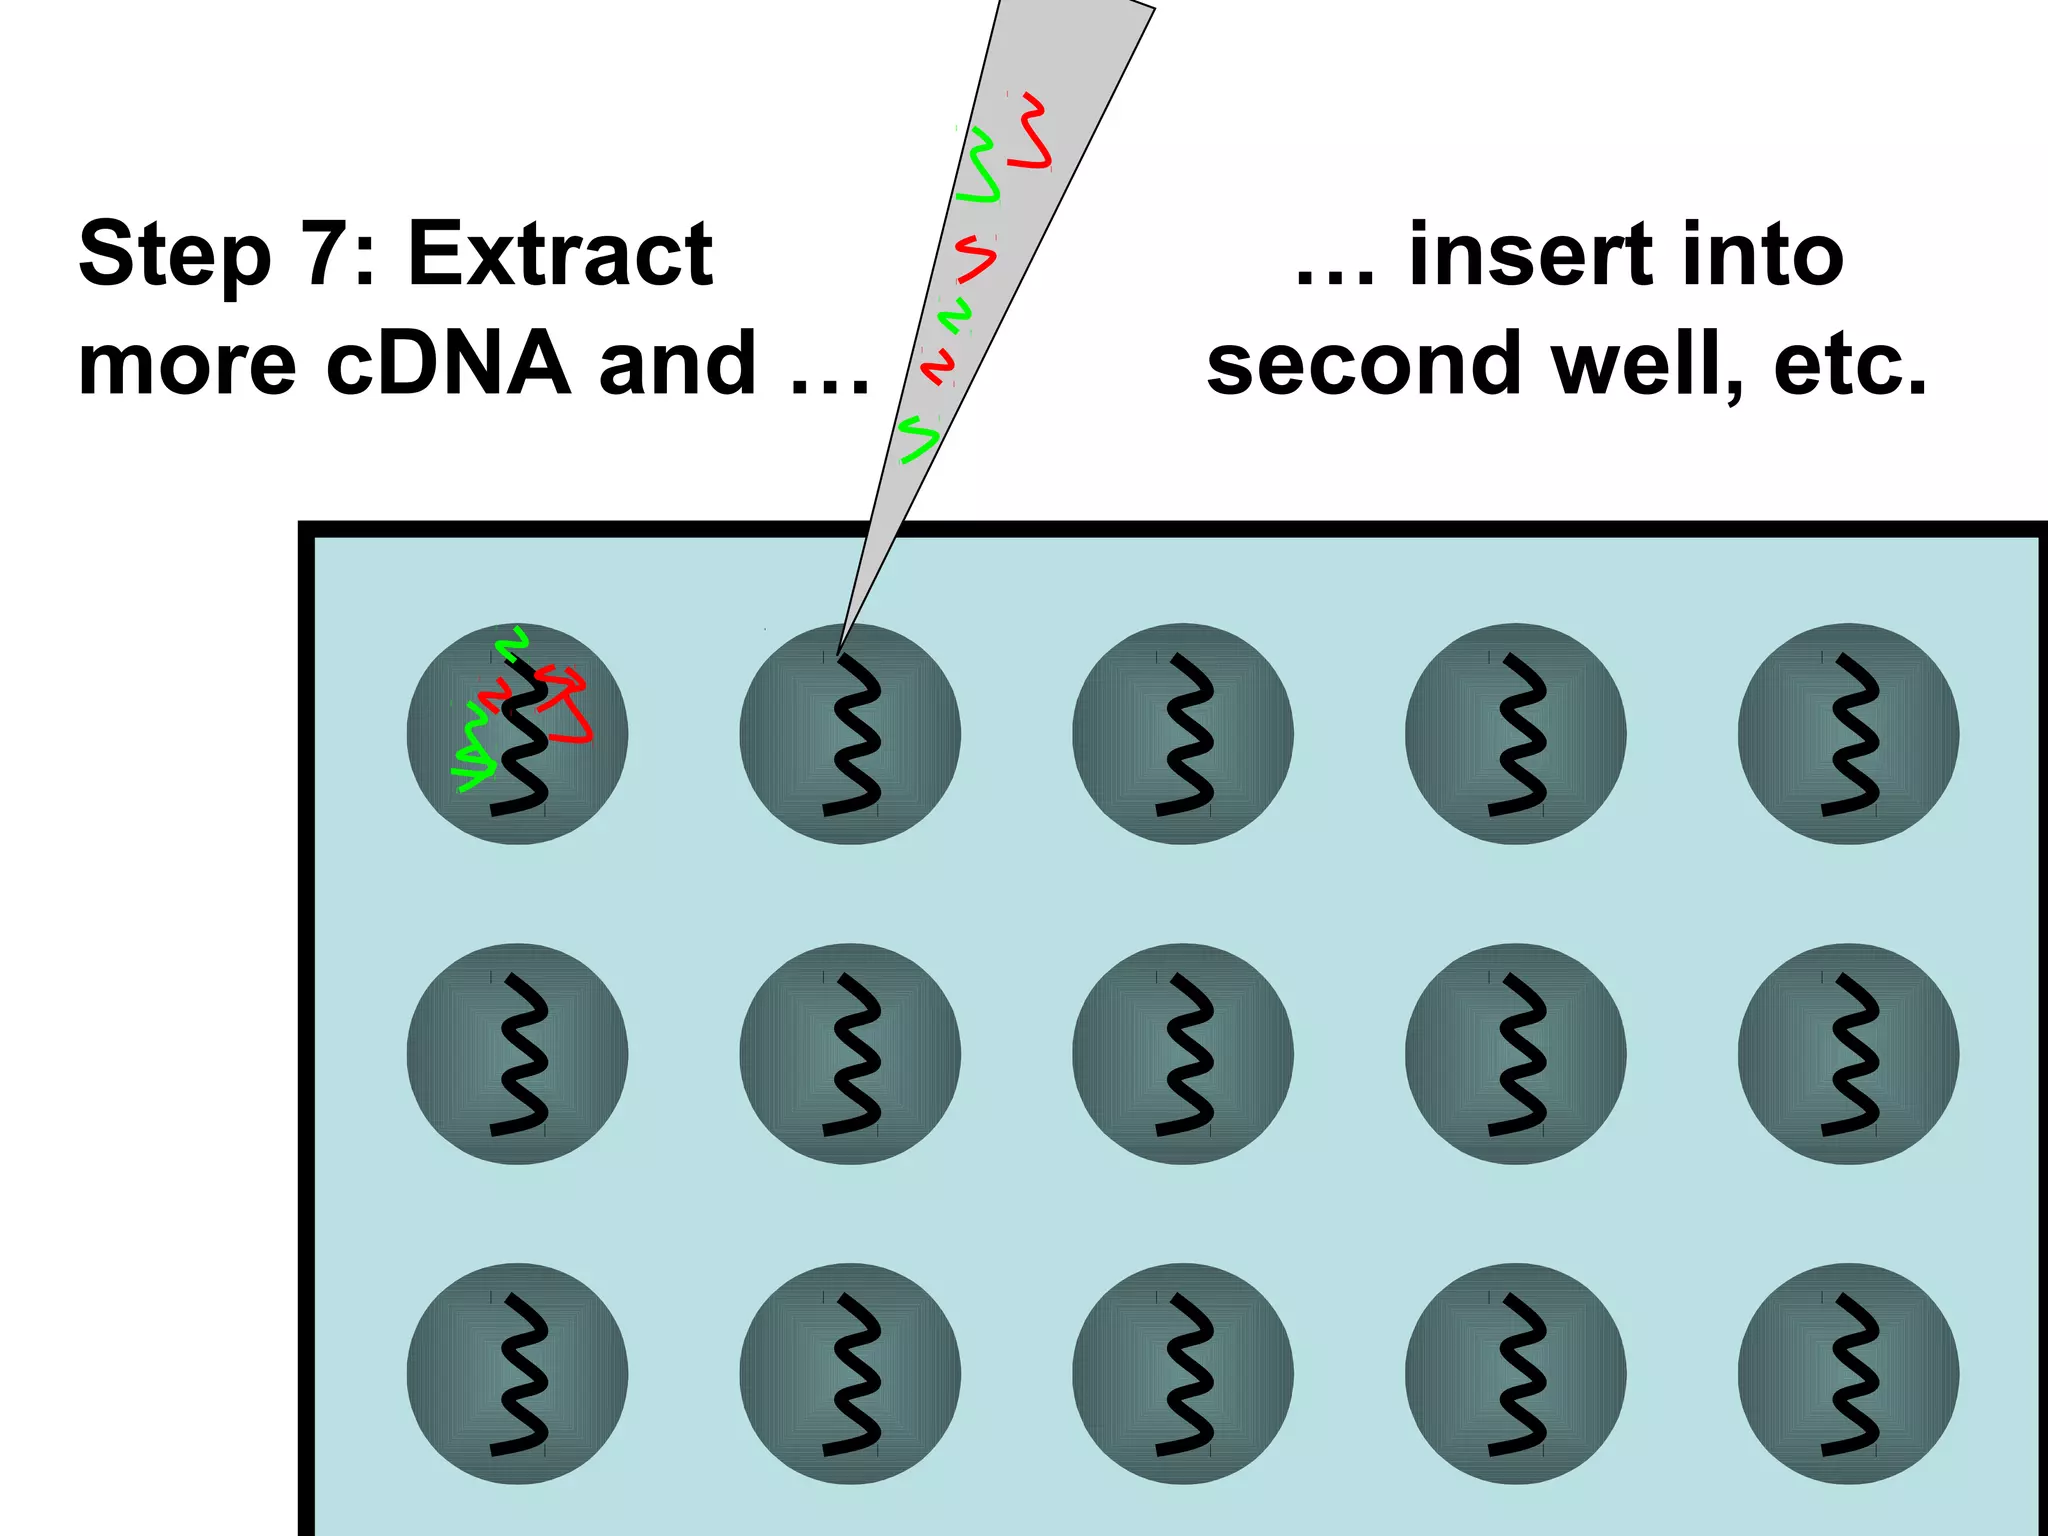
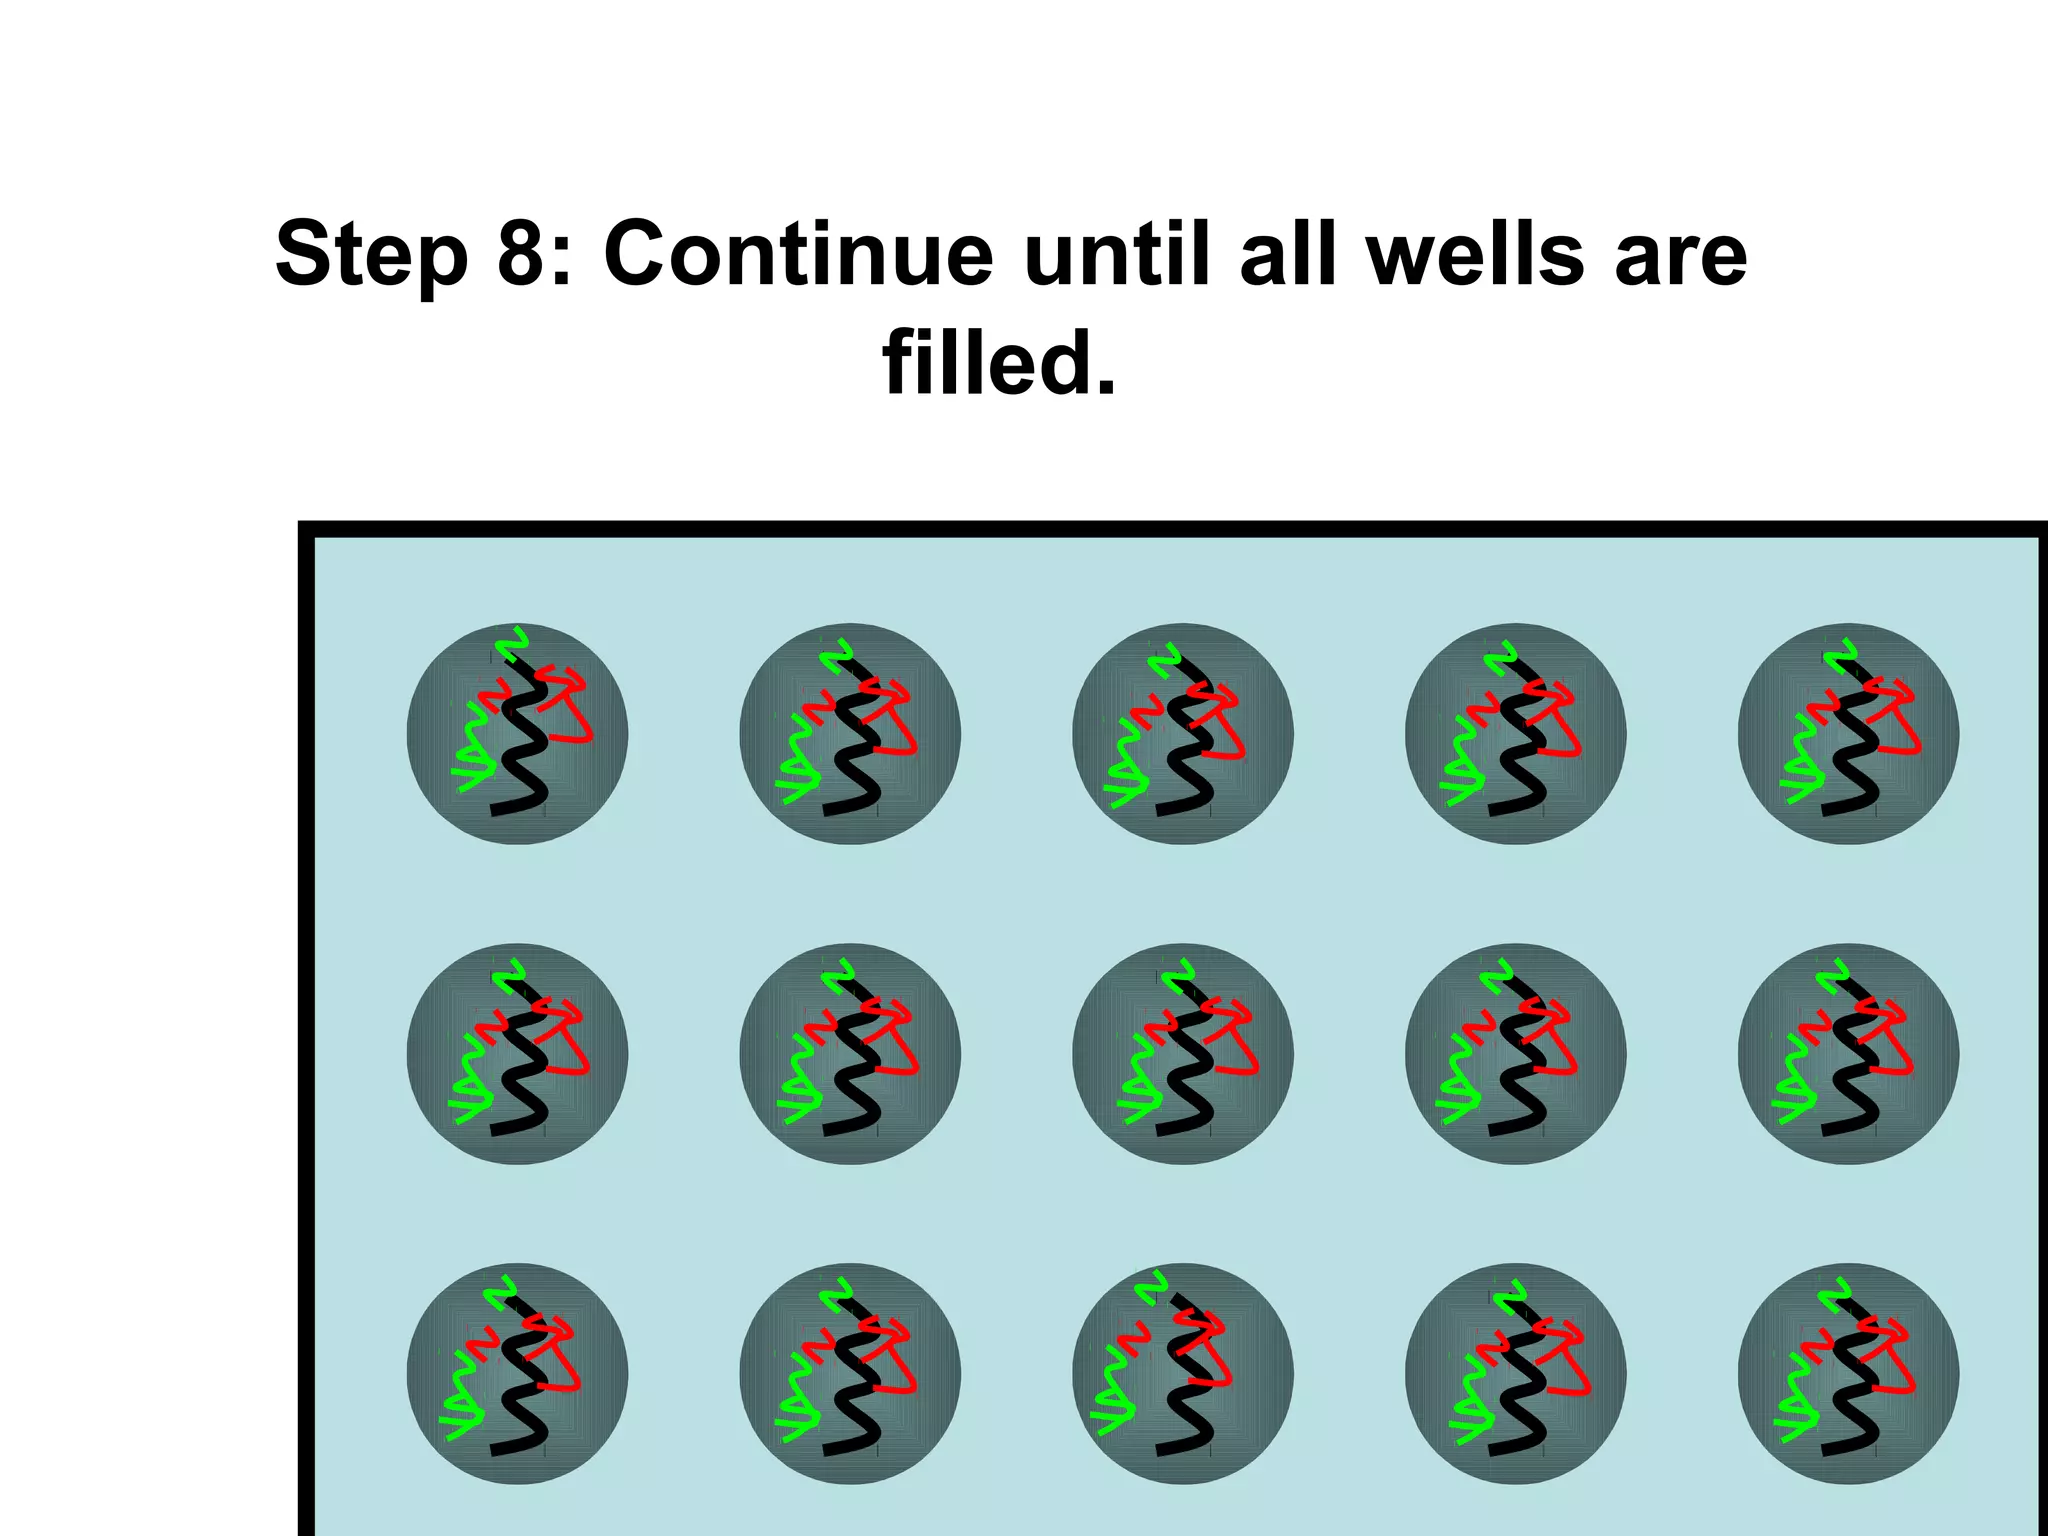
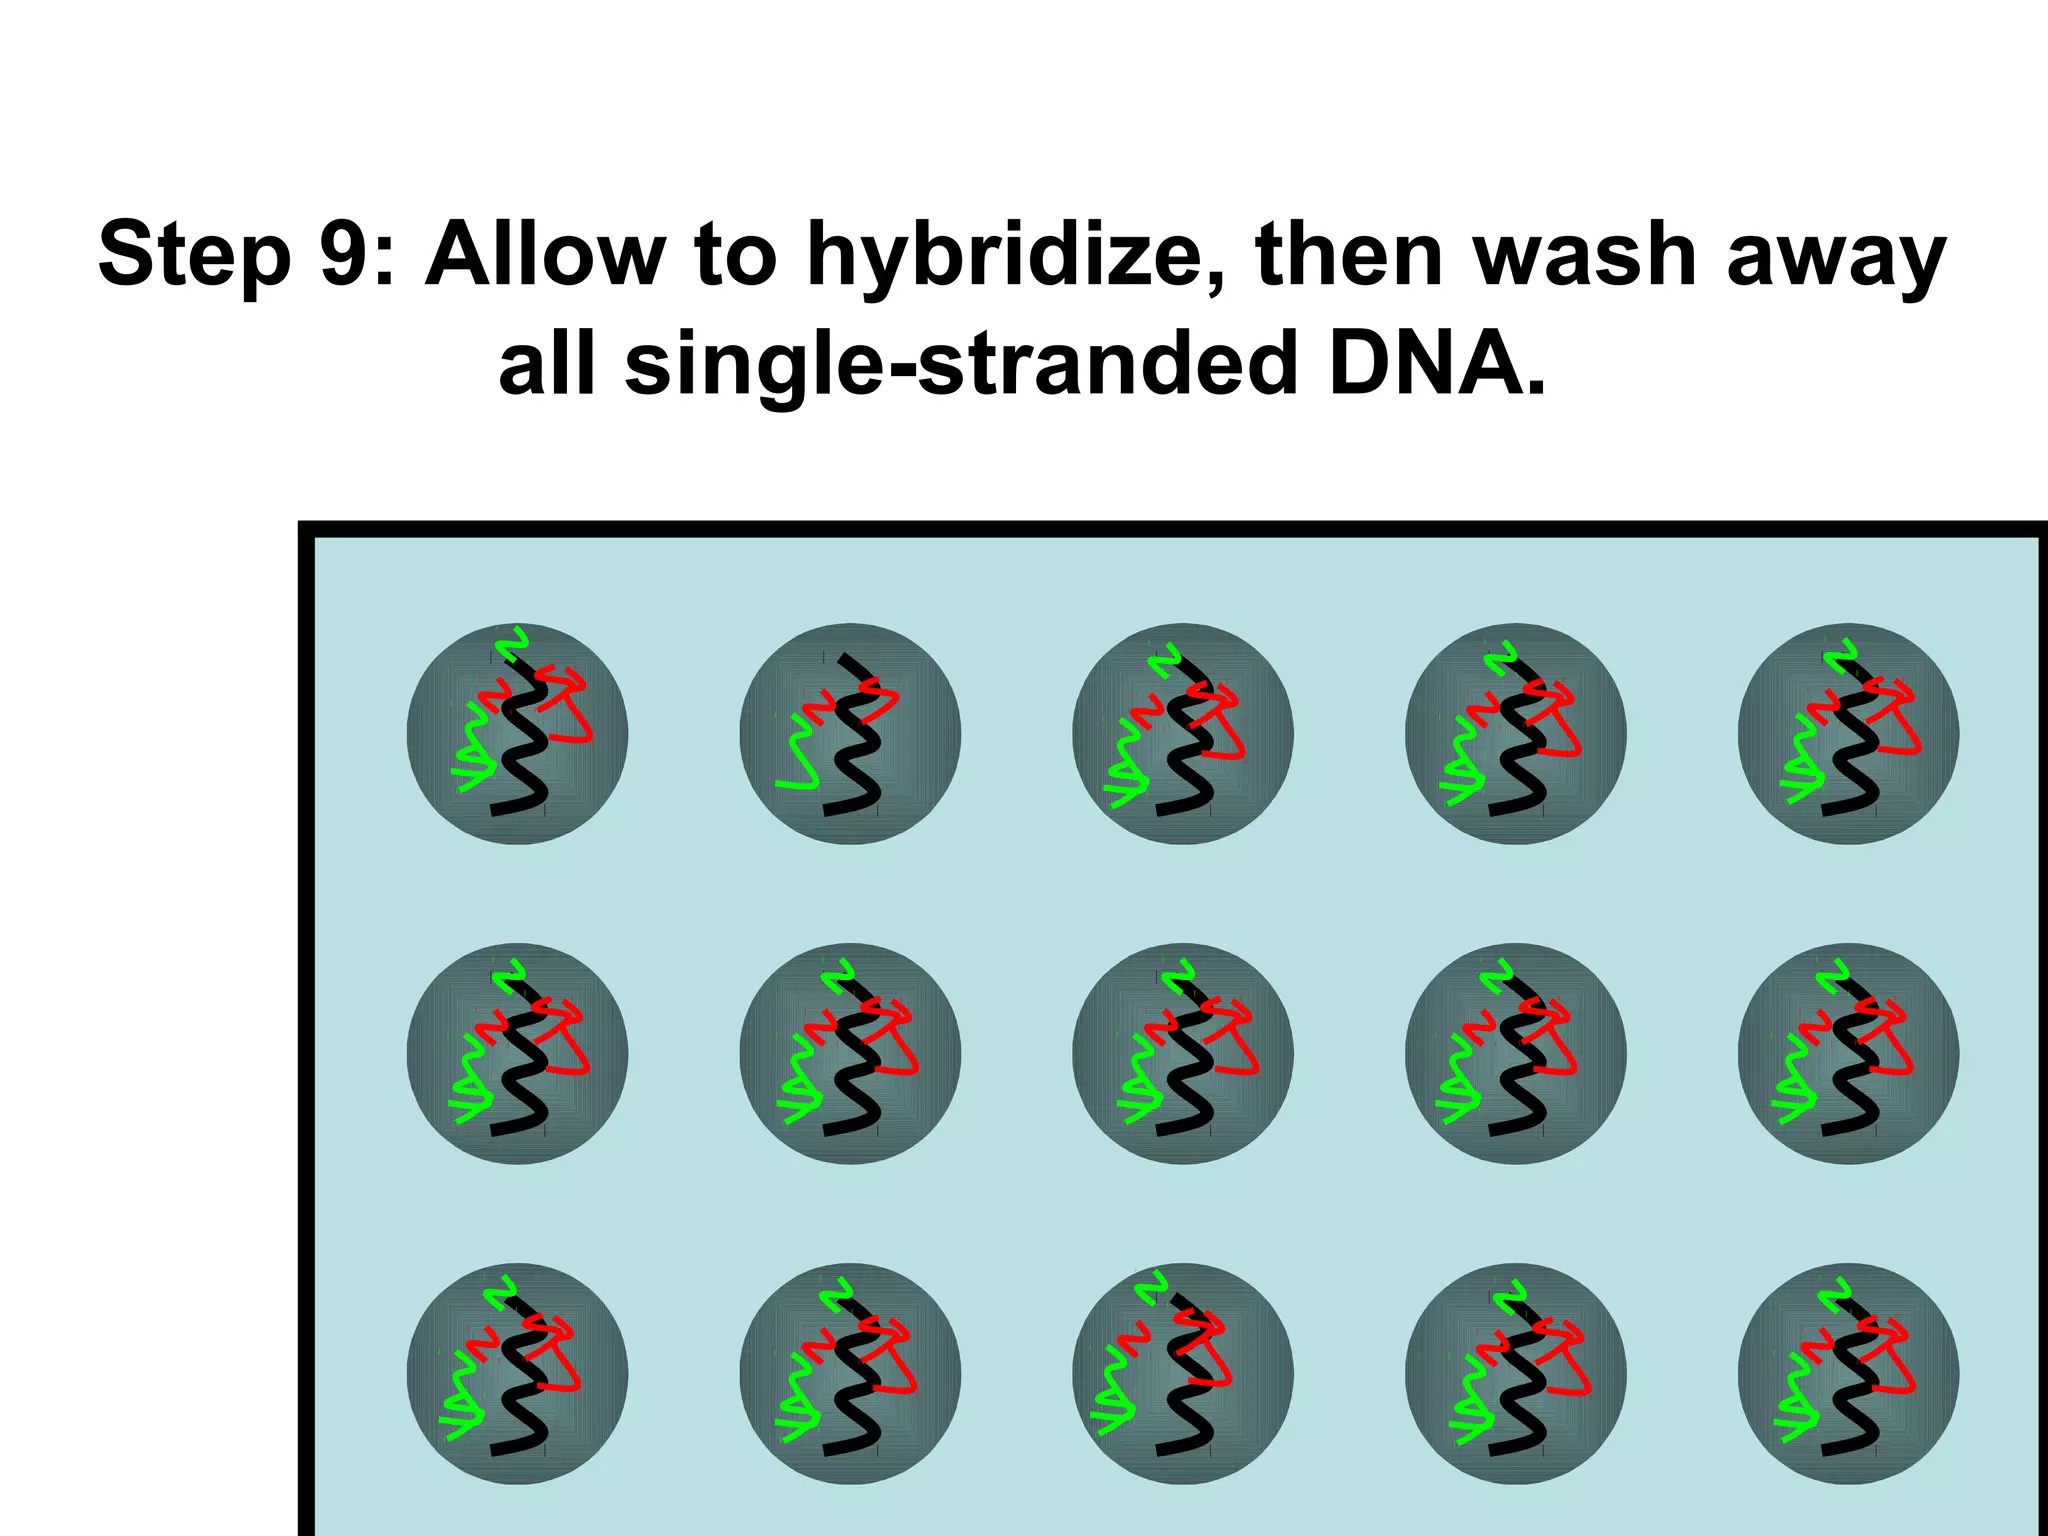
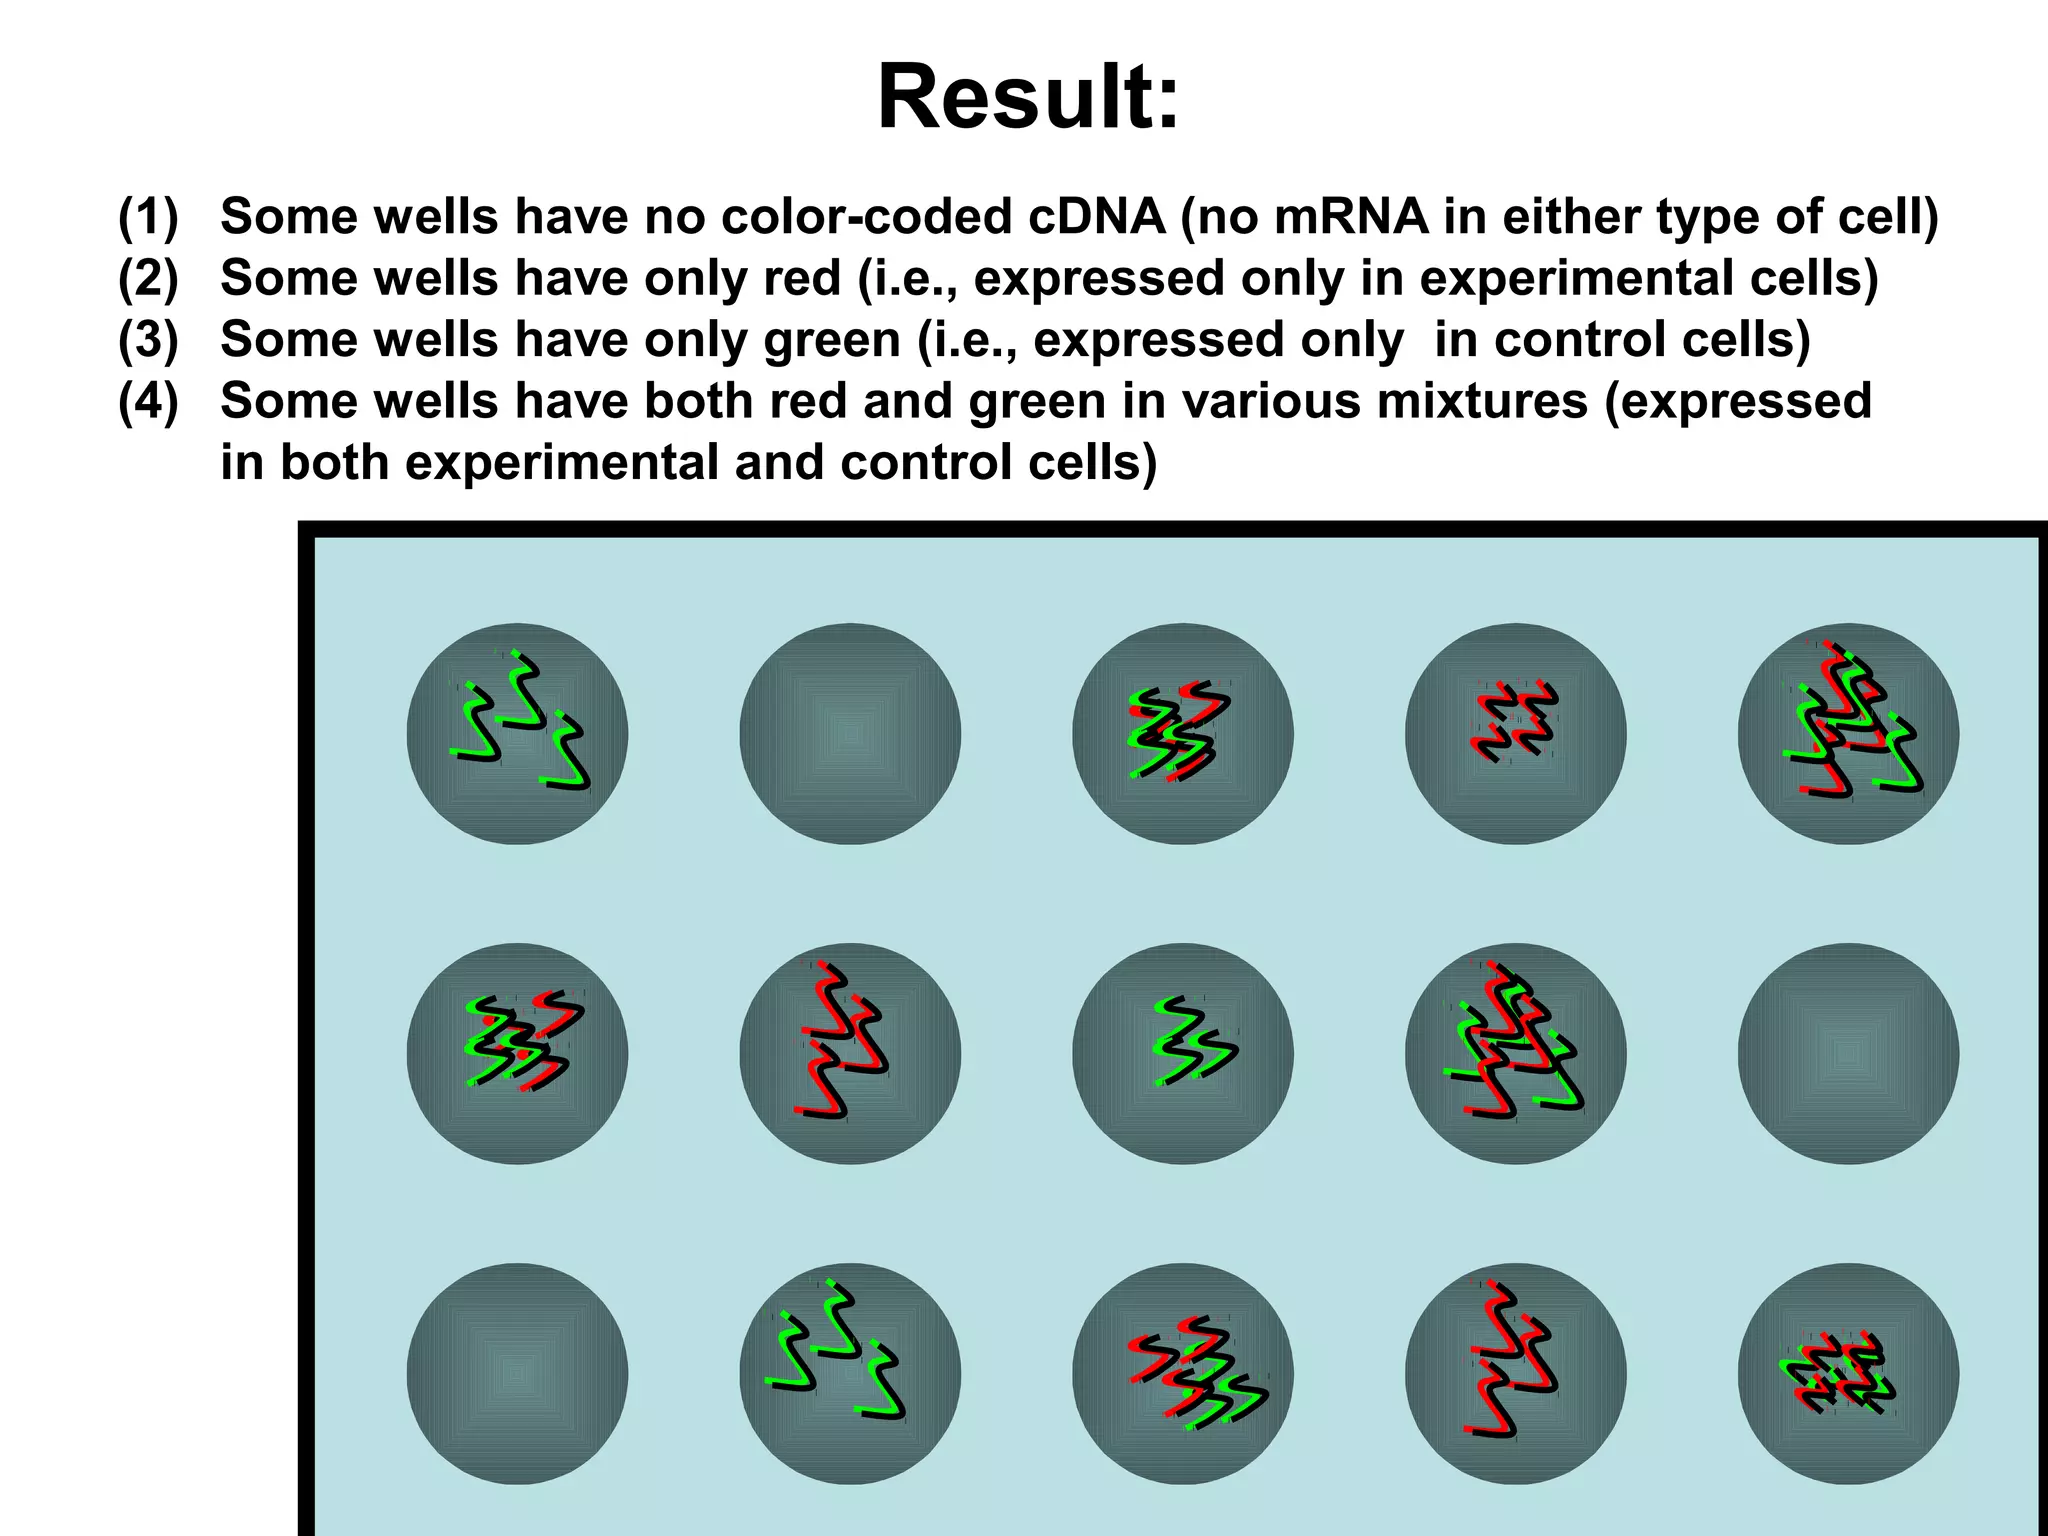
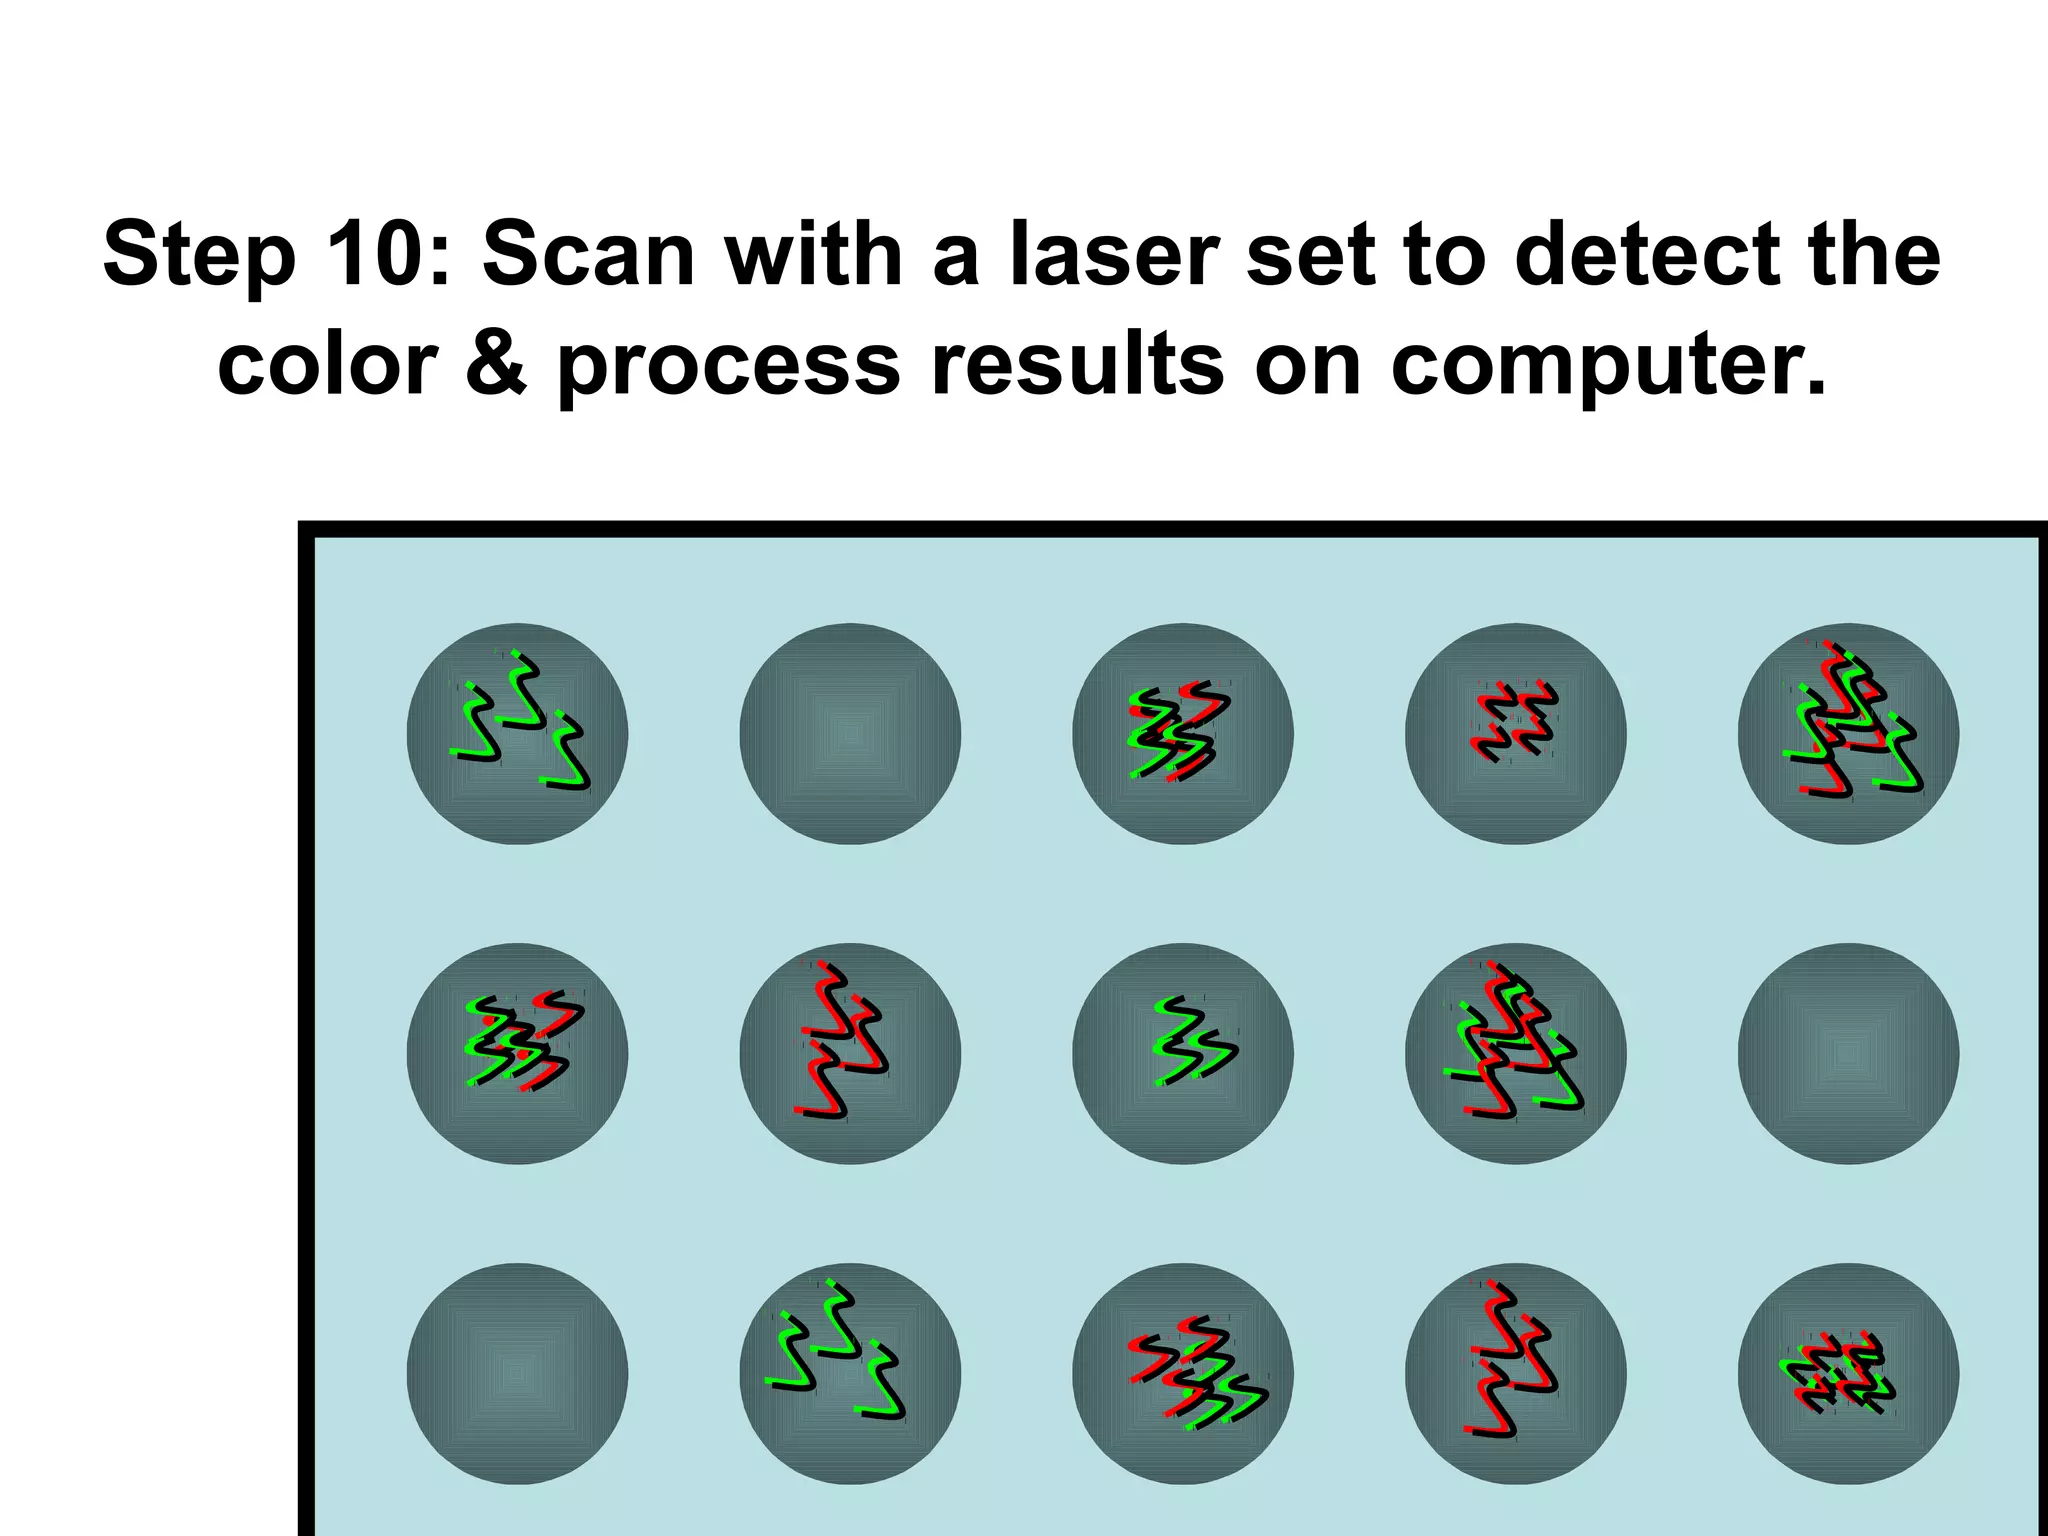
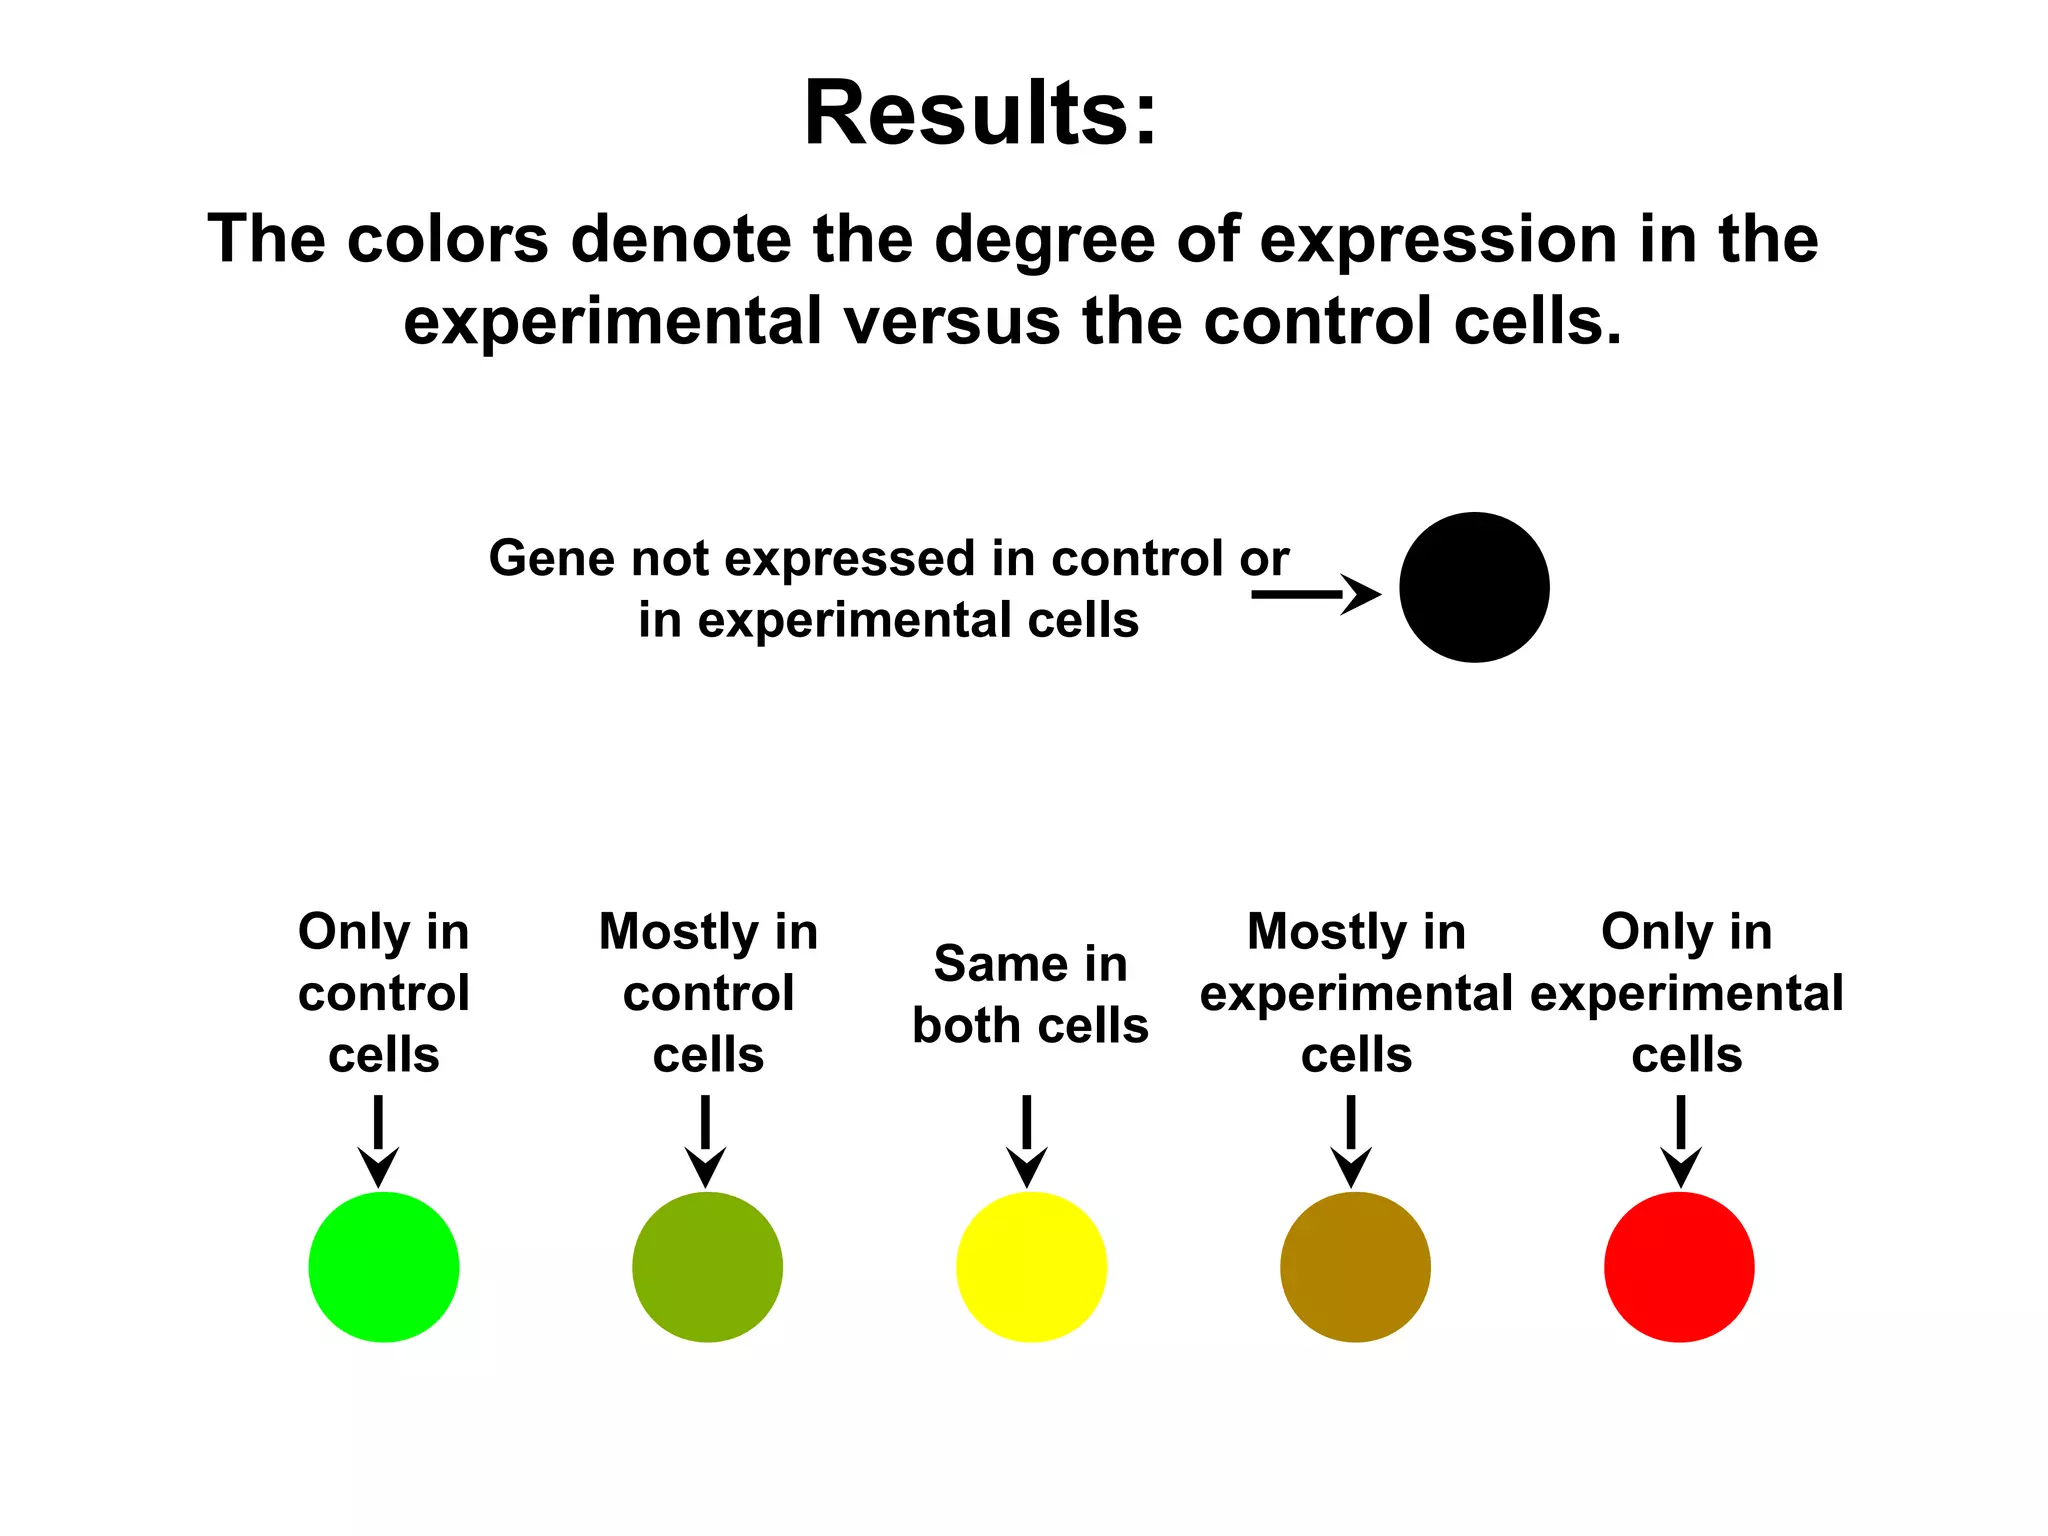
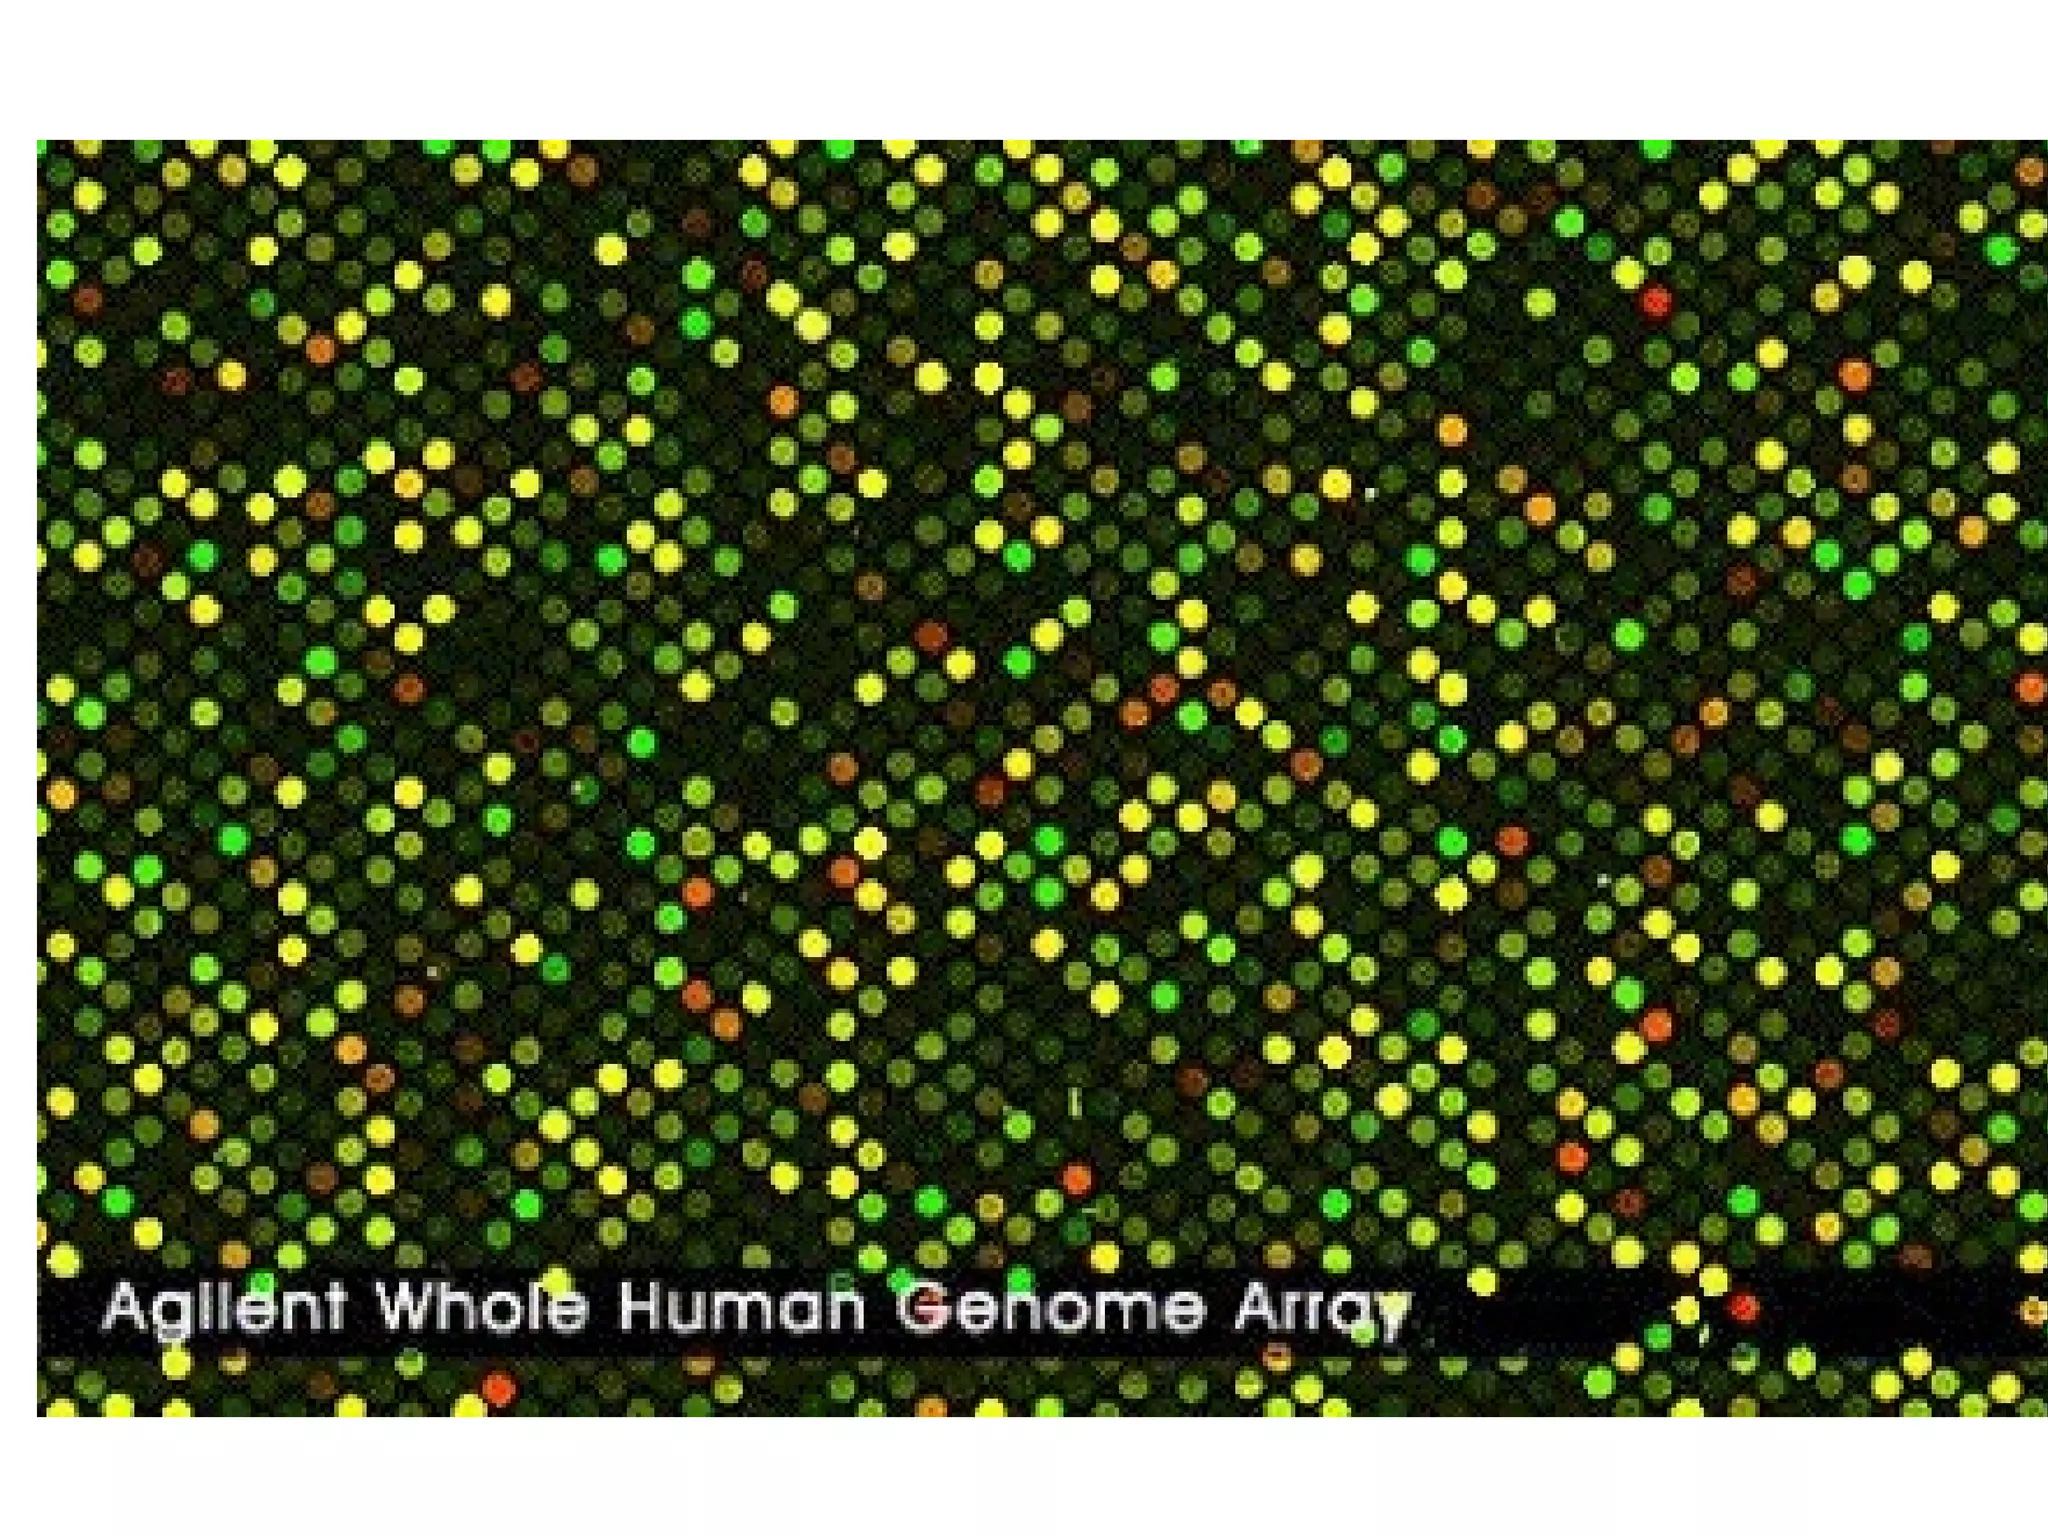
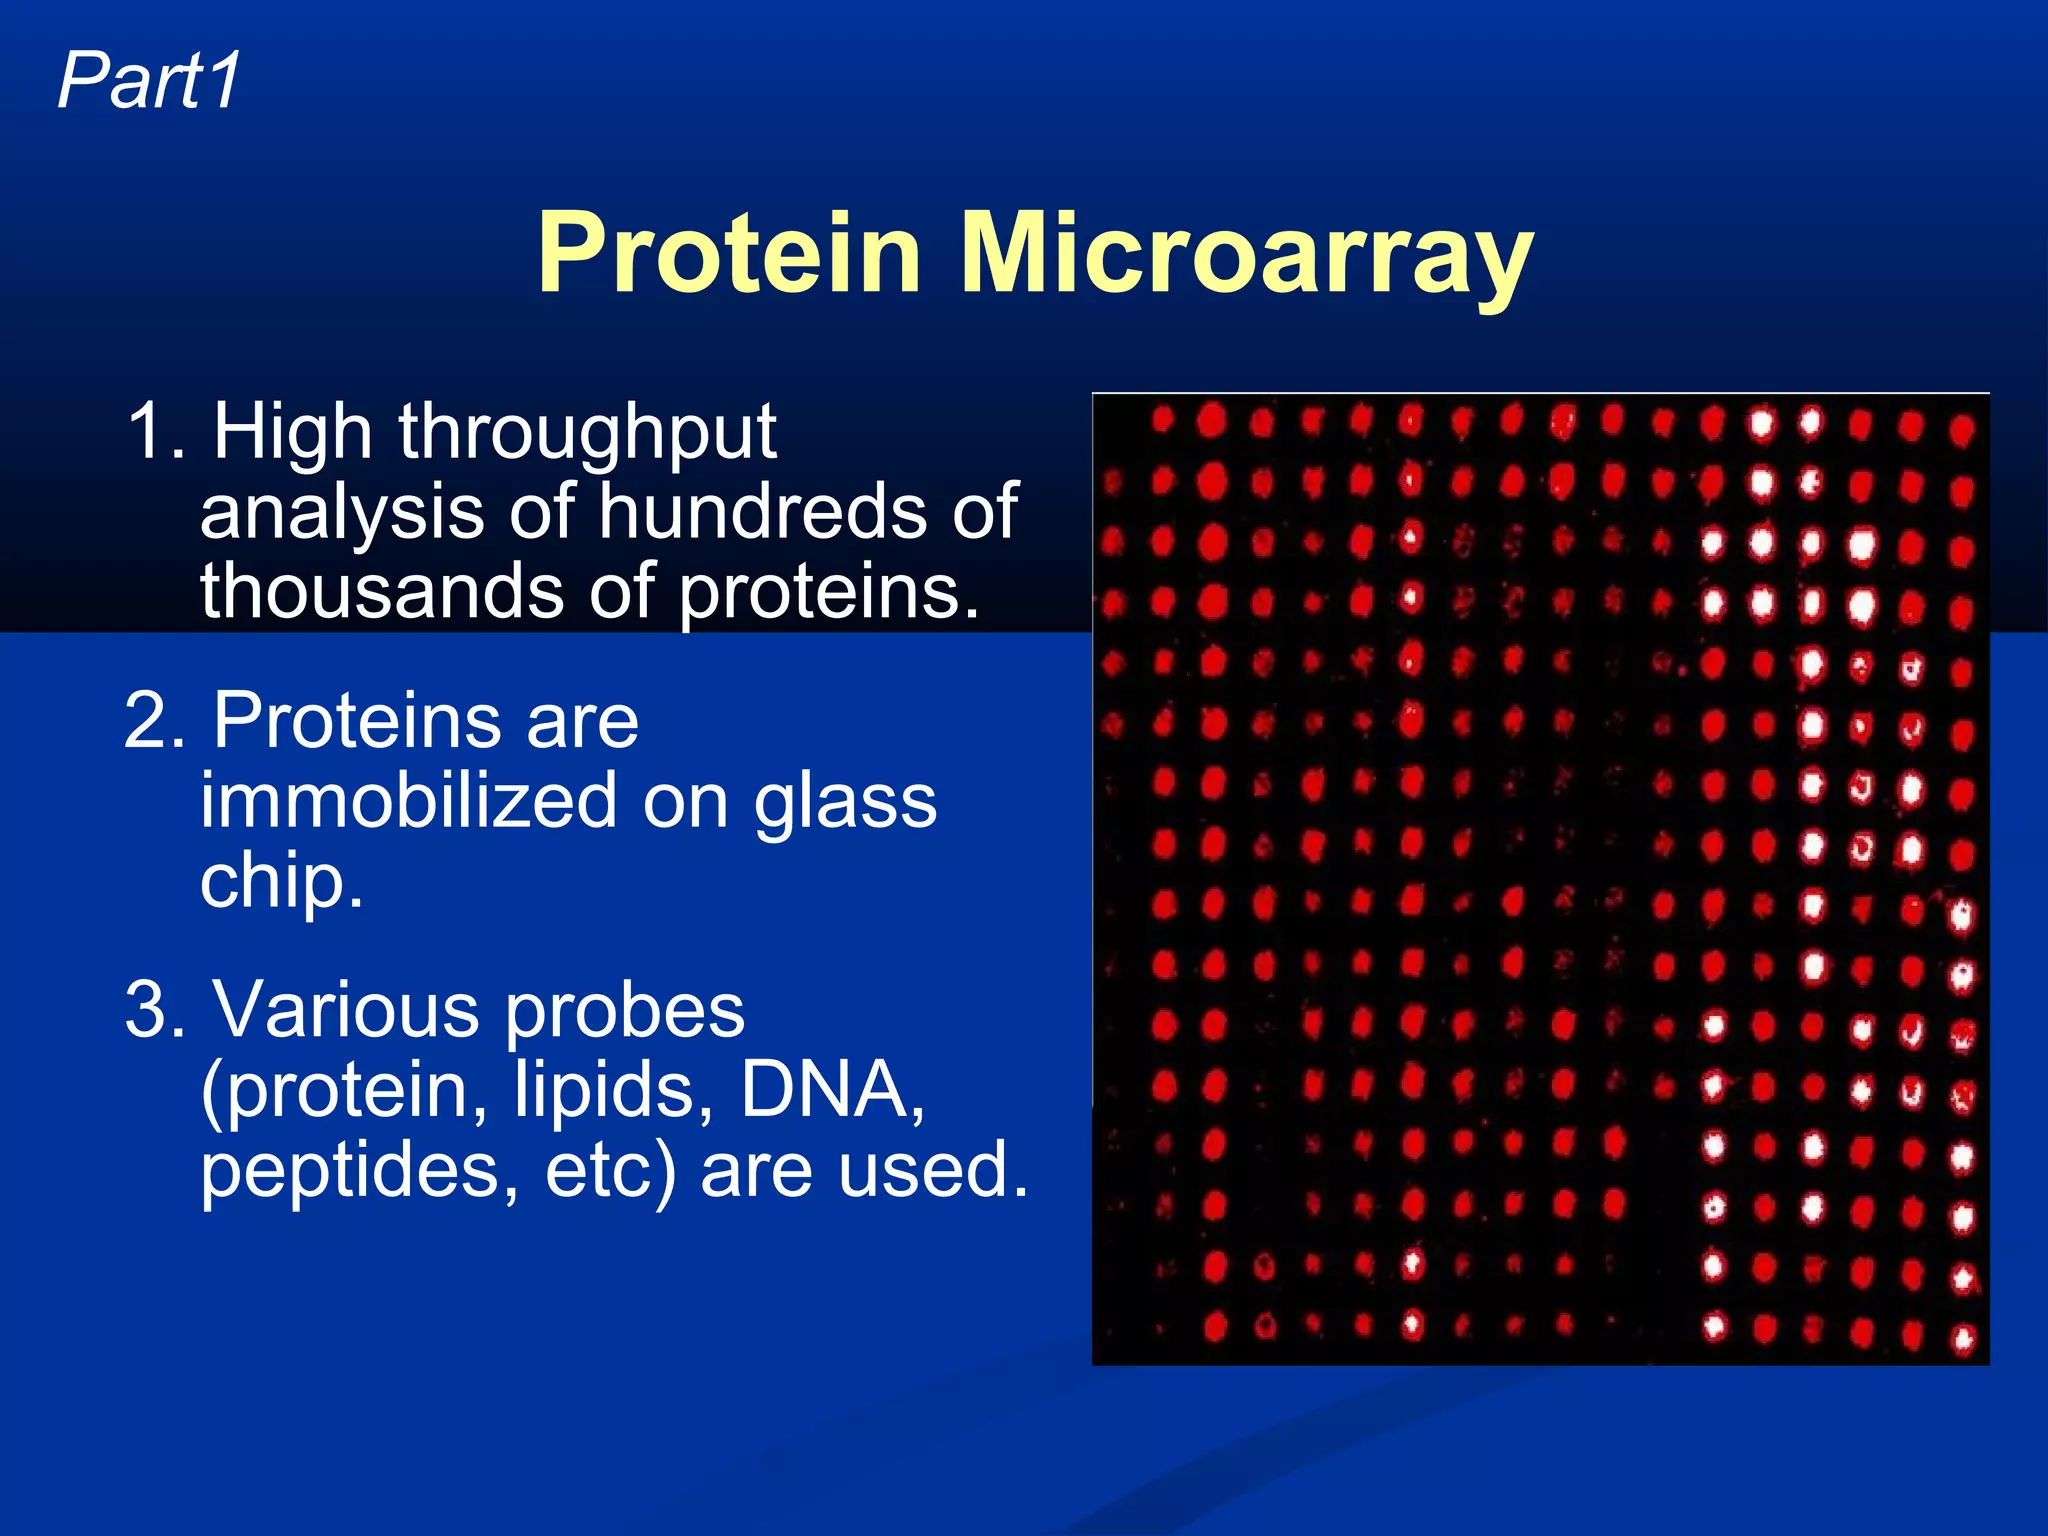
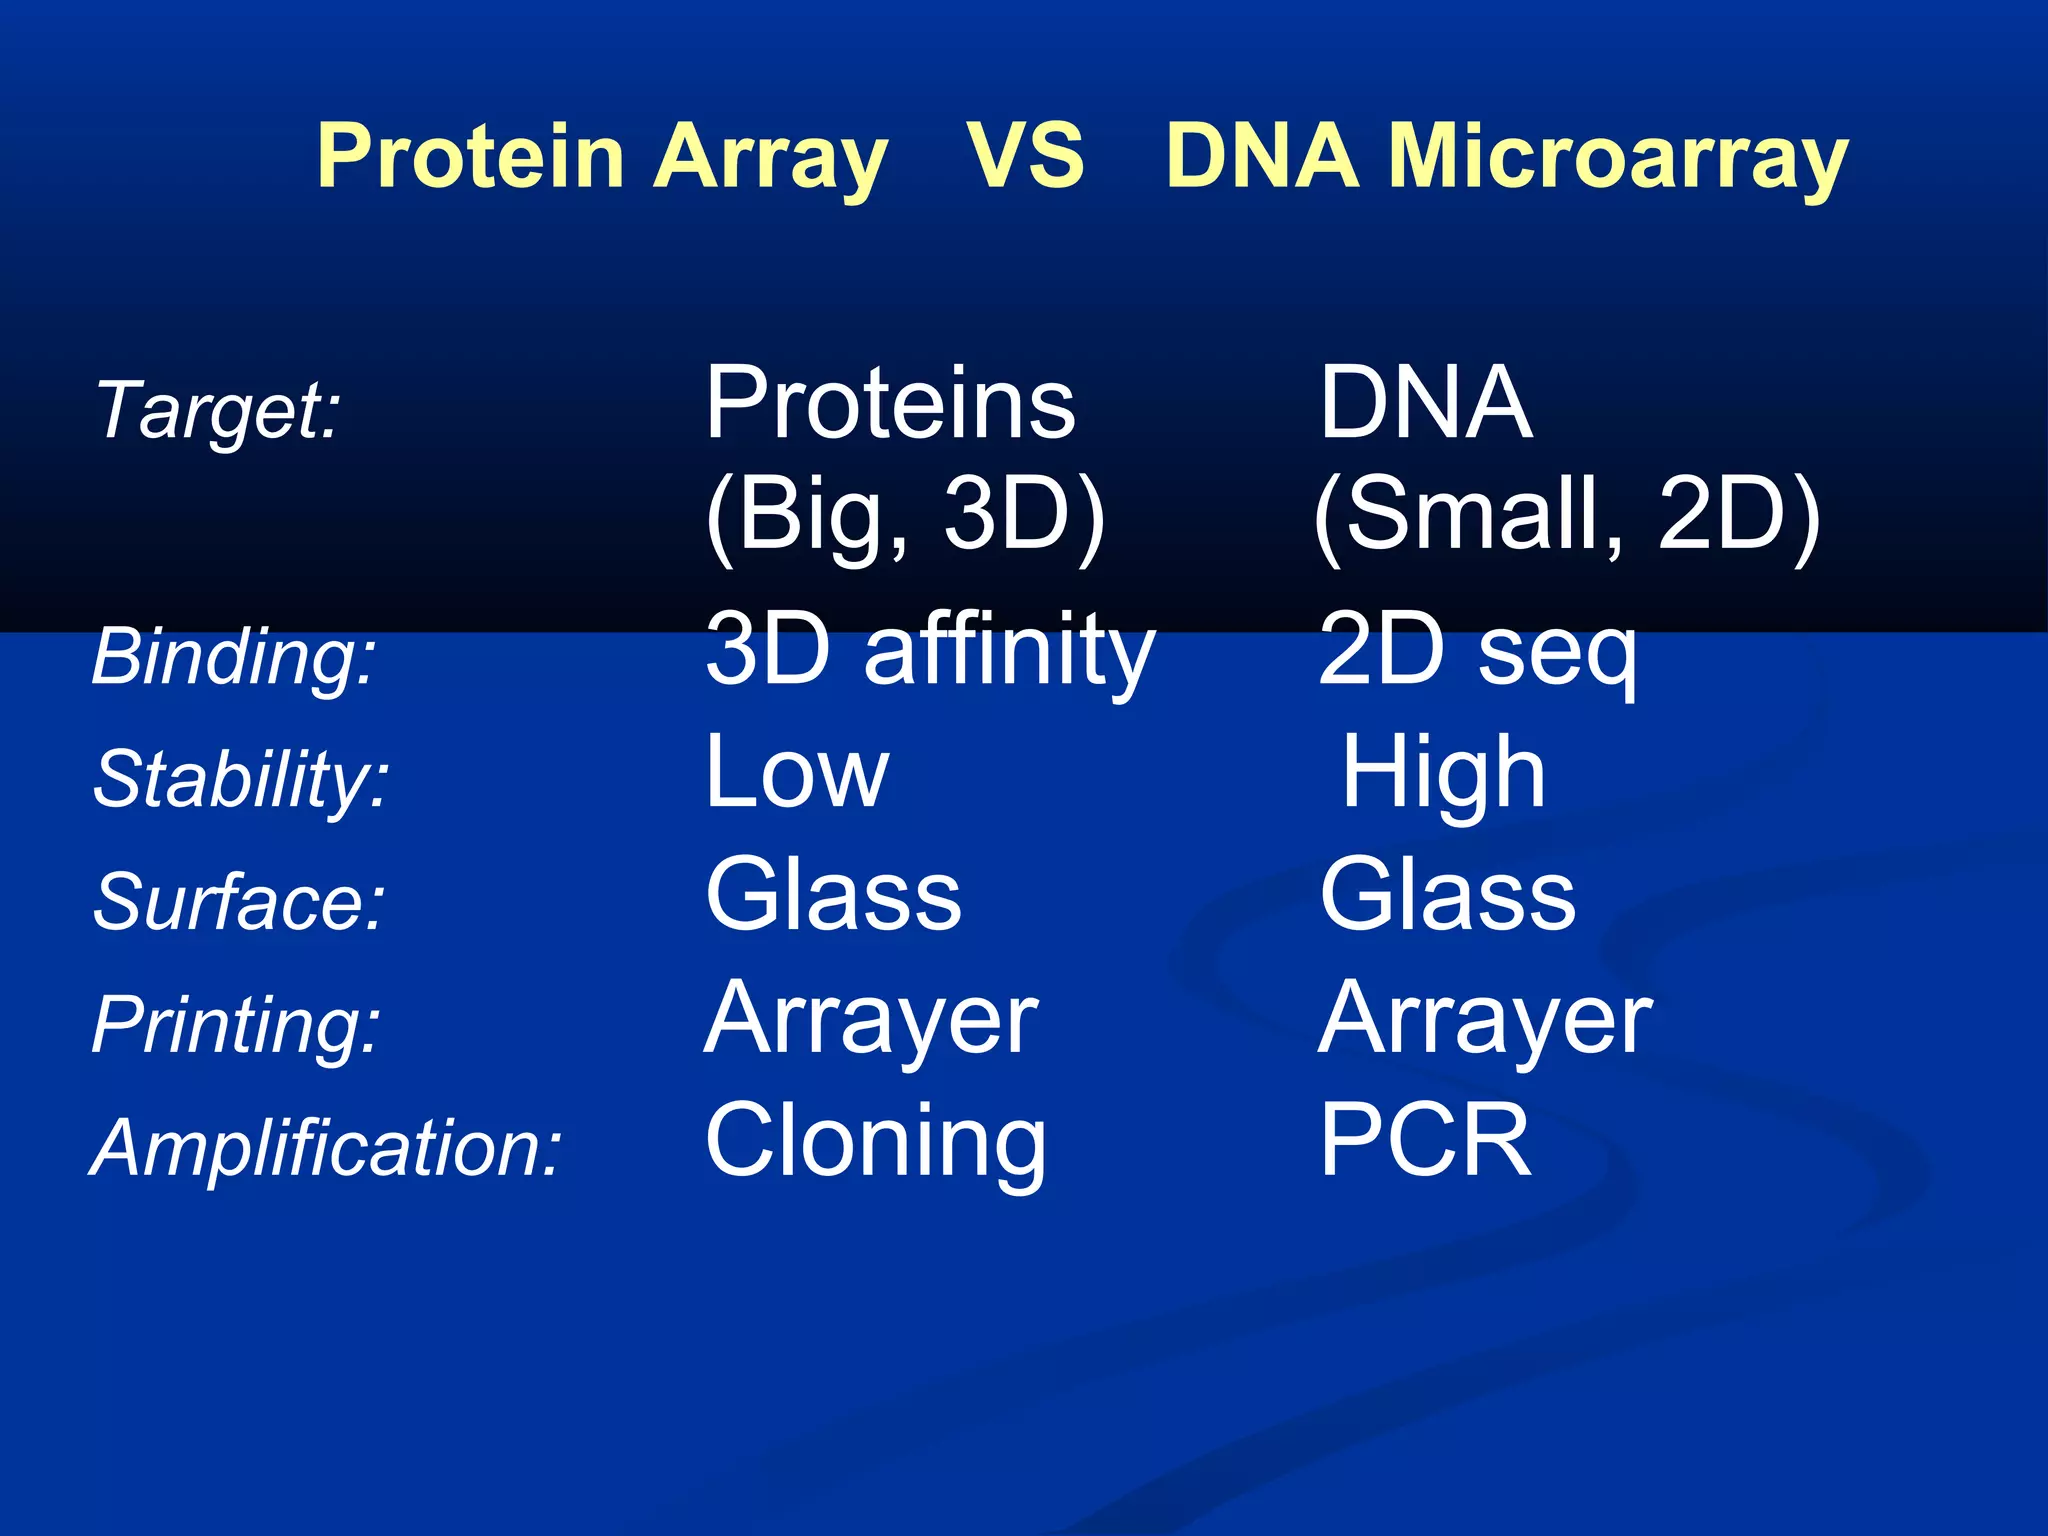
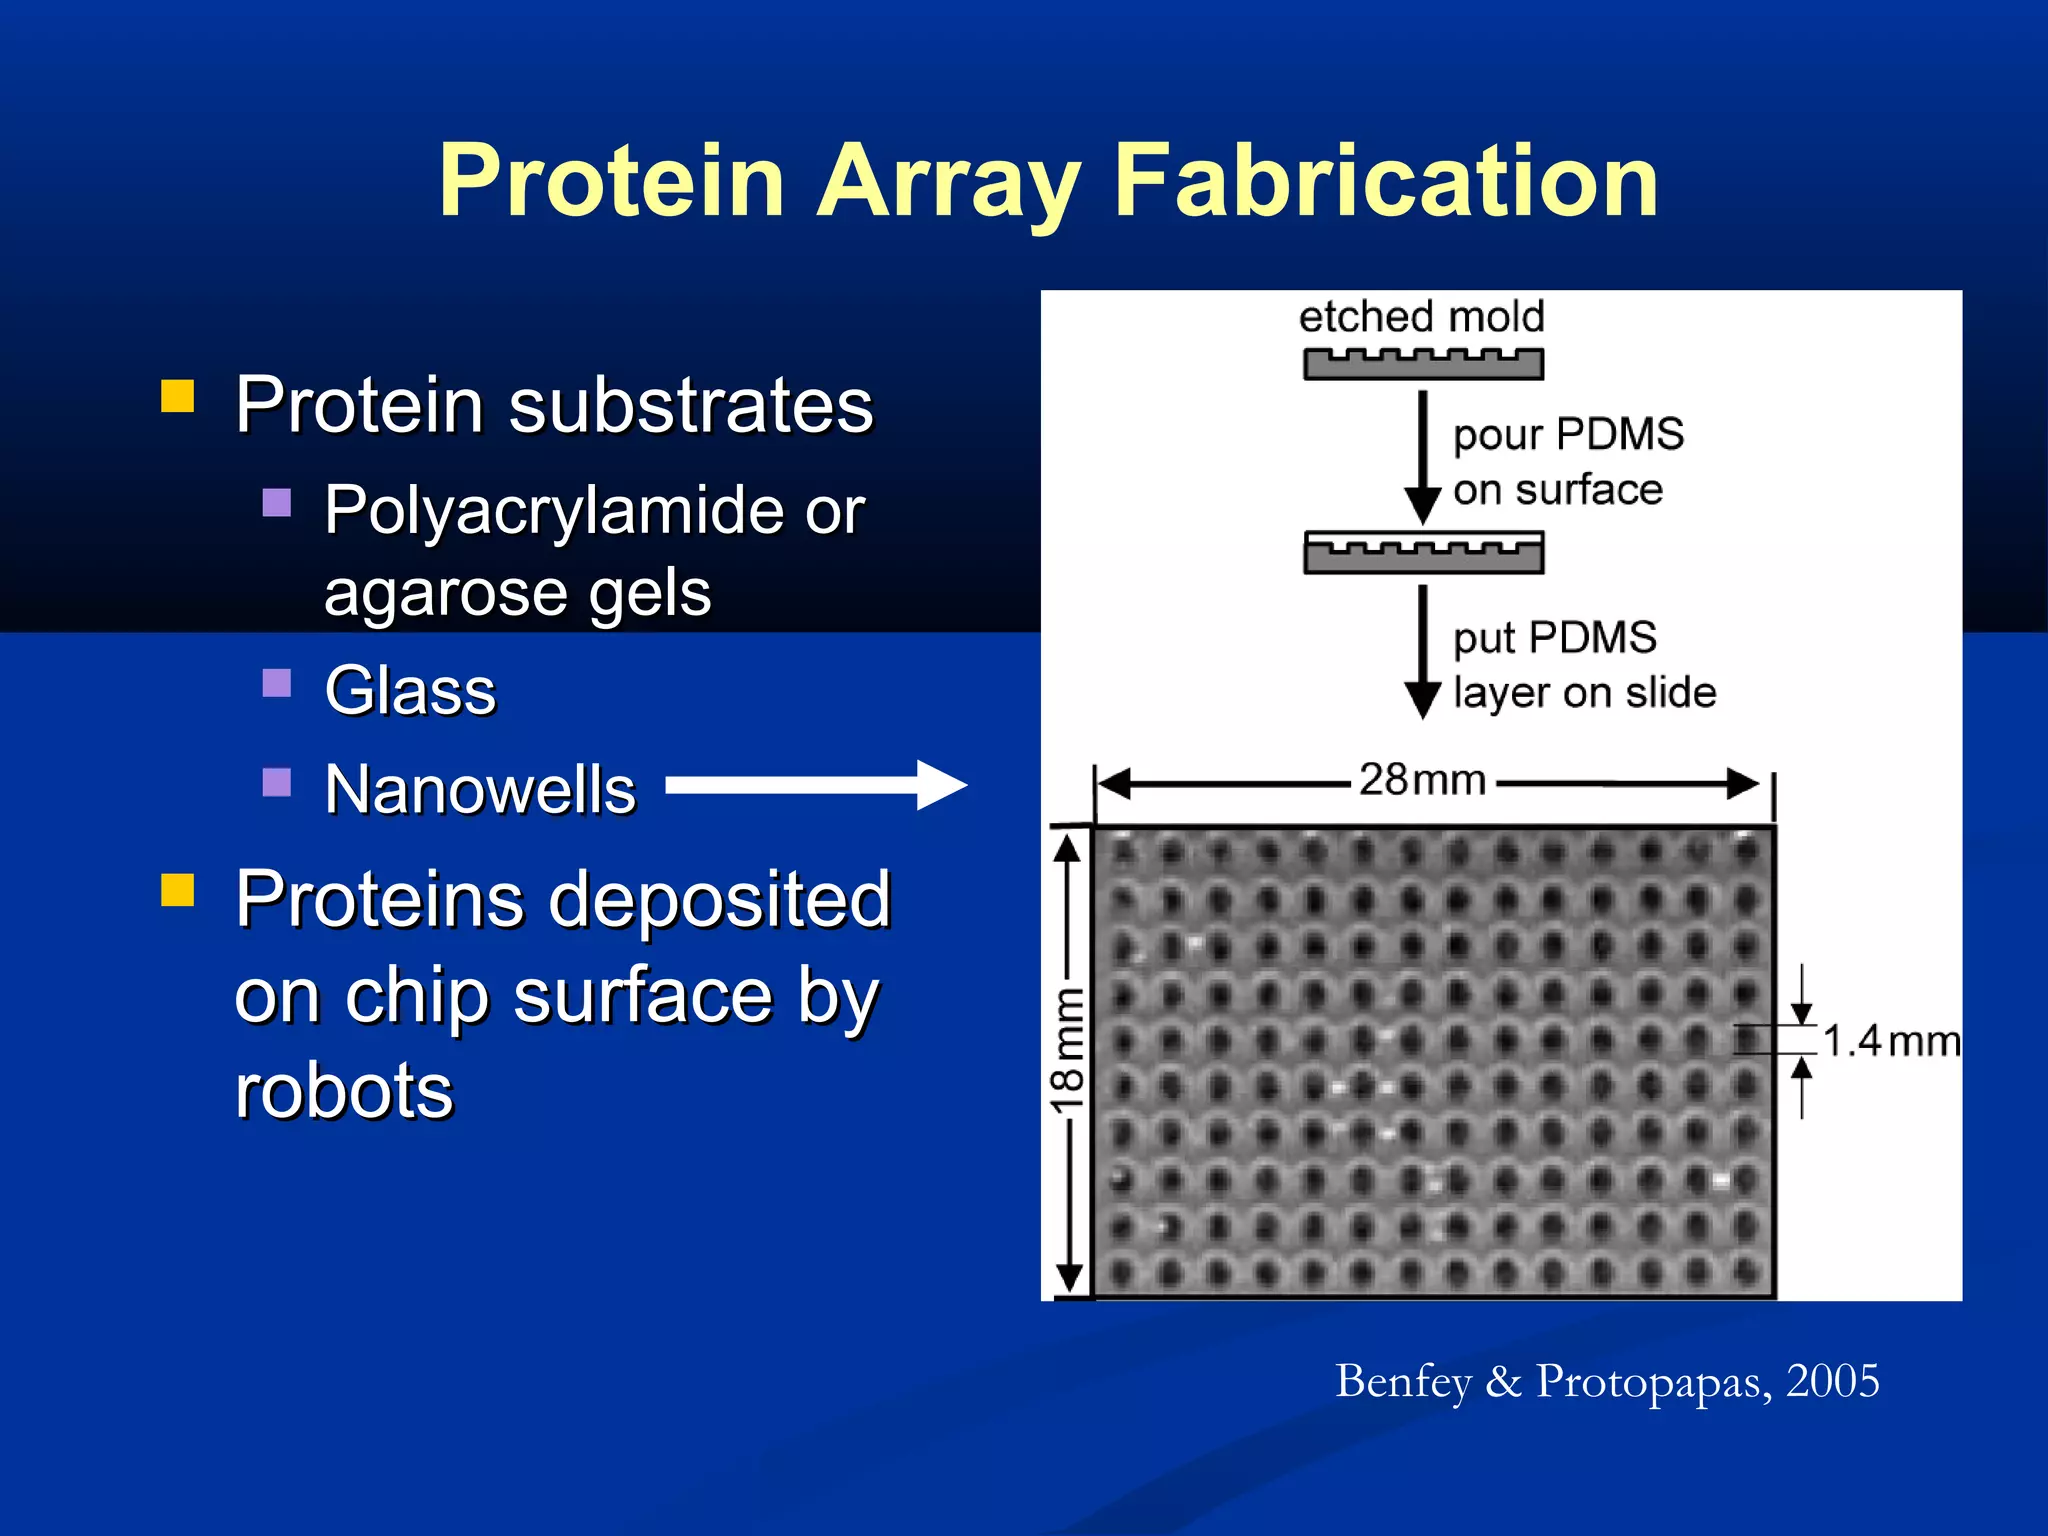
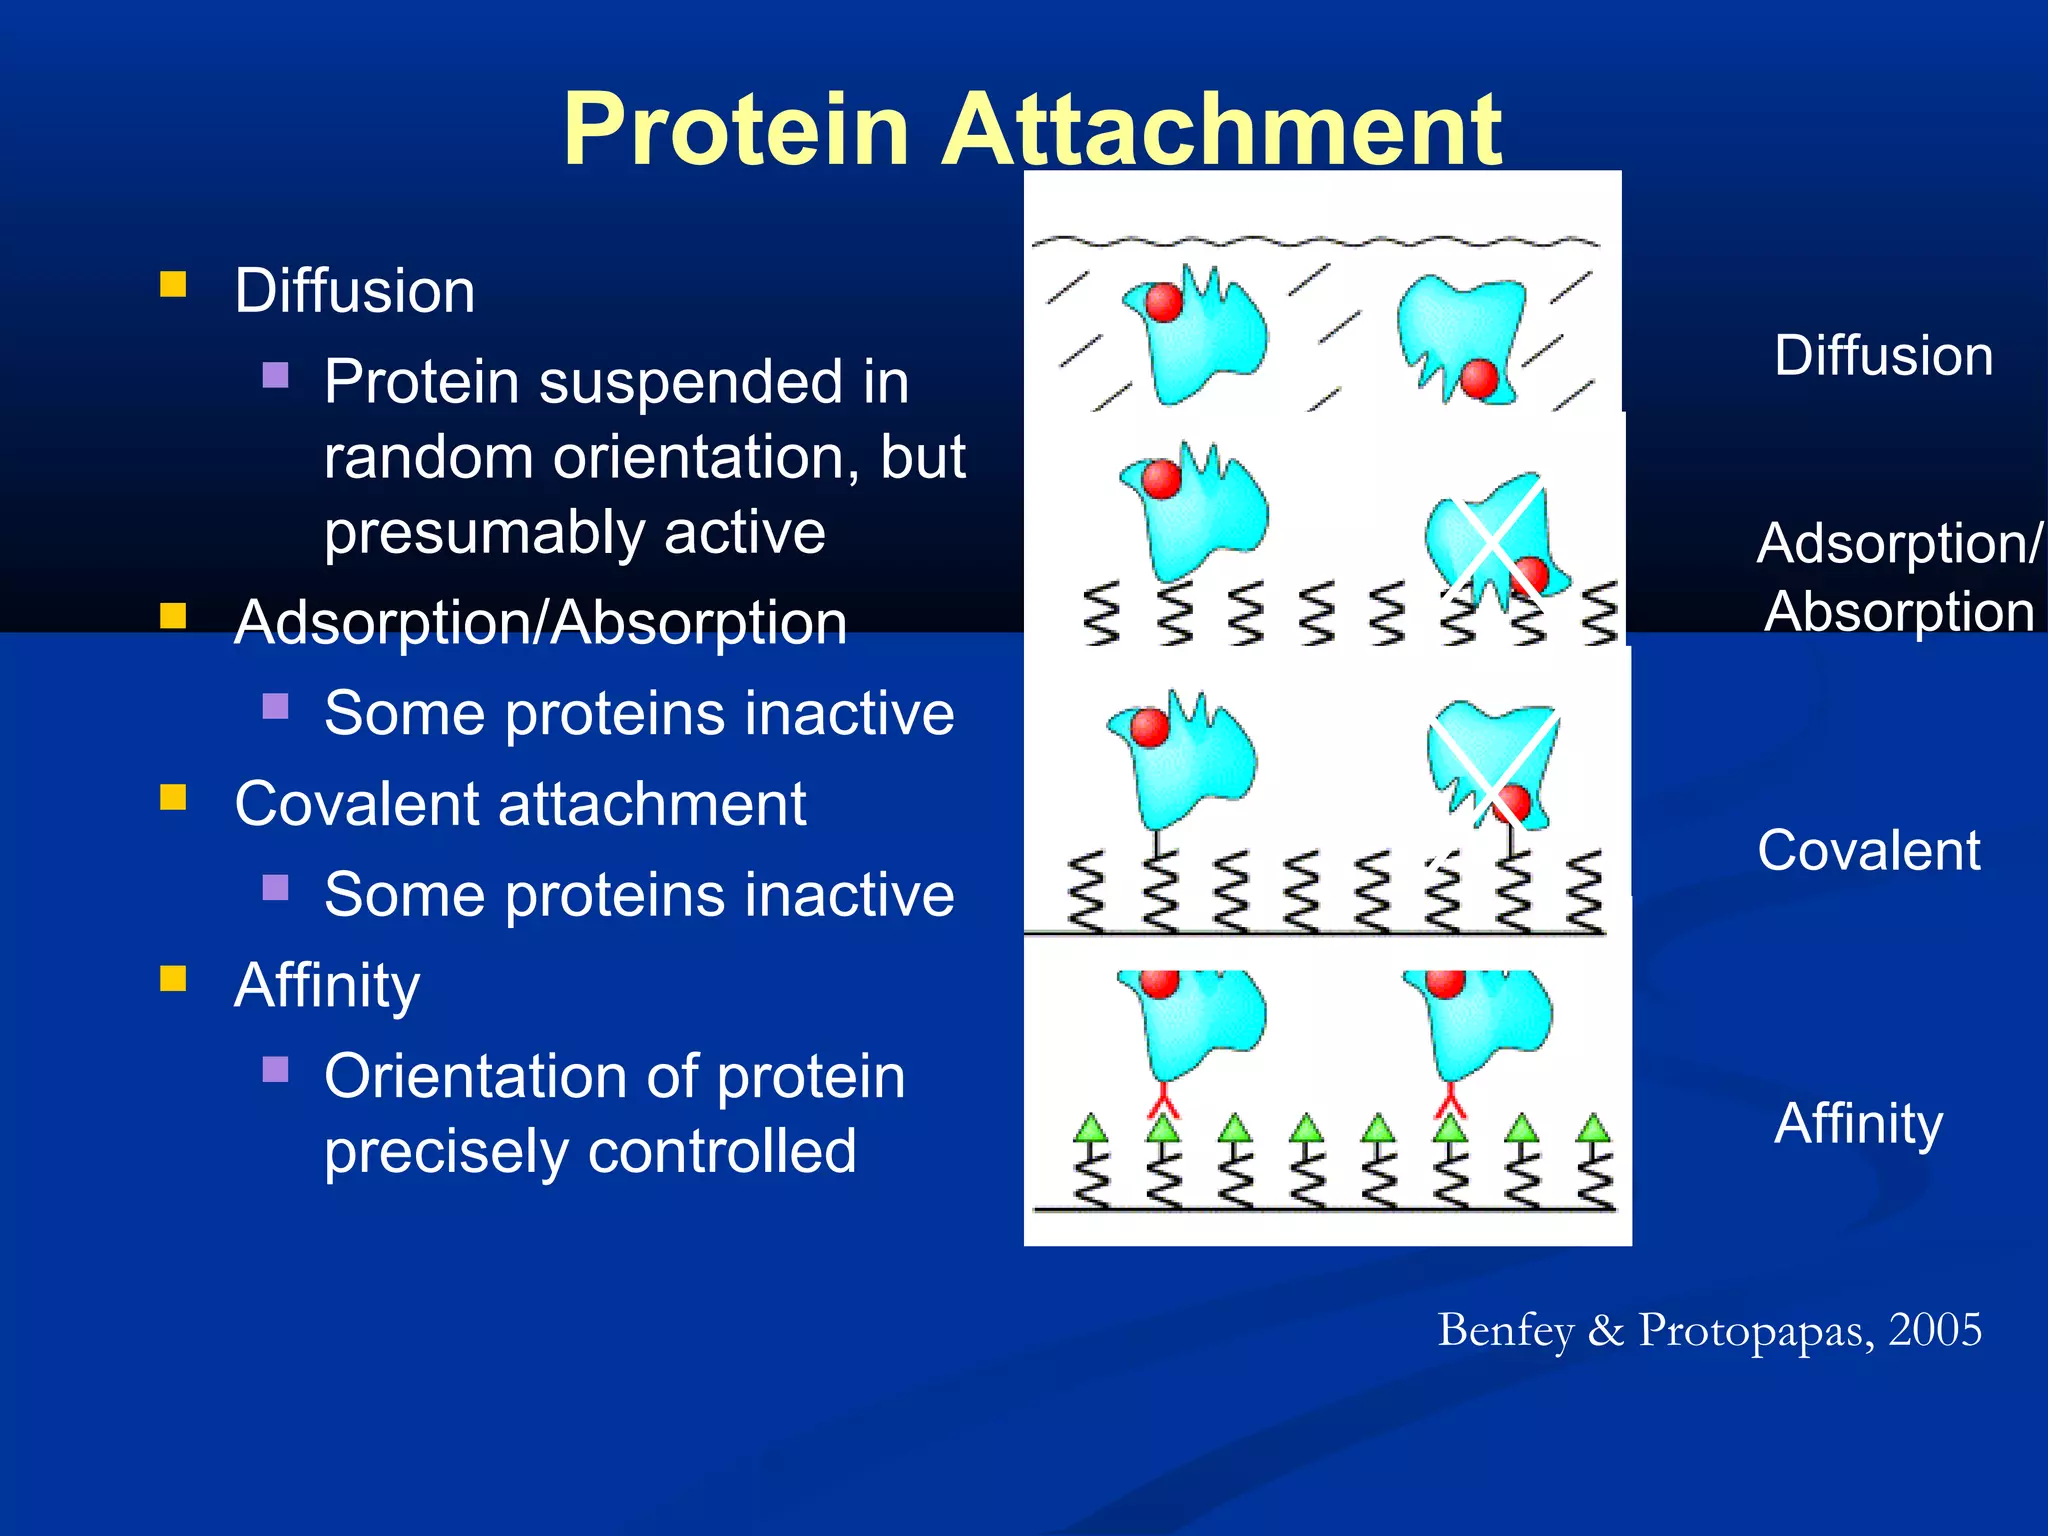
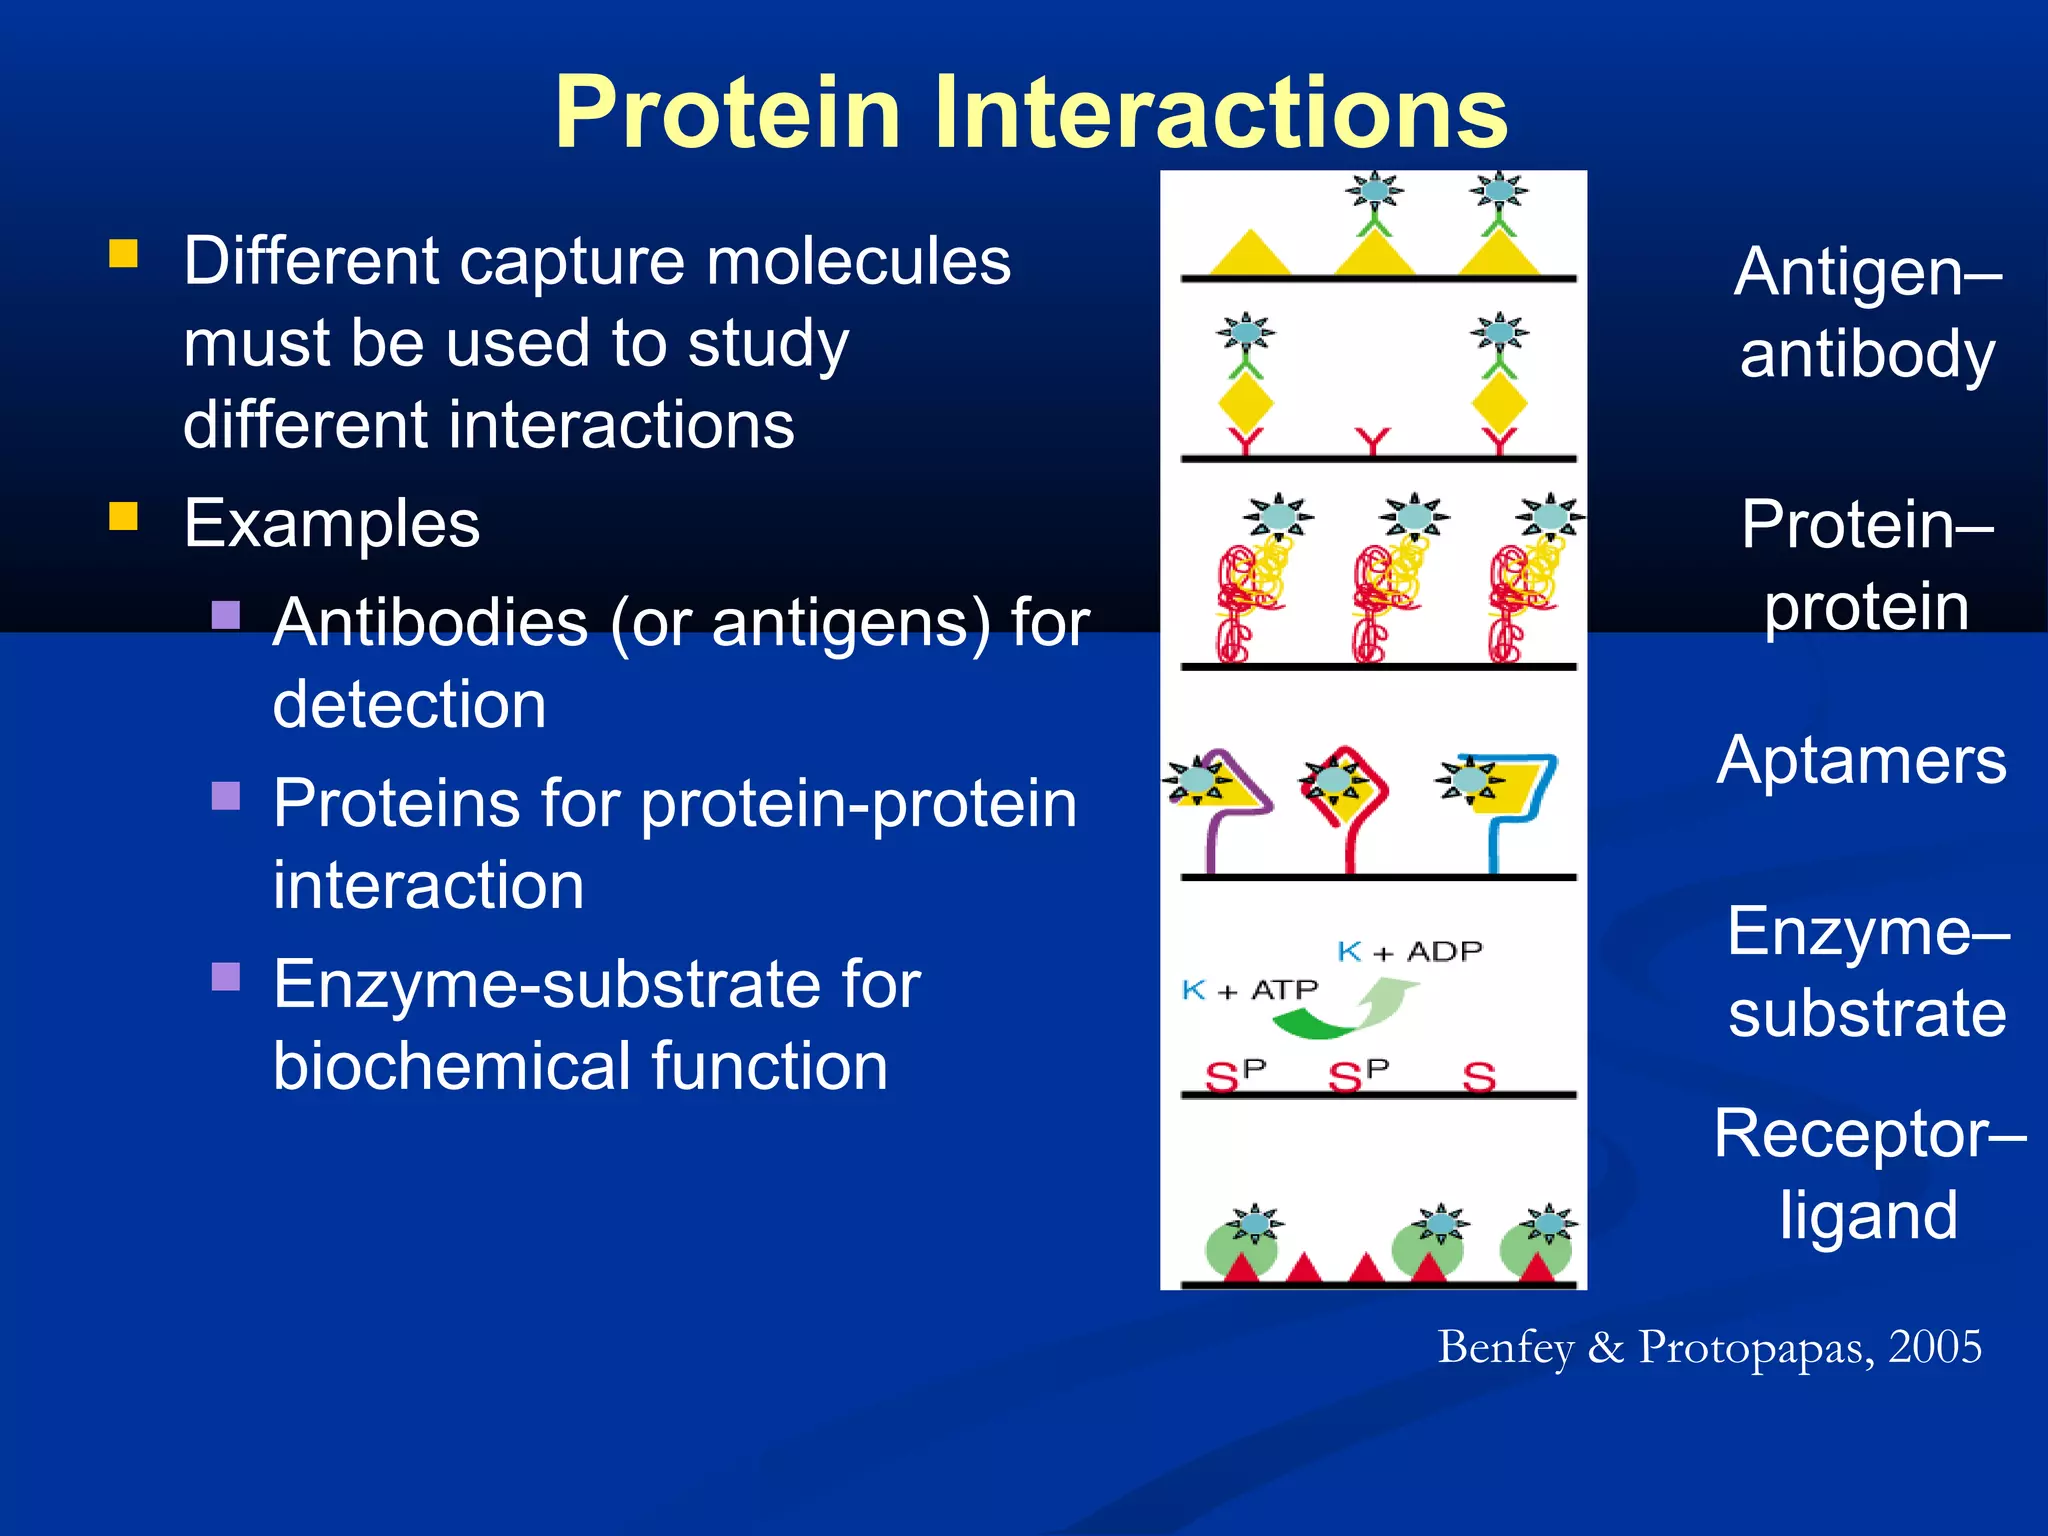
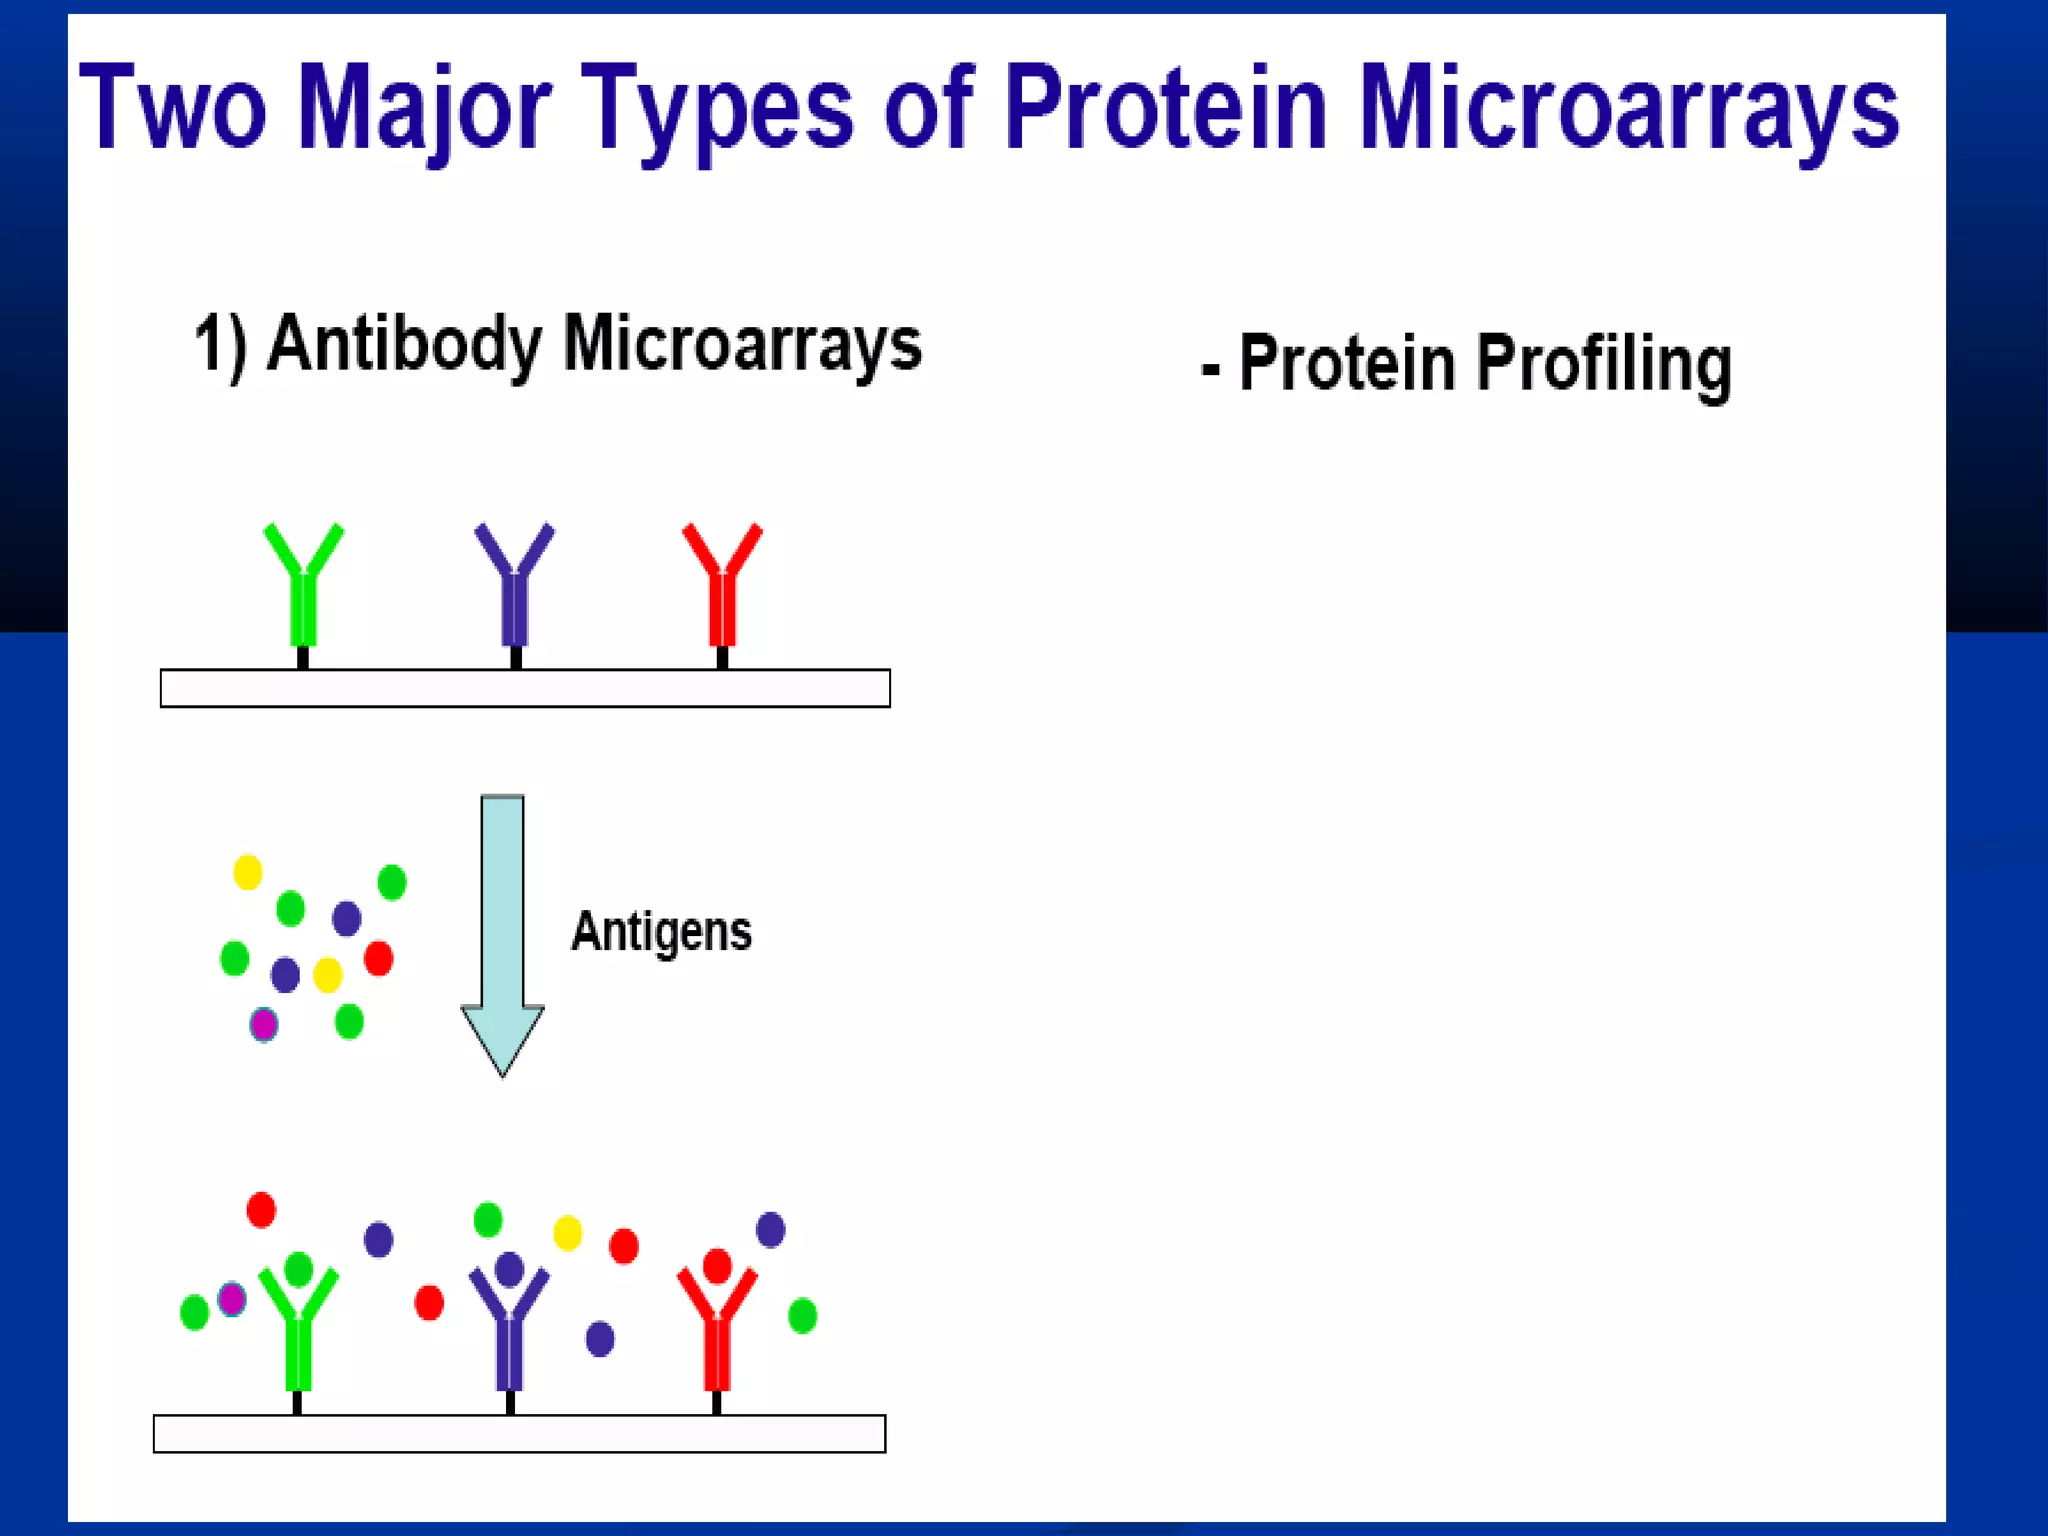
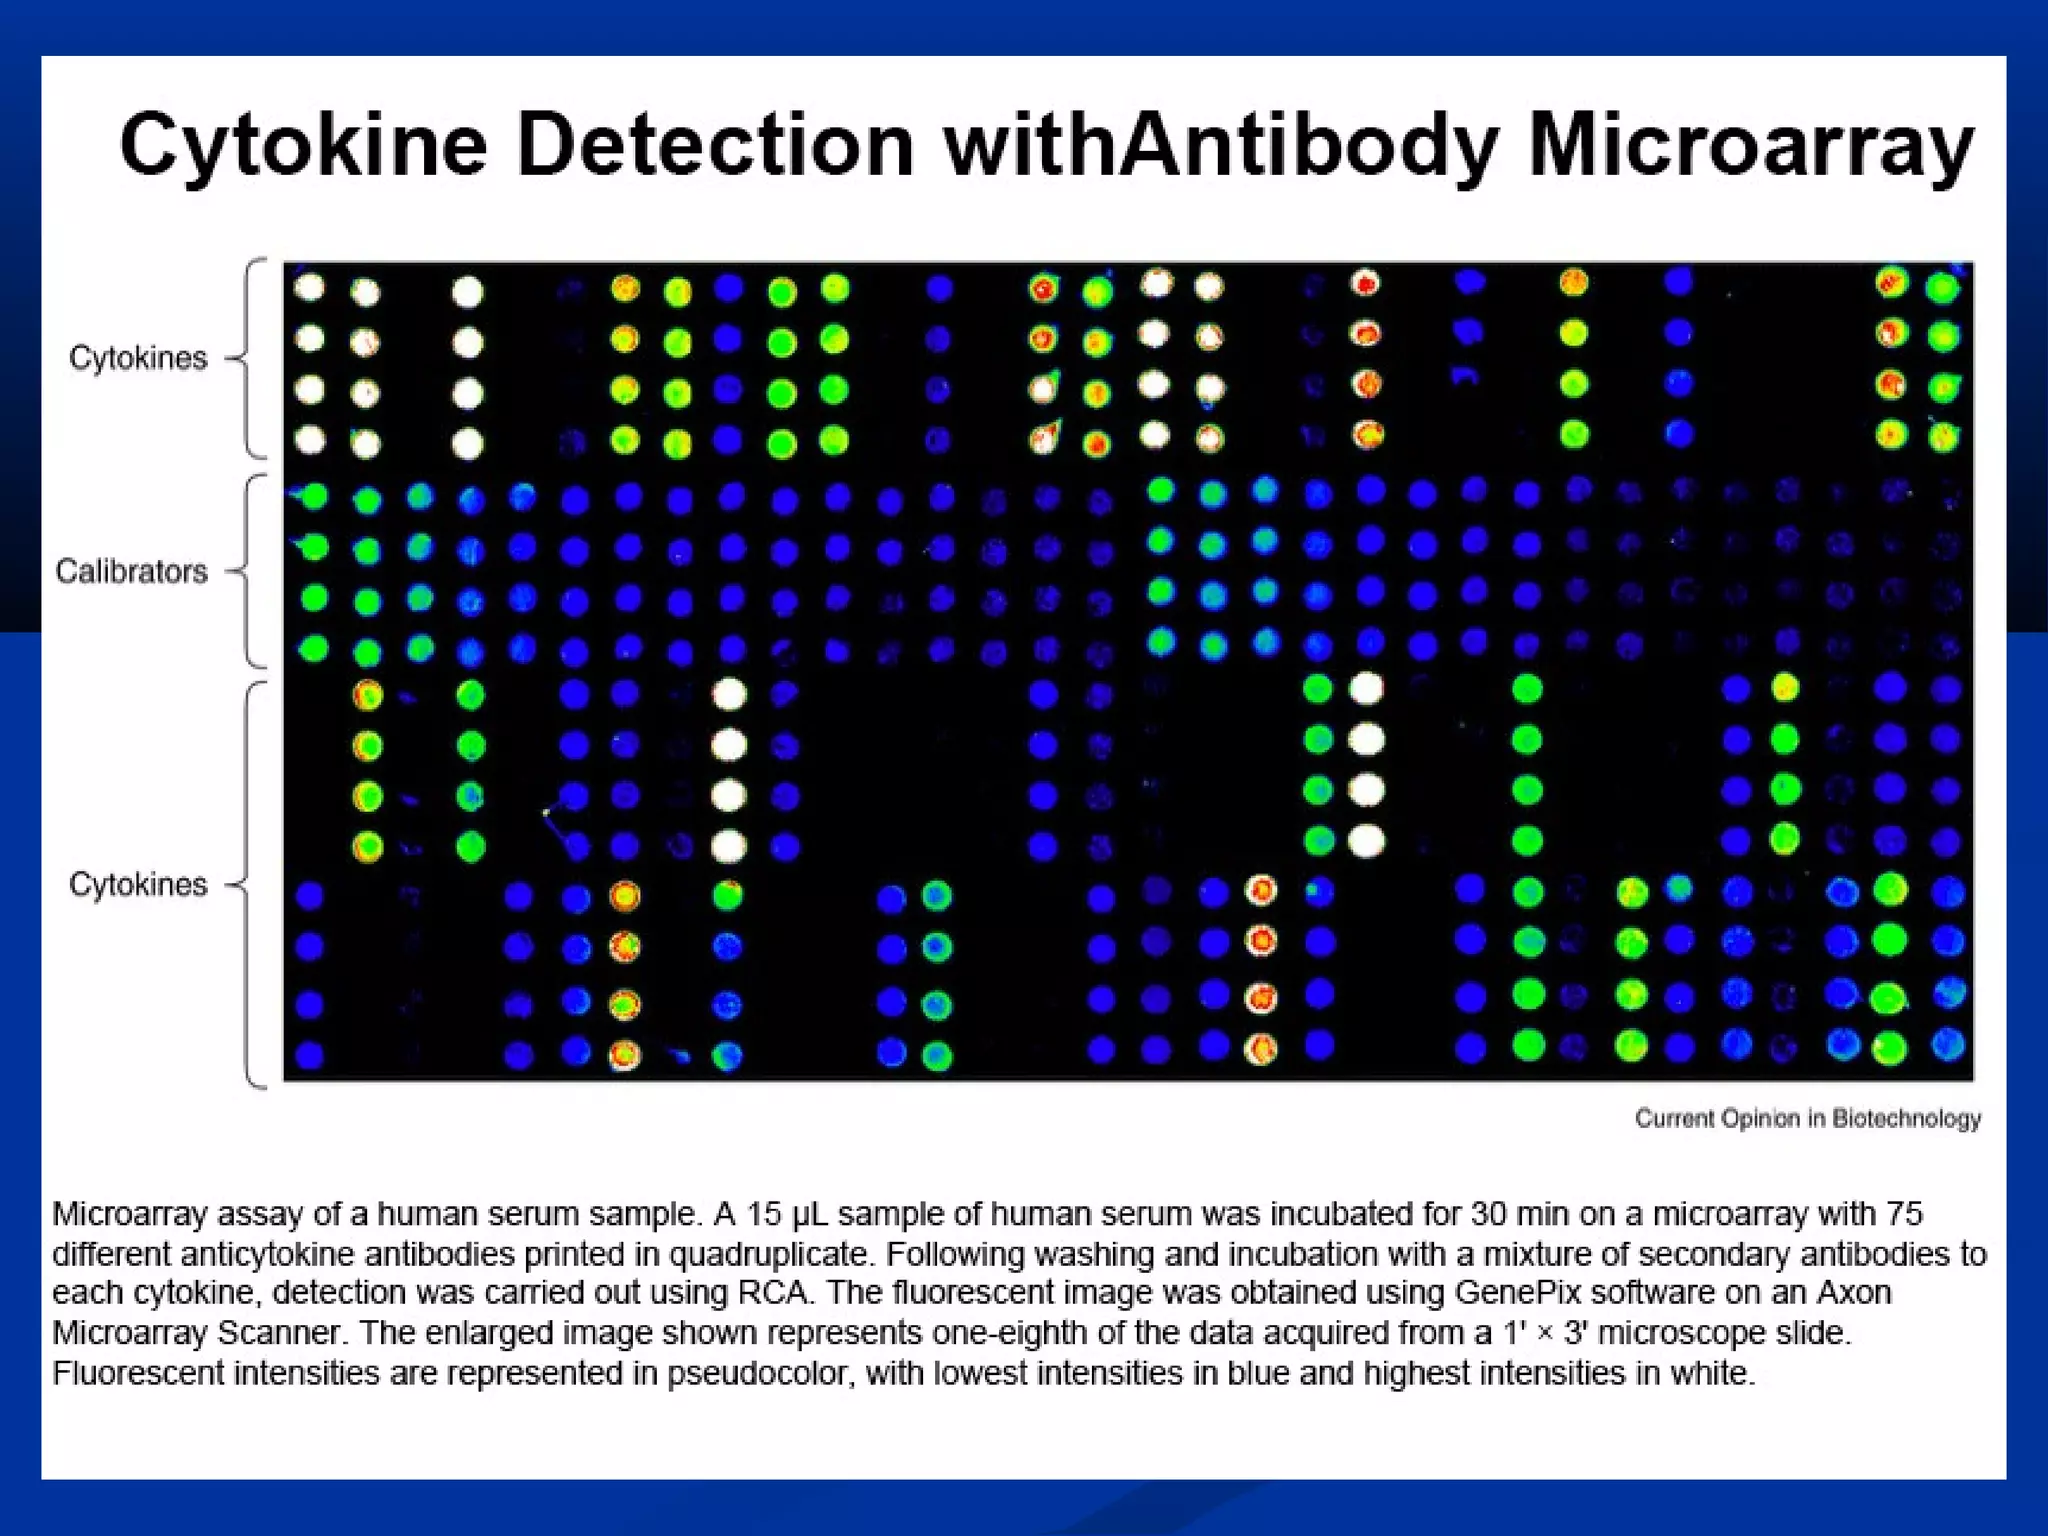
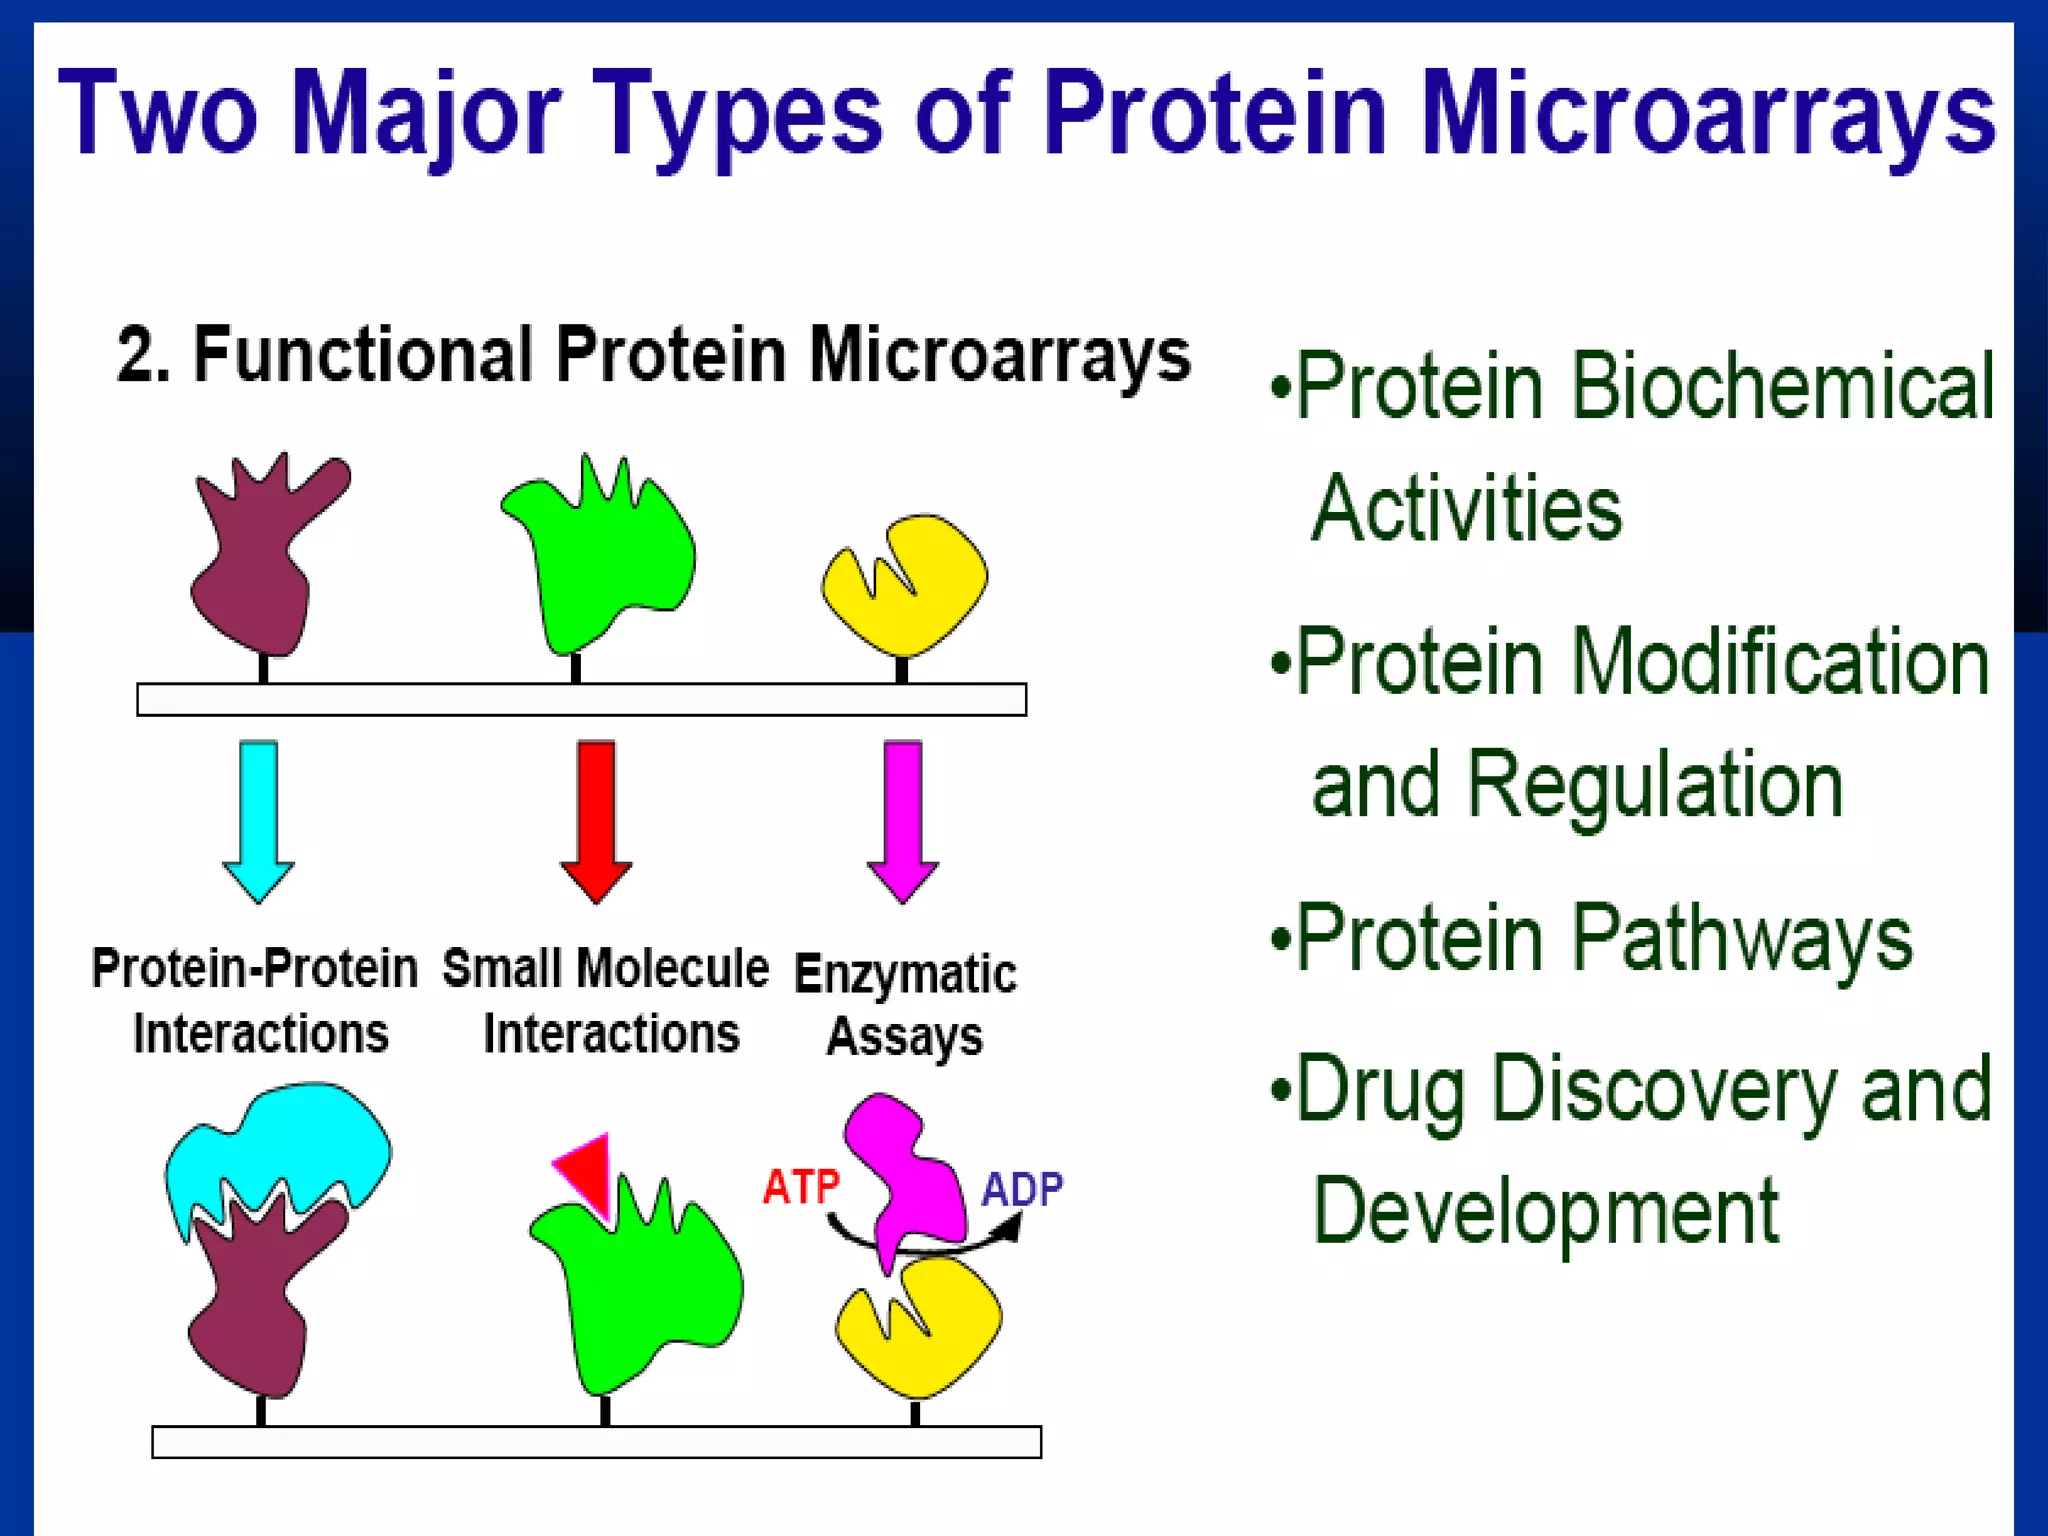
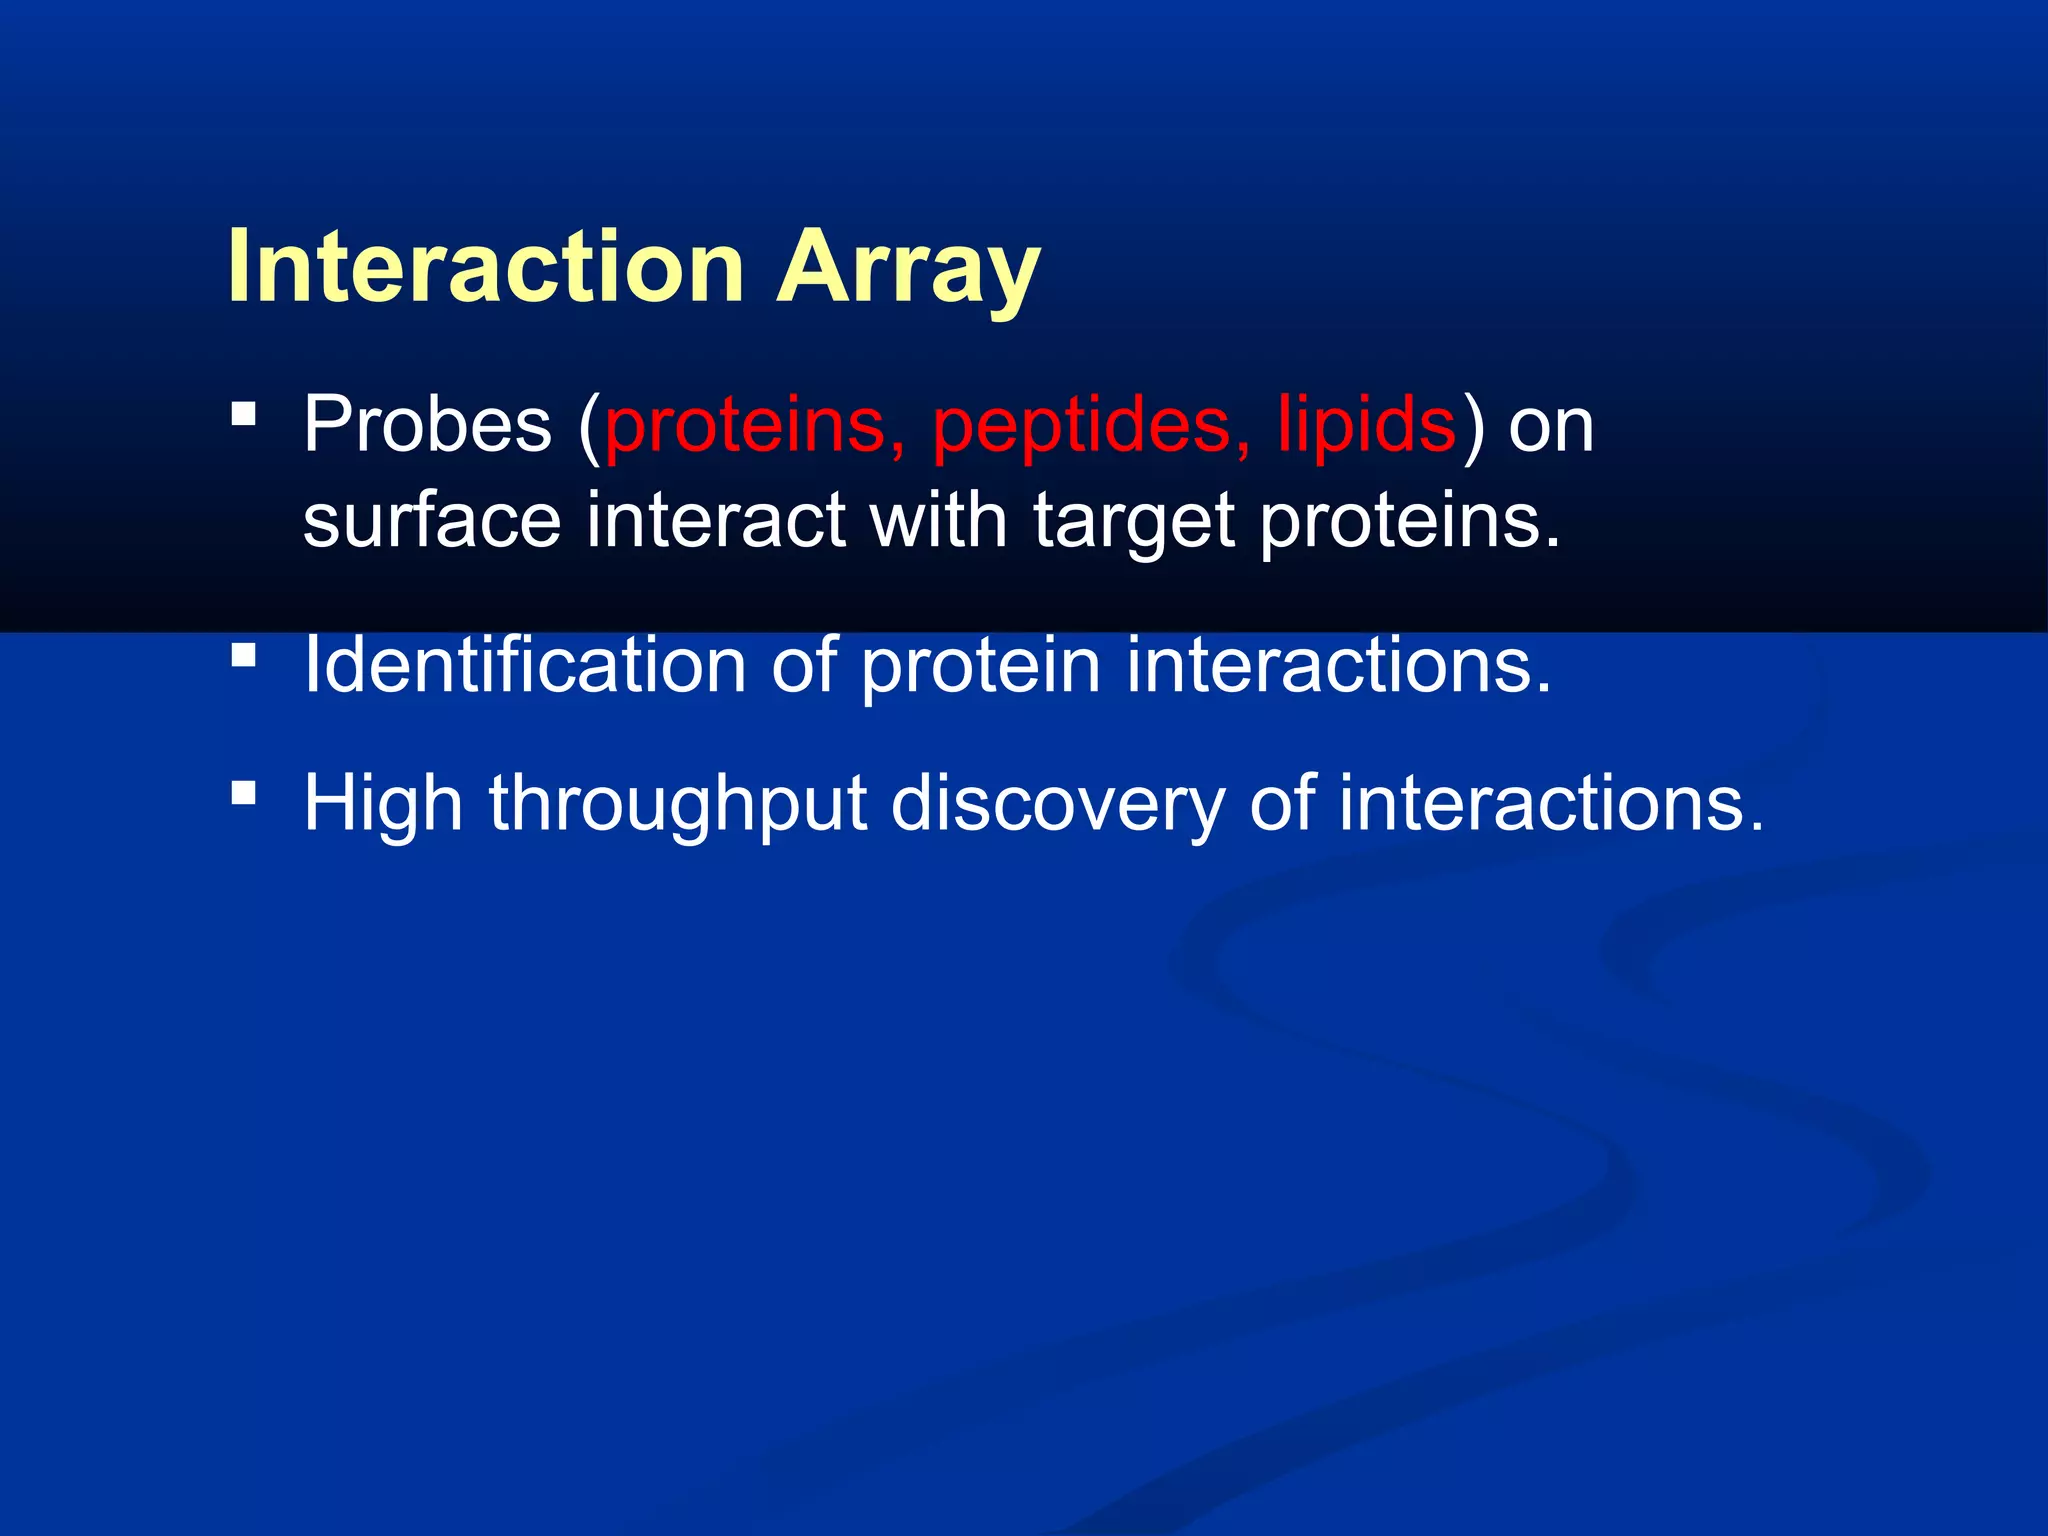
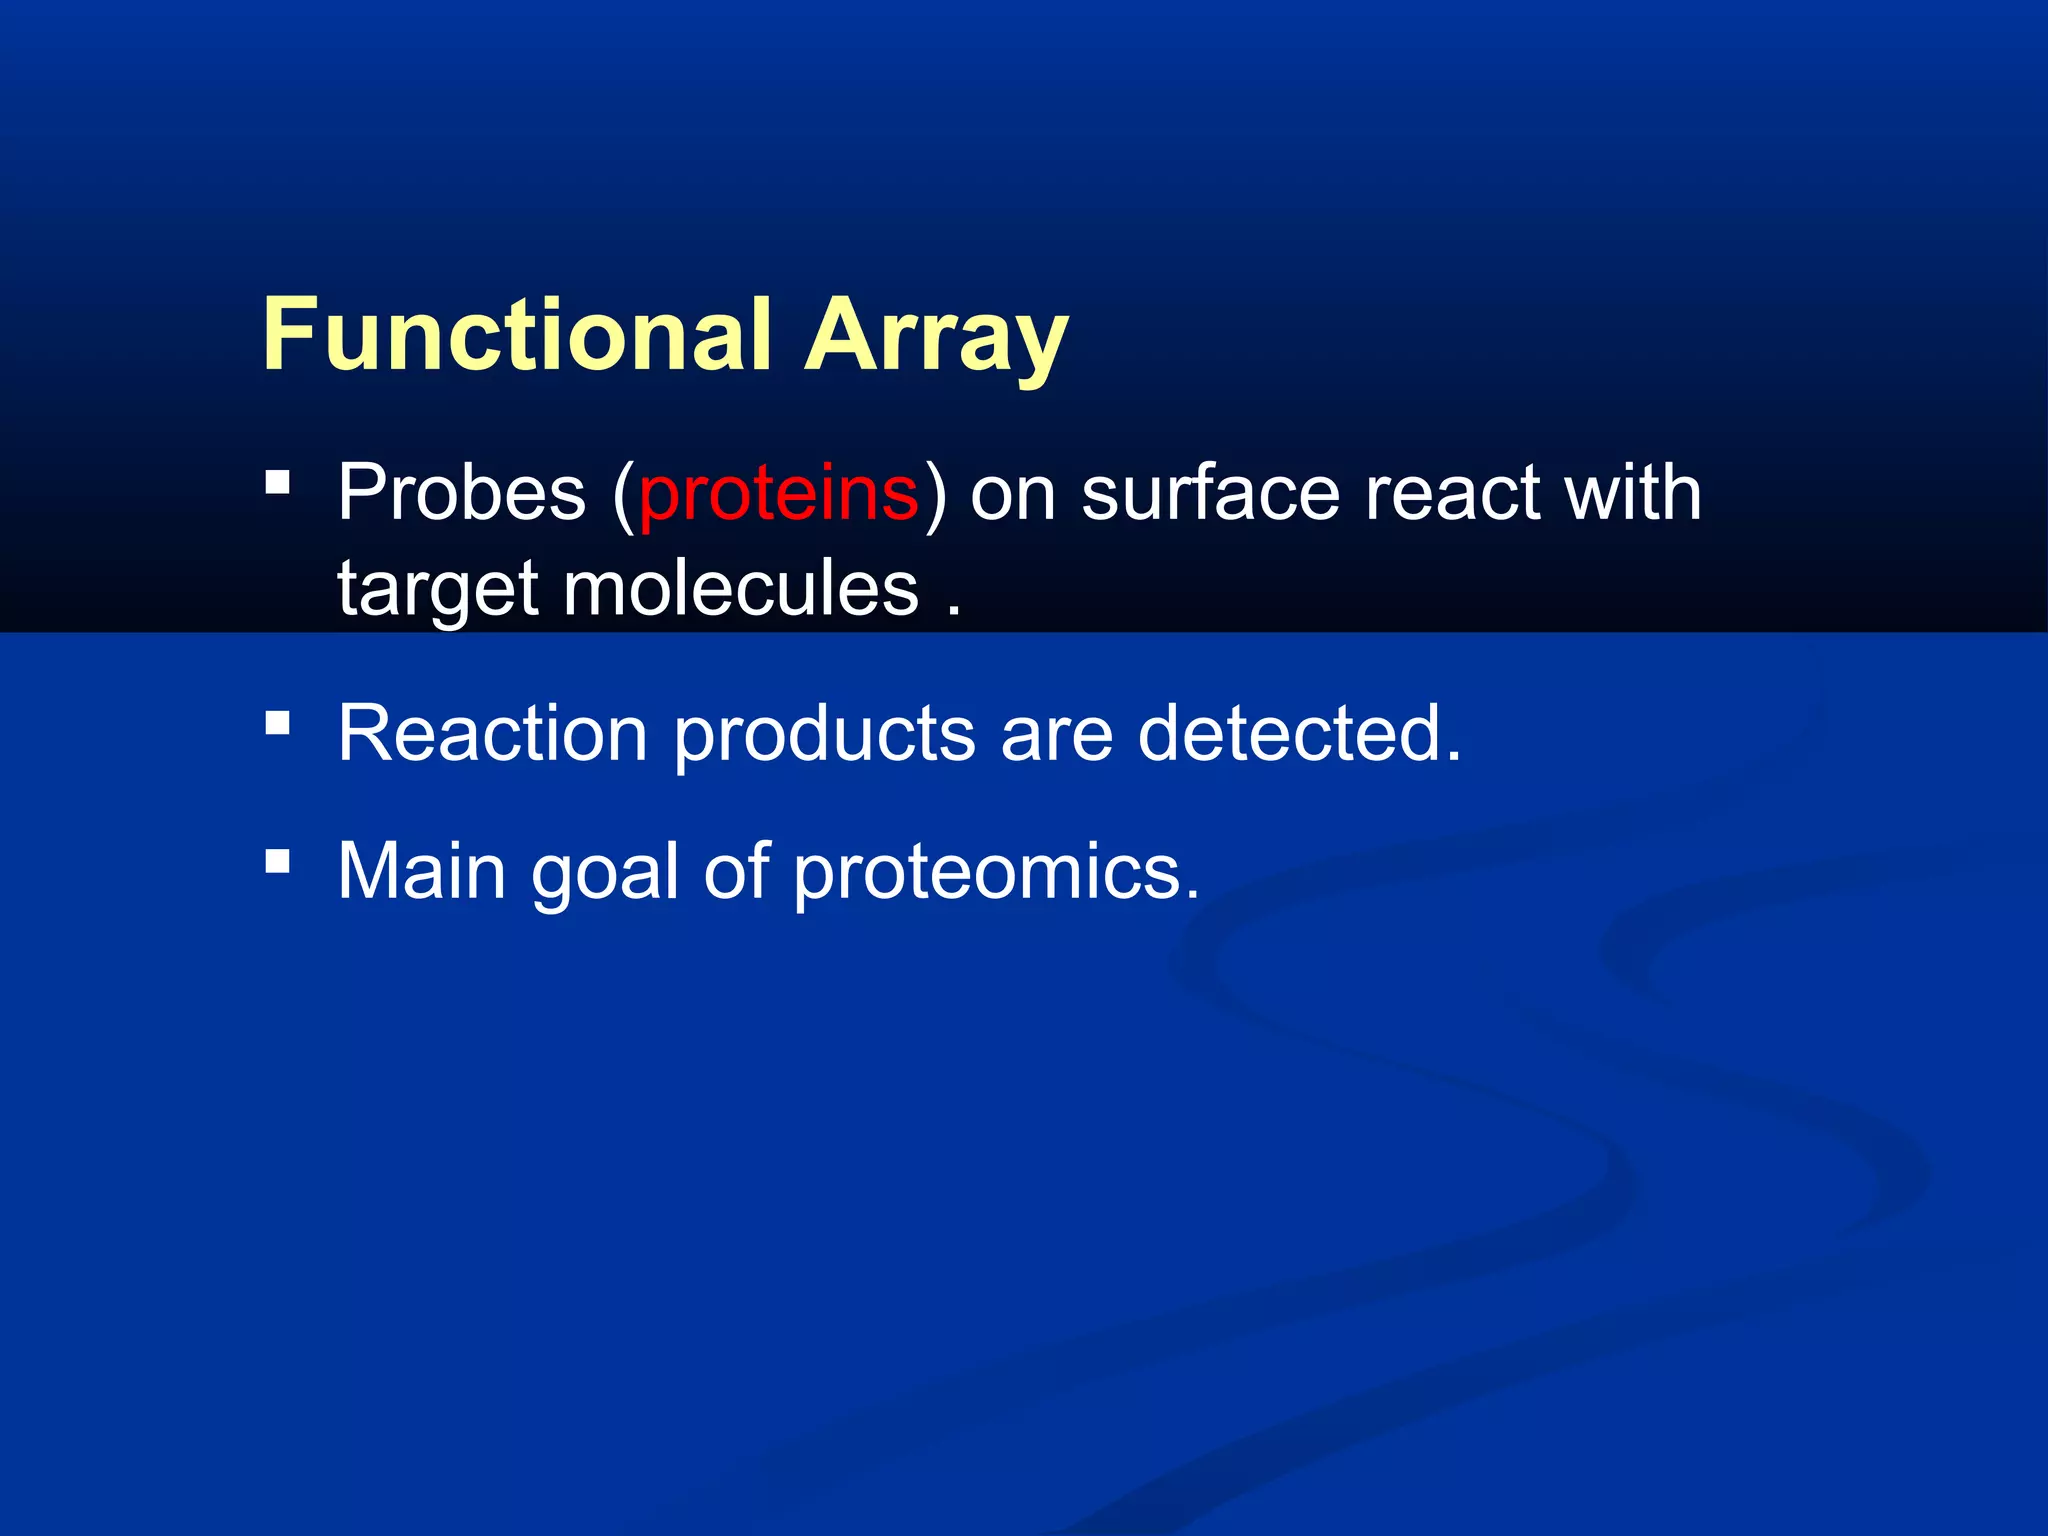
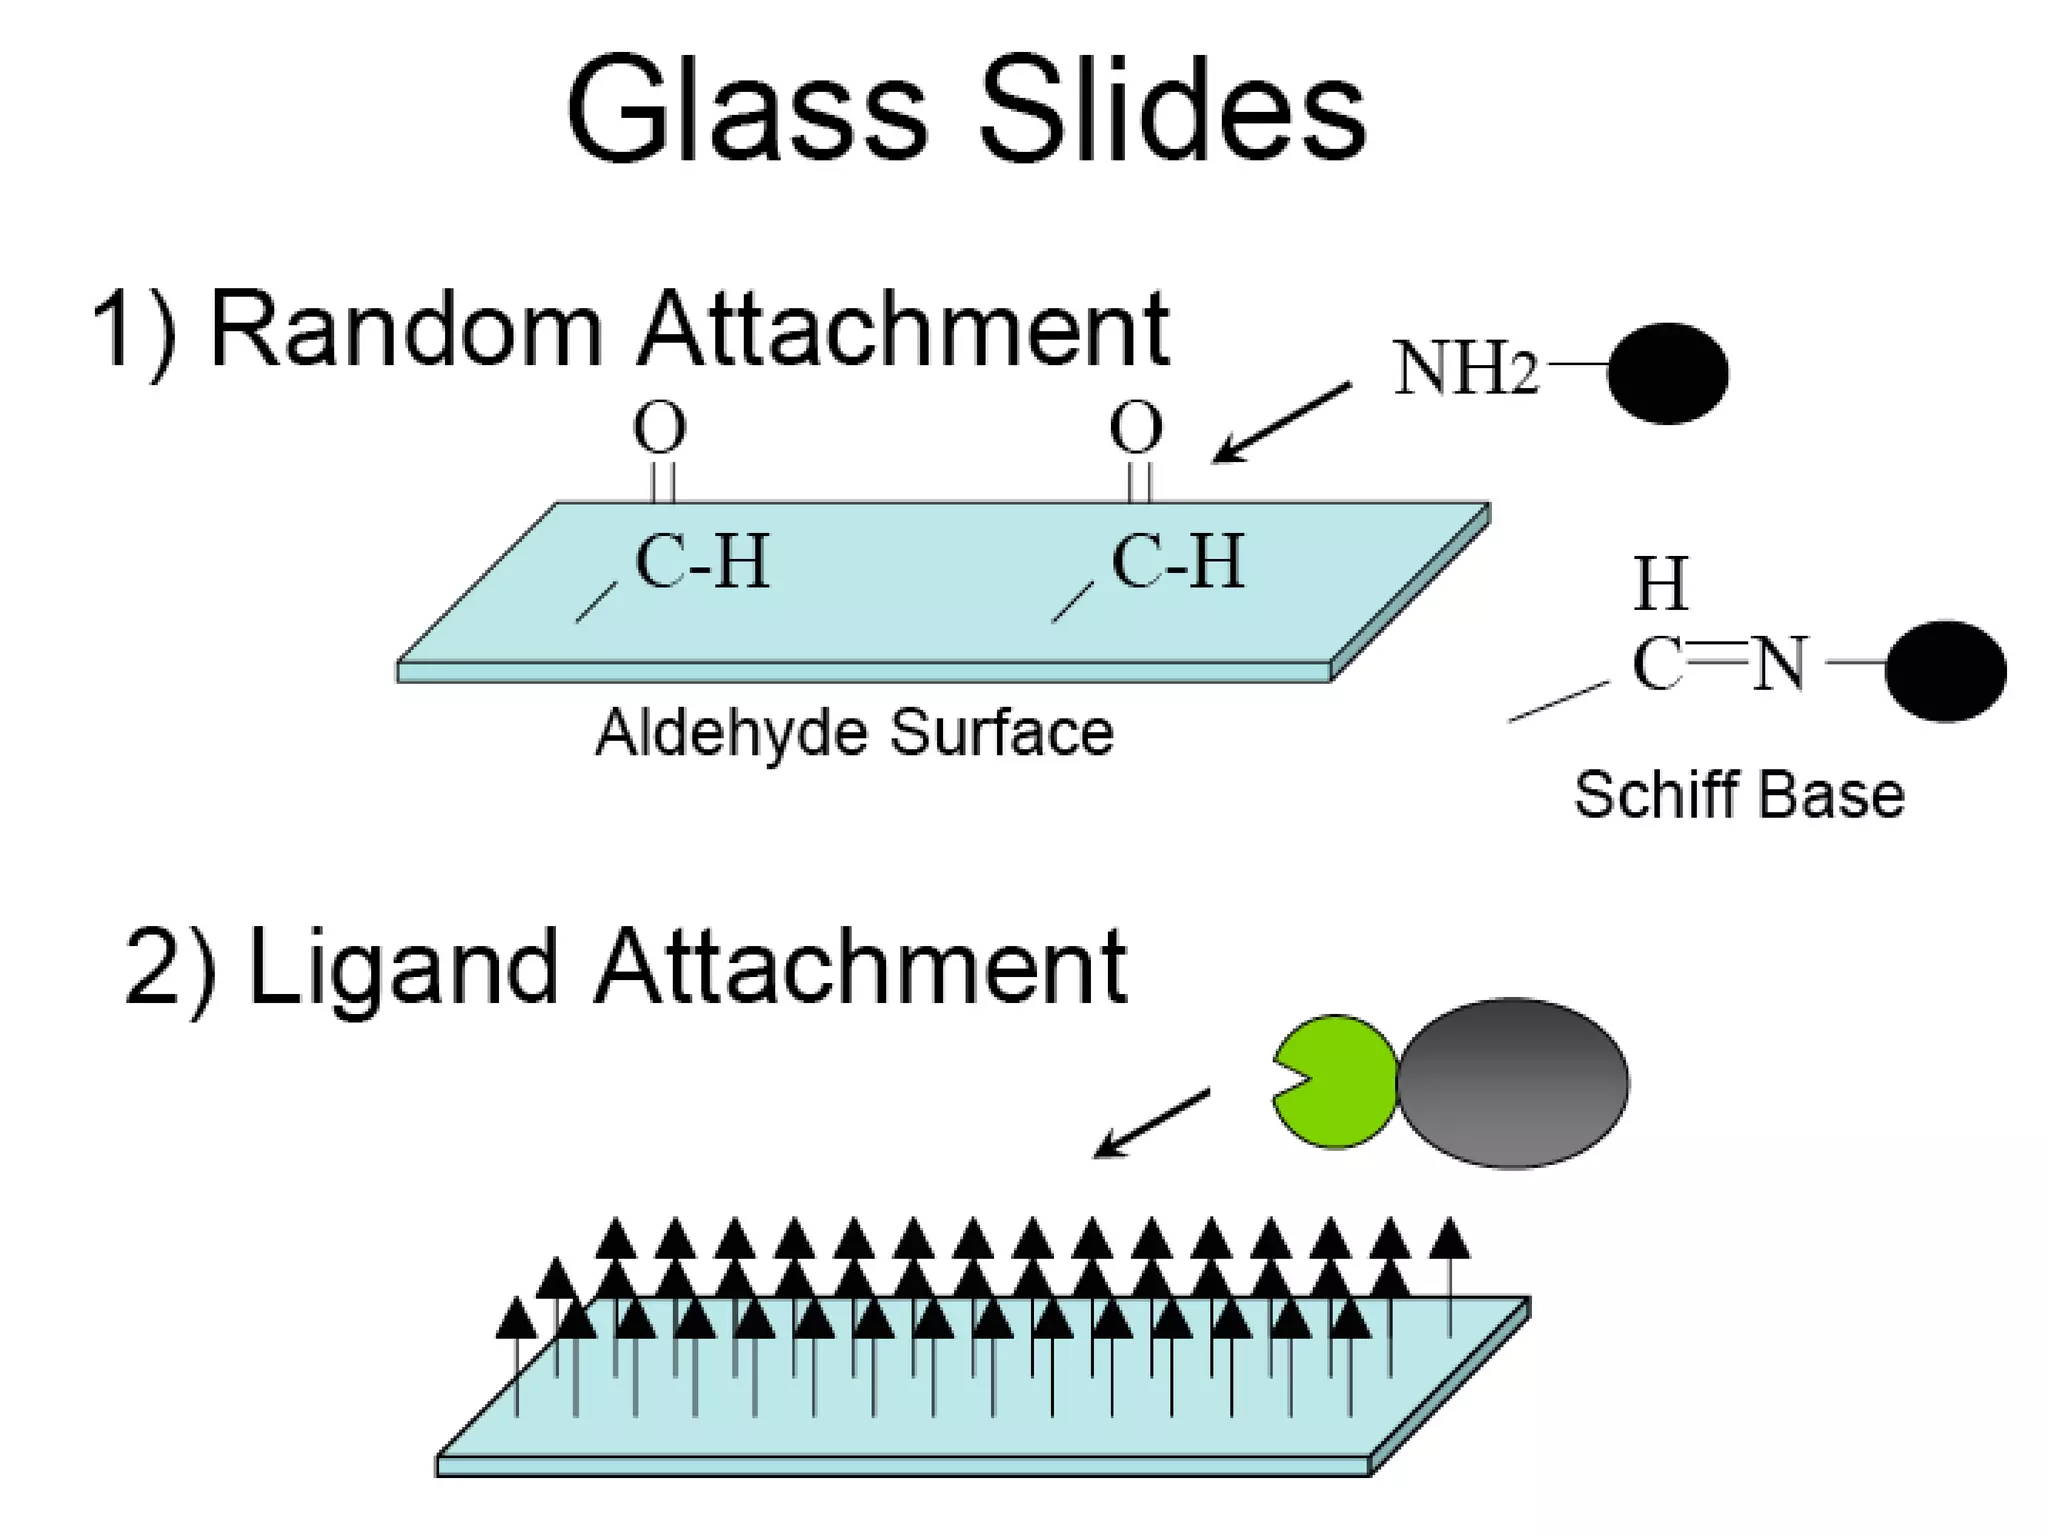
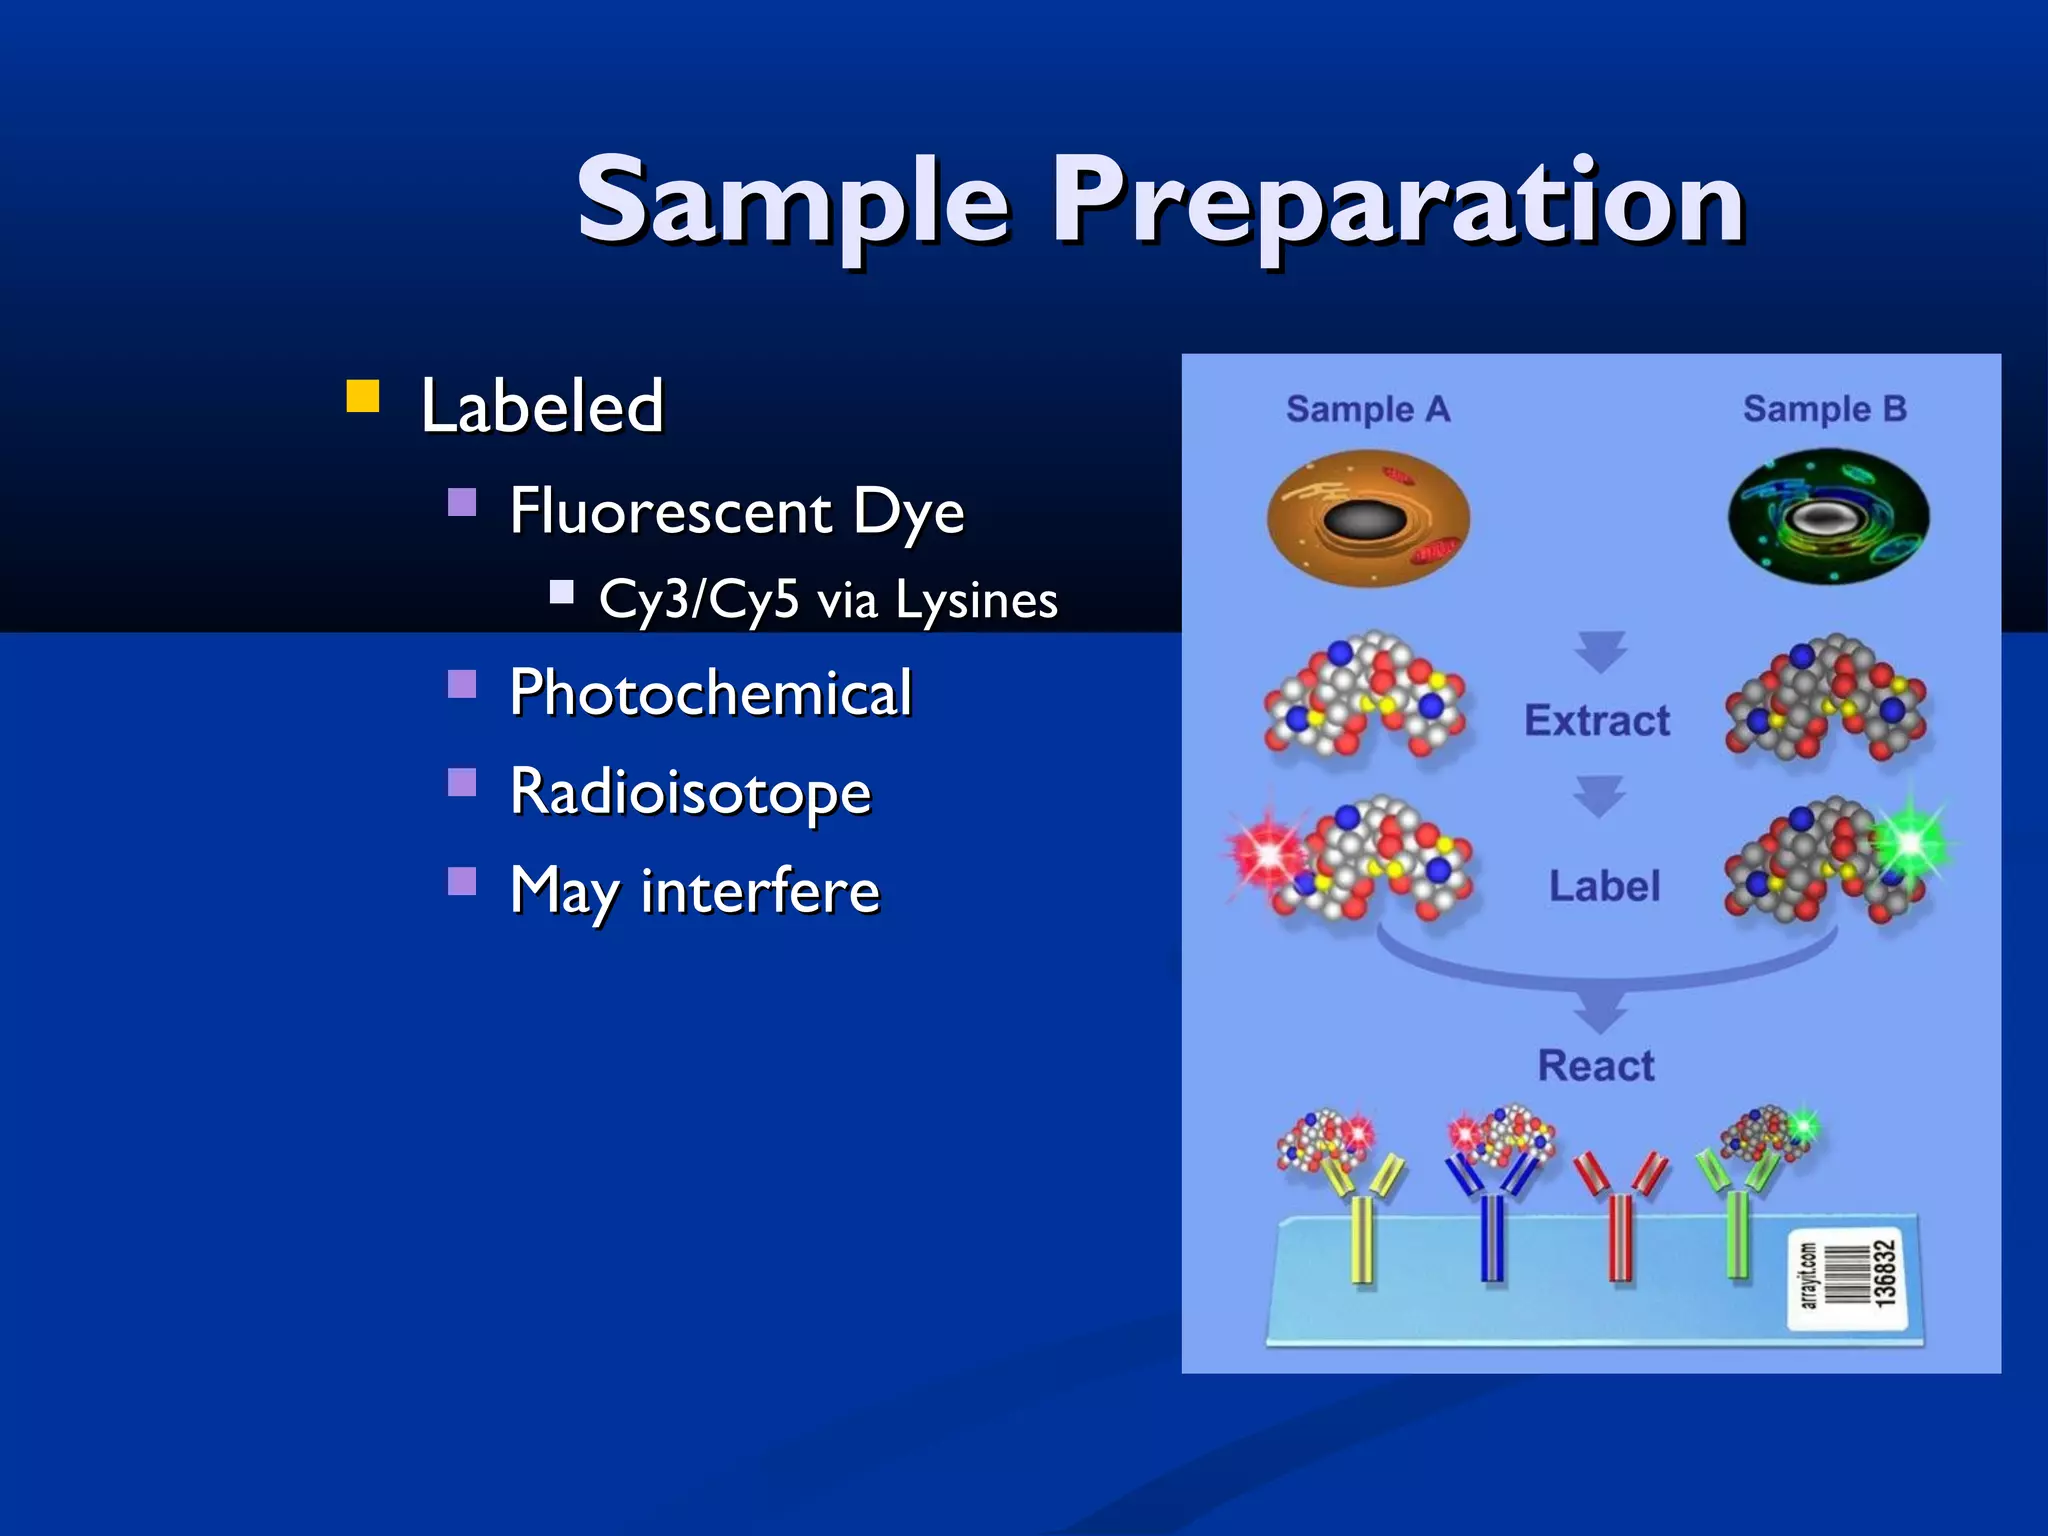
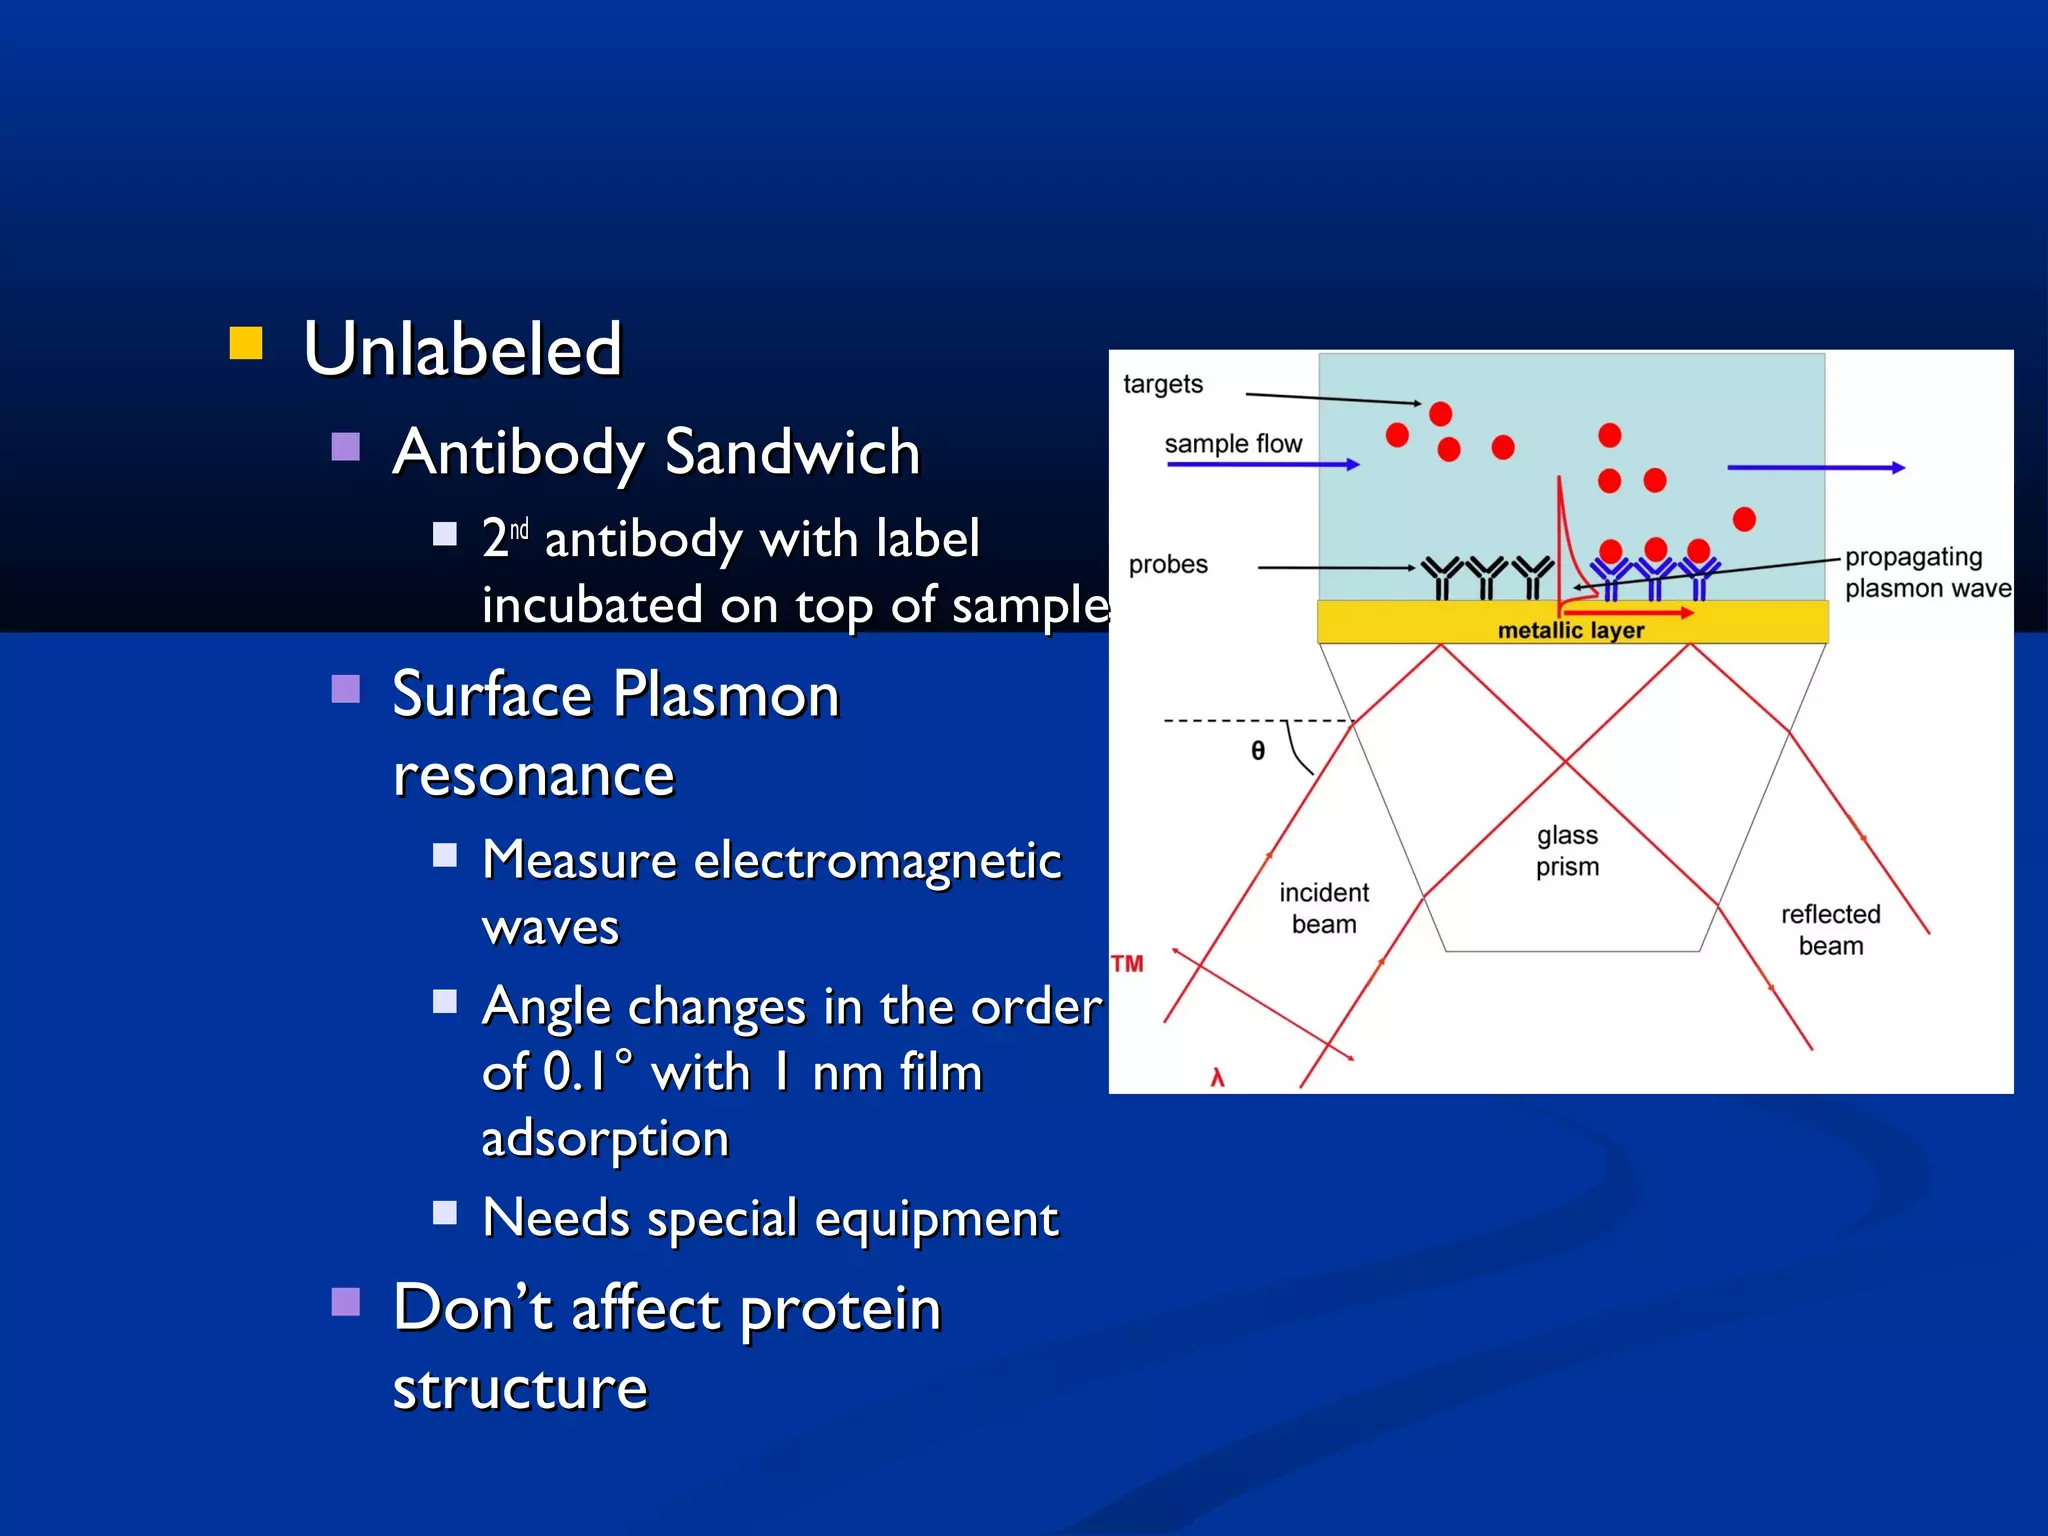
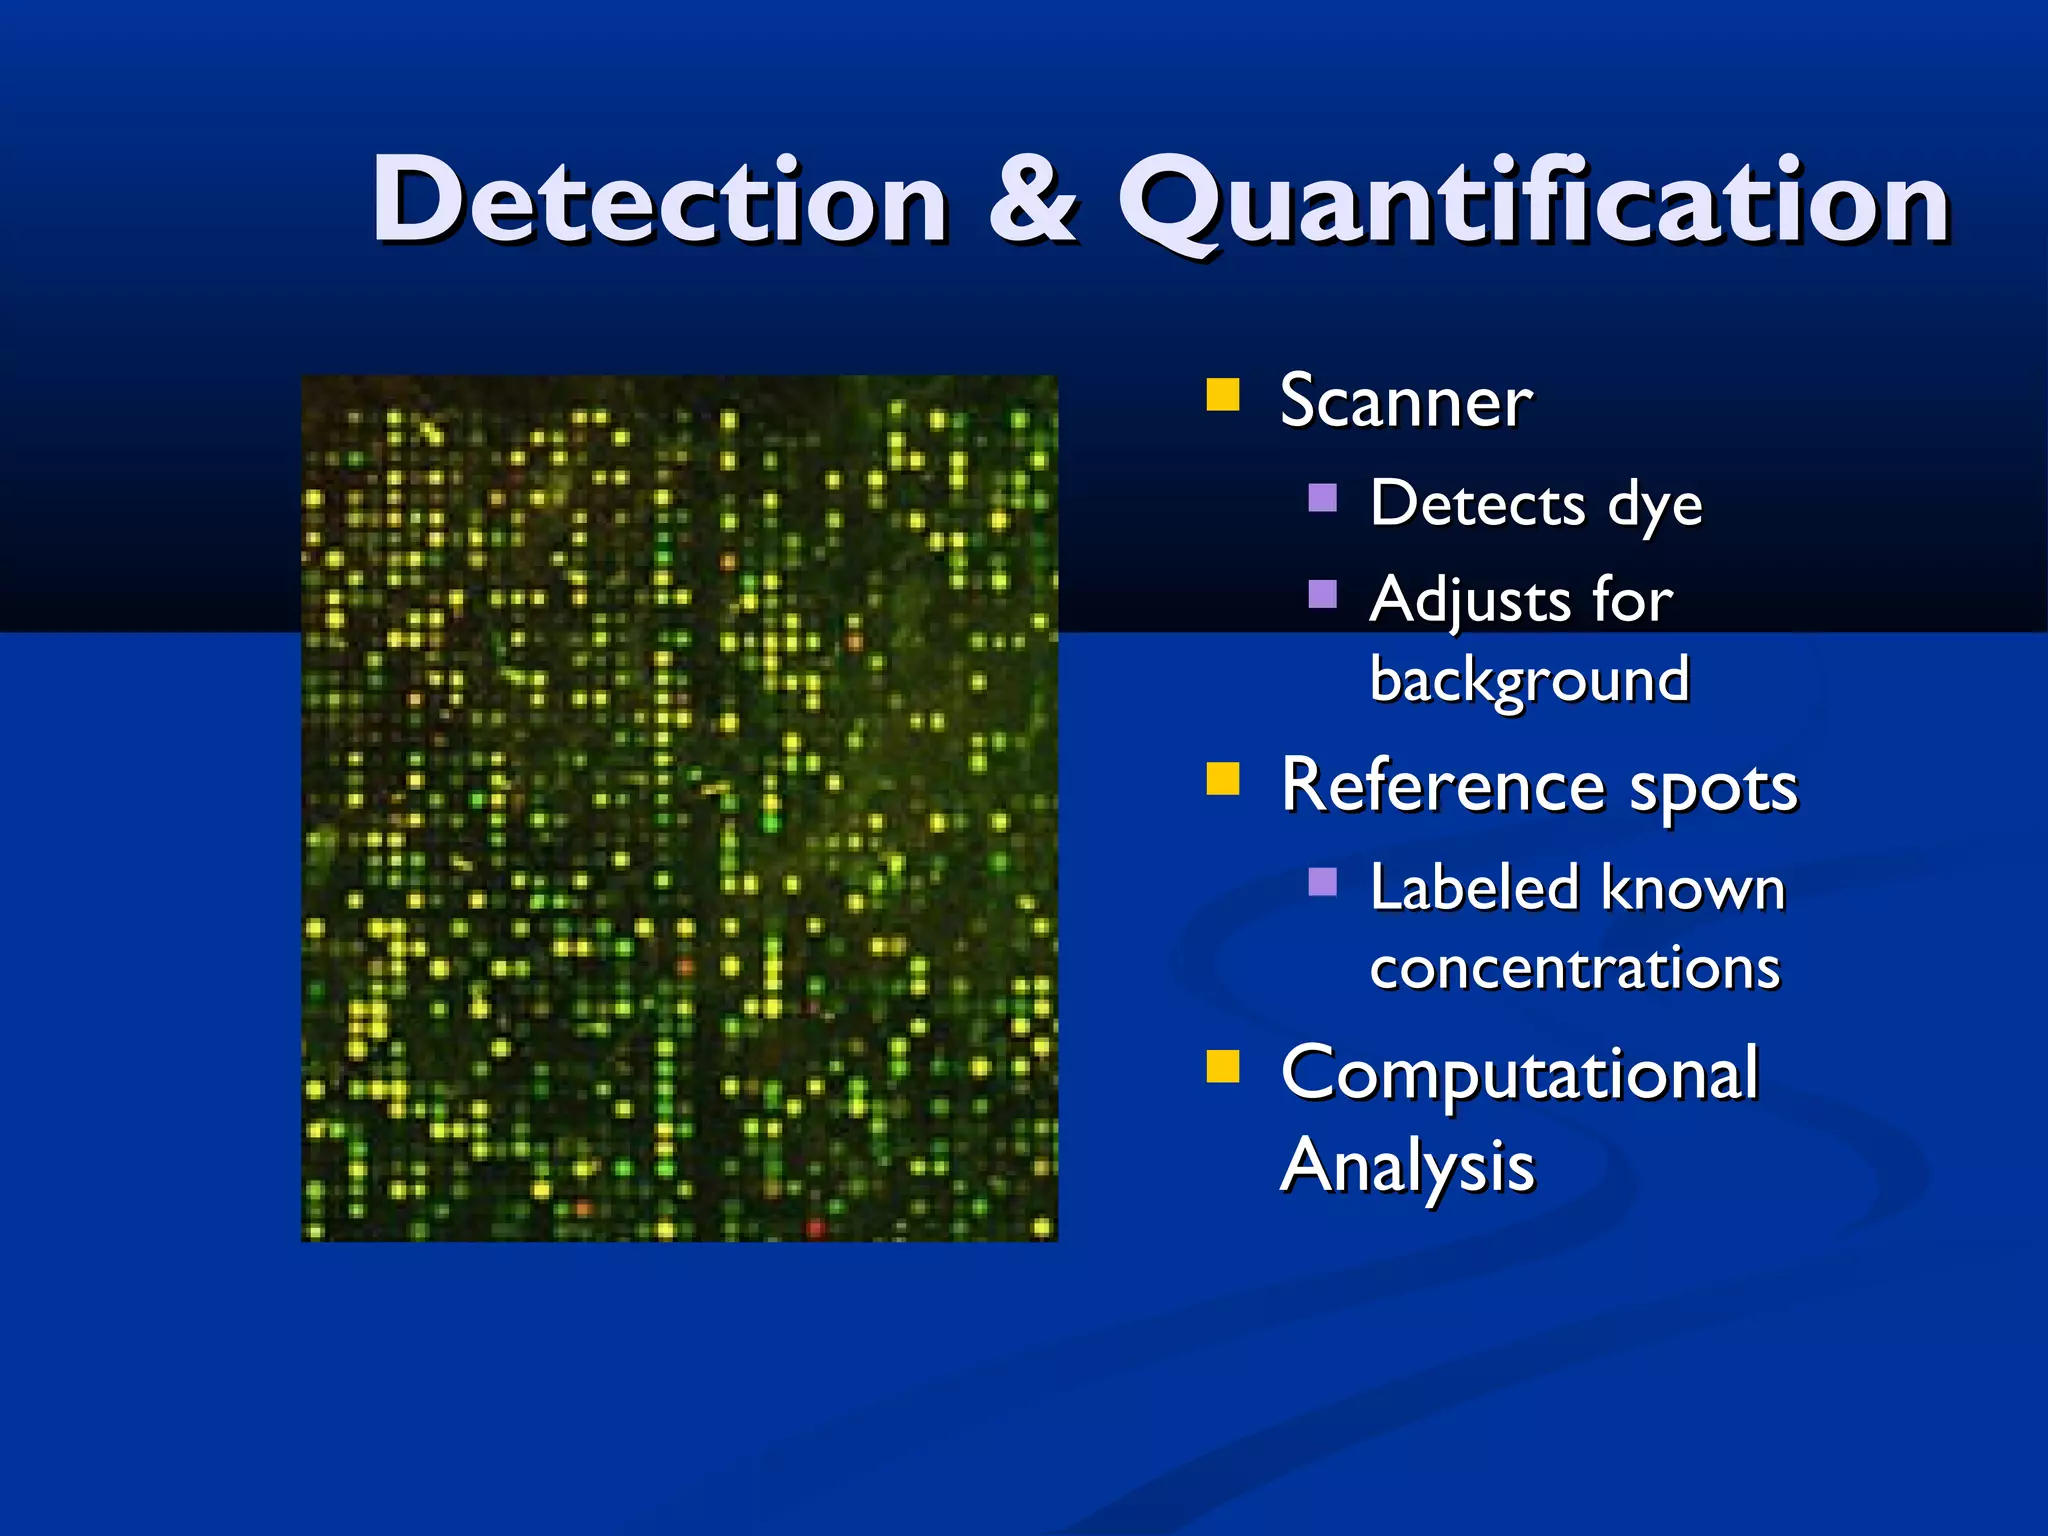
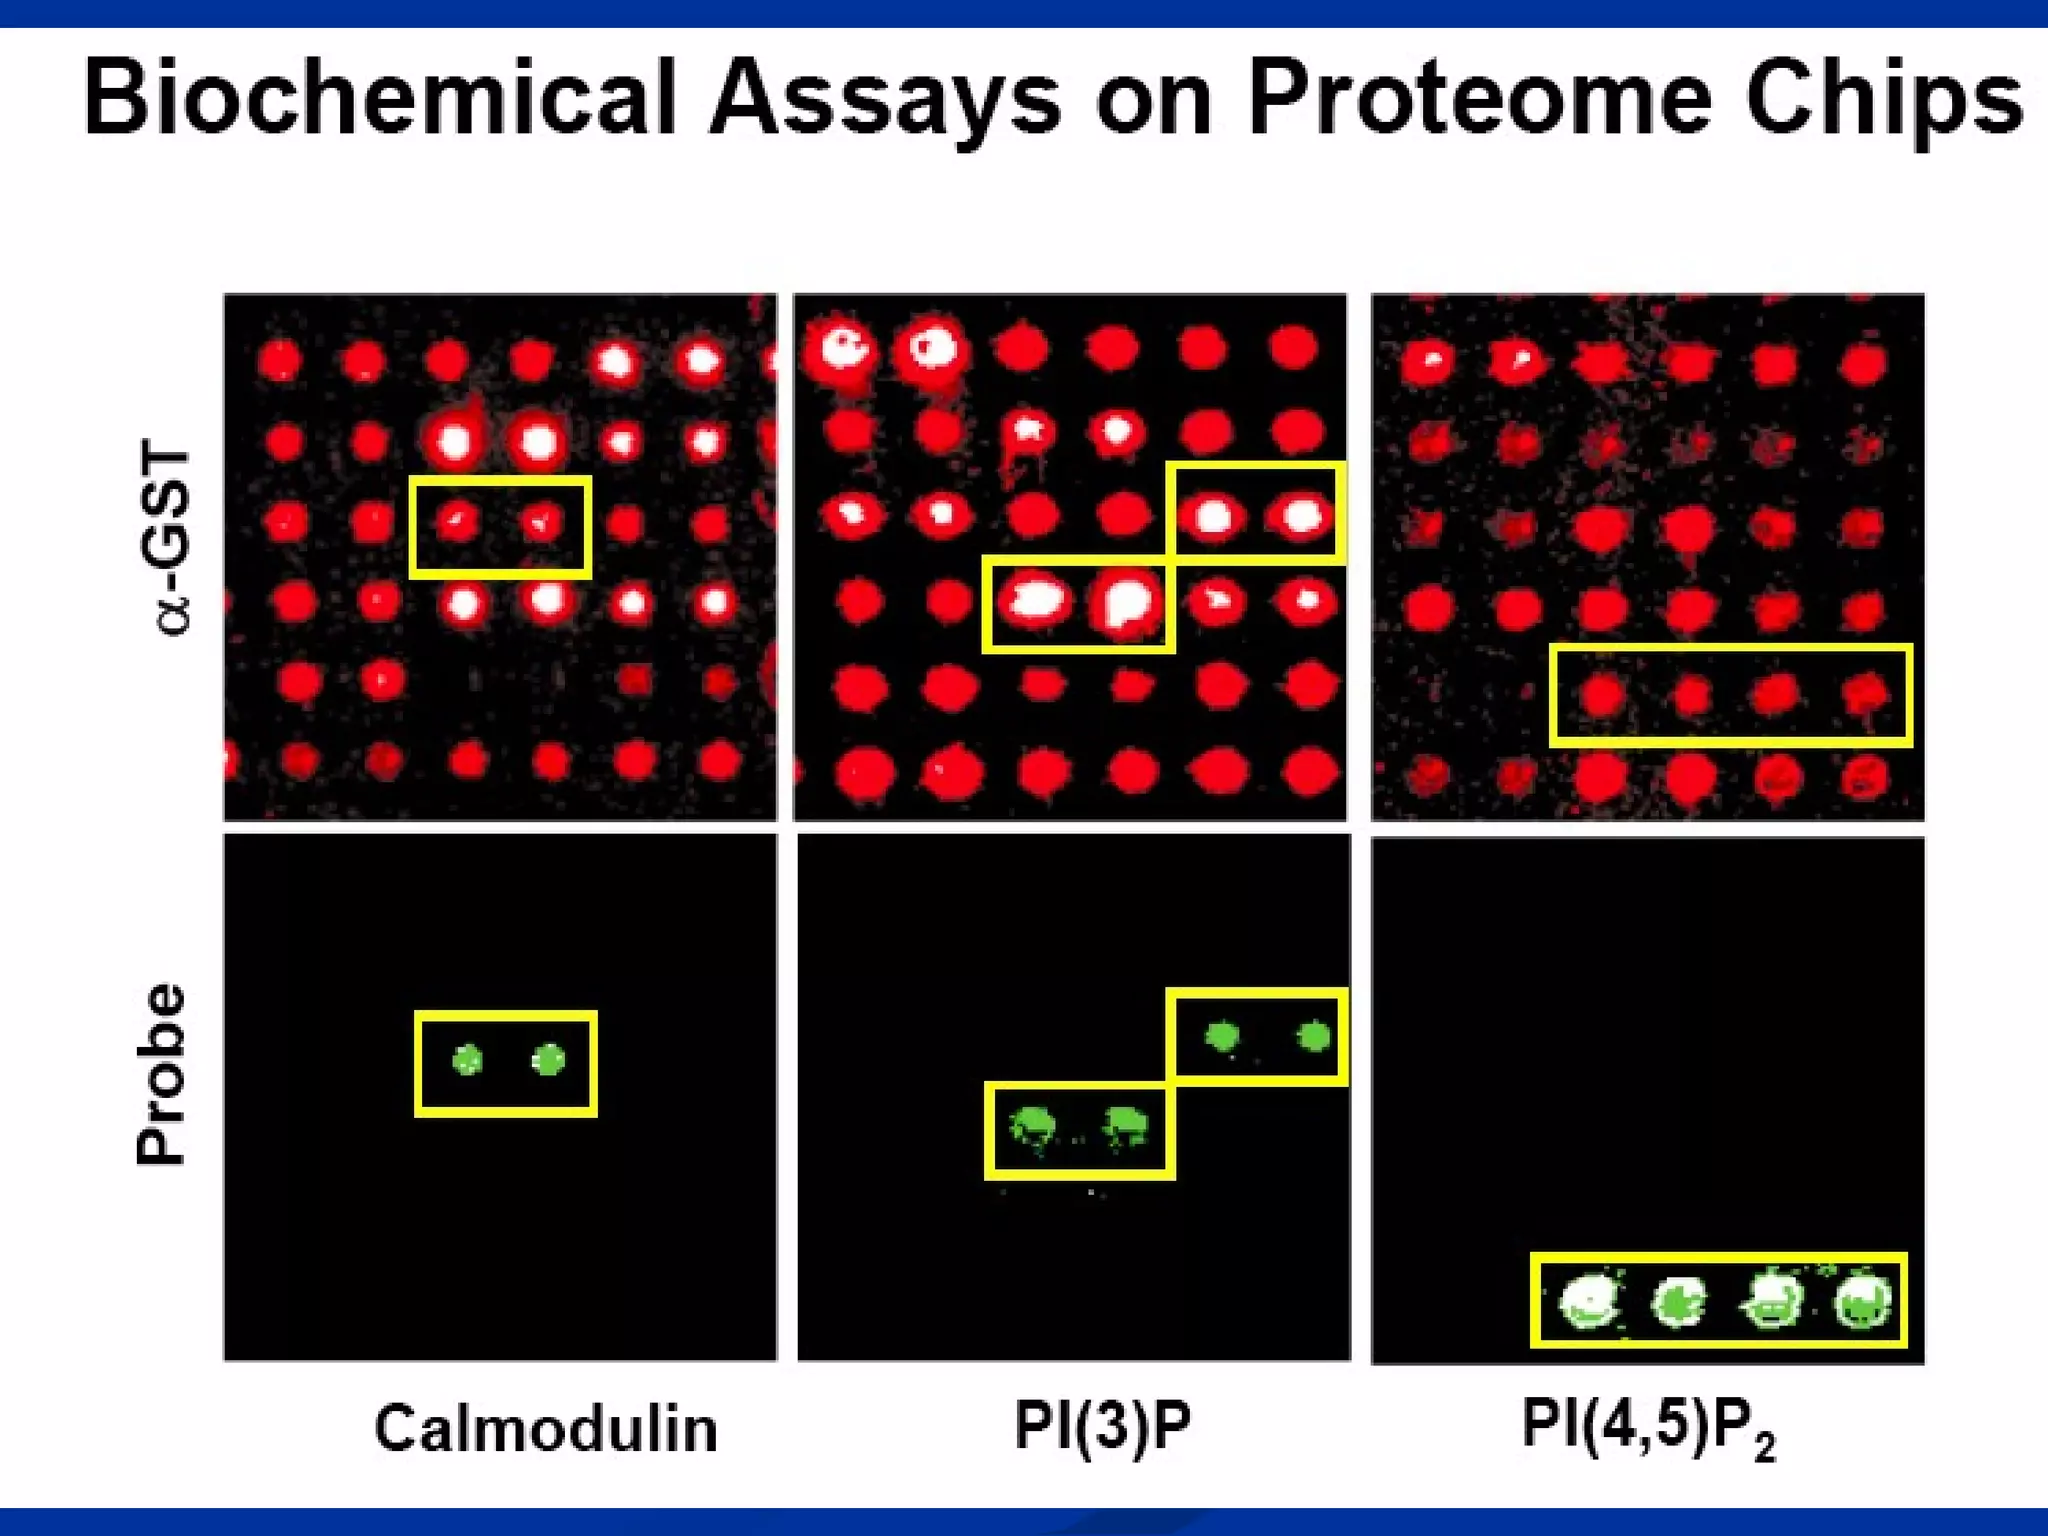
Bio-chips (Lab-on-a-chip)

1
System architectures
White lines correspond to metal electrodes that
connect to individual nanowire devices. The
position of the microfluidic channel used to
deliver sample is highlighted in blue and has a
total size of 6 mm × 500 μm, length × width.
The image field is 4.4 × 3.5 mm.

(B) Optical image of one row of
addressable device elements from the
region highlighted by the red-dashed
box in A. The red arrow highlights the
position of a device. The image field is
500 × 400 μm.

C) Scanning electron
microscopy image of one
silicon nanowire device.
The electrode contacts are
visible at the upper right
and lower left regions of the
image. (Scale bar: 500 nm.)
Bio-chips
•
•
•
•

Portable,
low cost in high volumes,
low power,
can be integrated with other components

Chii-Wann Lin et al, DEVELOPMENT OF MICROMACHINED ELECTROCHEMICAL SENSOR
AND PORTABLE METER SYSTEM, a Proceedings of the 20th Annual International Conference of the IEEE
Engineering in Medicine and Biology Society, Vol. 20, No 4,1998

4
System architectures
• Chips – flat platforms, sensors below or above the chip

T. Vo-Dinh et al. , Sensors and Actuators, B 74 (2001) 2-11

5
Schematic diagram of an integrated DNA biochip system

Vo-Dinh T, Alarie JP, Isola N, Landis D, Wintenberg AL, Ericson, MN (1999) Anal Chem 71 :
358–363
7
fluorescence detection of Cy5-labeled Streptavidin using a 4X4
photodiode array IC biochip. Excitation by a 12 mW He±Ne laser
(632.8 nm).
Single detectors vs. Vectors and arrays

Single

Vector

Array

9
MICROARRAYS
It is a 2D array on a solid substrate (usually a glass slide or silicon thinfilm cell) that assays large number of biological material using highthroughput screening methods. Types of microarrays include:
• DNA microarrays,
• oligonucleotide microarrays
• MMChips, for surveillance of microRNA populations
• Protein microarrays
• Tissue microarrays
• Cellular microarrays (also called transfection microarrays)
• Chemical compound microarrays
• Antibody microarrays
• Carbohydrate arrays (glycoarrays)
DNA Arrays (Gene chips)
Example of a DNA Array
(note green, yellow red colors;
also note that only part of the total
array is depicted)
Example of a DNA Array
(note green, yellow red colors;
also note that only part of the total
array is depicted)

http://www.biomed.miami.edu/arrays/images/agilent_array.jpg

41,000+ unique human genes
and transcripts represented, all
with public domain annotations
an arrayed series of thousands of microscopic spots of
DNA oligonucleotides, called probes, each containing
picomoles of a specific DNA sequence. This can be a short section
of a gene or other DNA element that are used as probes to hybridi
a cDNA or cRNA sample (called target)

the probes are attached to a solid surface by a covalent
bond to a chemical matrix (via epoxy-silane, amino-silane,
lysine, polyacrylamide or others). The solid surface can be
glass or a silicon chip
• Probe-target hybridization is usually
detected and quantified by detection of
fluorophore-, or chemiluminescence-labeled
targets to determine relative abundance of
nucleic acid sequences in the target. Since
an array can contain tens of thousands of
probes, a microarray experiment can
accomplish many genetic tests in parallel.
Colloquially known as an Affy chip when an Affymetrix chip is used.
Other microarray platforms, such as Illumina, use microscopic beads,
instead of the large solid support.
Affymetrix
Agilent Technologies
Applied
CombiMatrix
Eppendorf
GE Healthcare
Genetix
Greiner Bio-One
Illumina, Inc.
Kreatech
Micronit Microfluidics
Nanogen, Inc.
NimbleGen
Ocimum Biosolutions
Roche Diagnostics
SCHOTT Nexterion
STMicroelectronics
• DNA microarrays can be used to measure
changes in gene expression levels, to detect
single nucleotide polymorphisms (SNPs) ,
to genotype or resequence mutant genomes.
Step 1: Create a DNA array (gene
“chip”) by placing single-stranded
DNA/ Oligonucleotides for each
gene to be assayed into a separate
“well” on the chip.
DNA Array: Single-stranded copy DNA Oligonucleotides for
each gene in a different well.
cDNA
gene 1

cDNA
gene 2

cDNA
gene 3

cDNA
gene 4

cDNA
gene 5
Step 2: Extract mRNA from biological tissues
subjected to an experimental treatment and
from the same tissue subjected to a control
treatment. Or from normal and from
pathological tissue
• Step 3- Make single-stranded DNA from the
mRNA using “color coded” nucleotides.
Extract mRNA from Control Cells

Make single-stranded cDNA
using green nucleotides (e.g.
Quantum dots)

cDNA = complementary DNA (DNA synthesized from RNA)

Extract mRNA from
Experimental/pathological Cells

Make single-stranded cDNA
using red nucleotides (e.g.
Quantum dots)
Step 4: After making many DNA copies of
the RNA, extract an equal amount of cDNA
from the controls & experimentals and
place it into a container.
Control cDNA

Experimental cDNA
Step 5: Extract a small
amount in a pipette.
Step 6: Insert into first
well.
Step 7: Extract
more cDNA and …

… insert into
second well, etc.
Step 8: Continue until all wells are
filled.
Step 9: Allow to hybridize, then wash away
all single-stranded DNA.
Result:
(1)
(2)
(3)
(4)

Some wells have no color-coded cDNA (no mRNA in either type of cell)
Some wells have only red (i.e., expressed only in experimental cells)
Some wells have only green (i.e., expressed only in control cells)
Some wells have both red and green in various mixtures (expressed
in both experimental and control cells)
Step 10: Scan with a laser set to detect the
color & process results on computer.
Results:
The colors denote the degree of expression in the
experimental versus the control cells.

Gene not expressed in control or
in experimental cells

Only in
control
cells

Mostly in
control
cells

Mostly in
Only in
Same in
experimental experimental
both cells
cells
cells
PROTEIN MICROARRAY
Part1

Protein Microarray
1. High throughput
analysis of hundreds of
thousands of proteins.
2. Proteins are
immobilized on glass
chip.
3. Various probes
(protein, lipids, DNA,
peptides, etc) are used.
Protein Array VS DNA Microarray
Target:
Binding:
Stability:
Surface:
Printing:
Amplification:

Proteins
(Big, 3D)
3D affinity
Low
Glass
Arrayer
Cloning

DNA
(Small, 2D)
2D seq
High
Glass
Arrayer
PCR
Protein Array Fabrication


Protein substrates







Polyacrylamide or
agarose gels
Glass
Nanowells

Proteins deposited
on chip surface by
robots

Benfey & Protopapas, 2005
Protein Attachment








Diffusion
 Protein suspended in
random orientation, but
presumably active
Adsorption/Absorption
 Some proteins inactive
Covalent attachment
 Some proteins inactive
Affinity
 Orientation of protein
precisely controlled

Diffusion
Adsorption/
Absorption

Covalent

Affinity

Benfey & Protopapas, 2005
Protein Interactions




Different capture molecules
must be used to study
different interactions
Examples
 Antibodies (or antigens) for
detection
 Proteins for protein-protein
interaction
 Enzyme-substrate for
biochemical function

Antigen–
antibody
Protein–
protein
Aptamers
Enzyme–
substrate
Receptor–
ligand
Benfey & Protopapas, 2005
Expression Array


Probes (antibody) on surface recognize
target proteins.



Identification of expressed proteins from
samples.



Typical quantification method for large # of
expressed proteins.
Interaction Array
 Probes (proteins, peptides, lipids) on
surface interact with target proteins.
 Identification of protein interactions.
 High throughput discovery of interactions .
Functional Array
 Probes (proteins) on surface react with
target molecules .
 Reaction products are detected.
 Main goal of proteomics.
Sample Preparation


Labeled


Fluorescent Dye






Cy3/Cy5 via Lysines

Photochemical
Radioisotope
May interfere


Unlabeled


Antibody Sandwich




Surface Plasmon
resonance








2nd antibody with label
incubated on top of sample

Measure electromagnetic
waves
Angle changes in the order
of 0.1° with 1 nm film
adsorption
Needs special equipment

Don’t affect protein
structure
Detection & Quantification


Scanner





Reference spots




Detects dye
Adjusts for
background
Labeled known
concentrations

Computational
Analysis
Technical Challenges in Protein Chips
1. Poor control of immobilized protein activity.
2. Low yield immobilization.
3. High non-specific adsorption.
4. Fast denaturation of Protein.
5. Limited number of labels – low mutiplexing

12 arrays

  • 1.
  • 2.
  • 3.
    White lines correspondto metal electrodes that connect to individual nanowire devices. The position of the microfluidic channel used to deliver sample is highlighted in blue and has a total size of 6 mm × 500 μm, length × width. The image field is 4.4 × 3.5 mm. (B) Optical image of one row of addressable device elements from the region highlighted by the red-dashed box in A. The red arrow highlights the position of a device. The image field is 500 × 400 μm. C) Scanning electron microscopy image of one silicon nanowire device. The electrode contacts are visible at the upper right and lower left regions of the image. (Scale bar: 500 nm.)
  • 4.
    Bio-chips • • • • Portable, low cost inhigh volumes, low power, can be integrated with other components Chii-Wann Lin et al, DEVELOPMENT OF MICROMACHINED ELECTROCHEMICAL SENSOR AND PORTABLE METER SYSTEM, a Proceedings of the 20th Annual International Conference of the IEEE Engineering in Medicine and Biology Society, Vol. 20, No 4,1998 4
  • 5.
    System architectures • Chips– flat platforms, sensors below or above the chip T. Vo-Dinh et al. , Sensors and Actuators, B 74 (2001) 2-11 5
  • 7.
    Schematic diagram ofan integrated DNA biochip system Vo-Dinh T, Alarie JP, Isola N, Landis D, Wintenberg AL, Ericson, MN (1999) Anal Chem 71 : 358–363 7
  • 8.
    fluorescence detection ofCy5-labeled Streptavidin using a 4X4 photodiode array IC biochip. Excitation by a 12 mW He±Ne laser (632.8 nm).
  • 9.
    Single detectors vs.Vectors and arrays Single Vector Array 9
  • 10.
    MICROARRAYS It is a2D array on a solid substrate (usually a glass slide or silicon thinfilm cell) that assays large number of biological material using highthroughput screening methods. Types of microarrays include: • DNA microarrays, • oligonucleotide microarrays • MMChips, for surveillance of microRNA populations • Protein microarrays • Tissue microarrays • Cellular microarrays (also called transfection microarrays) • Chemical compound microarrays • Antibody microarrays • Carbohydrate arrays (glycoarrays)
  • 11.
  • 12.
    Example of aDNA Array (note green, yellow red colors; also note that only part of the total array is depicted)
  • 13.
    Example of aDNA Array (note green, yellow red colors; also note that only part of the total array is depicted) http://www.biomed.miami.edu/arrays/images/agilent_array.jpg 41,000+ unique human genes and transcripts represented, all with public domain annotations
  • 14.
    an arrayed seriesof thousands of microscopic spots of DNA oligonucleotides, called probes, each containing picomoles of a specific DNA sequence. This can be a short section of a gene or other DNA element that are used as probes to hybridi a cDNA or cRNA sample (called target) the probes are attached to a solid surface by a covalent bond to a chemical matrix (via epoxy-silane, amino-silane, lysine, polyacrylamide or others). The solid surface can be glass or a silicon chip
  • 15.
    • Probe-target hybridizationis usually detected and quantified by detection of fluorophore-, or chemiluminescence-labeled targets to determine relative abundance of nucleic acid sequences in the target. Since an array can contain tens of thousands of probes, a microarray experiment can accomplish many genetic tests in parallel.
  • 16.
    Colloquially known asan Affy chip when an Affymetrix chip is used. Other microarray platforms, such as Illumina, use microscopic beads, instead of the large solid support. Affymetrix Agilent Technologies Applied CombiMatrix Eppendorf GE Healthcare Genetix Greiner Bio-One Illumina, Inc. Kreatech Micronit Microfluidics Nanogen, Inc. NimbleGen Ocimum Biosolutions Roche Diagnostics SCHOTT Nexterion STMicroelectronics
  • 17.
    • DNA microarrayscan be used to measure changes in gene expression levels, to detect single nucleotide polymorphisms (SNPs) , to genotype or resequence mutant genomes.
  • 18.
    Step 1: Createa DNA array (gene “chip”) by placing single-stranded DNA/ Oligonucleotides for each gene to be assayed into a separate “well” on the chip.
  • 19.
    DNA Array: Single-strandedcopy DNA Oligonucleotides for each gene in a different well. cDNA gene 1 cDNA gene 2 cDNA gene 3 cDNA gene 4 cDNA gene 5
  • 20.
    Step 2: ExtractmRNA from biological tissues subjected to an experimental treatment and from the same tissue subjected to a control treatment. Or from normal and from pathological tissue
  • 21.
    • Step 3-Make single-stranded DNA from the mRNA using “color coded” nucleotides.
  • 22.
    Extract mRNA fromControl Cells Make single-stranded cDNA using green nucleotides (e.g. Quantum dots) cDNA = complementary DNA (DNA synthesized from RNA) Extract mRNA from Experimental/pathological Cells Make single-stranded cDNA using red nucleotides (e.g. Quantum dots)
  • 23.
    Step 4: Aftermaking many DNA copies of the RNA, extract an equal amount of cDNA from the controls & experimentals and place it into a container.
  • 24.
  • 25.
    Step 5: Extracta small amount in a pipette.
  • 26.
    Step 6: Insertinto first well.
  • 27.
    Step 7: Extract morecDNA and … … insert into second well, etc.
  • 28.
    Step 8: Continueuntil all wells are filled.
  • 29.
    Step 9: Allowto hybridize, then wash away all single-stranded DNA.
  • 30.
    Result: (1) (2) (3) (4) Some wells haveno color-coded cDNA (no mRNA in either type of cell) Some wells have only red (i.e., expressed only in experimental cells) Some wells have only green (i.e., expressed only in control cells) Some wells have both red and green in various mixtures (expressed in both experimental and control cells)
  • 31.
    Step 10: Scanwith a laser set to detect the color & process results on computer.
  • 32.
    Results: The colors denotethe degree of expression in the experimental versus the control cells. Gene not expressed in control or in experimental cells Only in control cells Mostly in control cells Mostly in Only in Same in experimental experimental both cells cells cells
  • 34.
  • 35.
    Part1 Protein Microarray 1. Highthroughput analysis of hundreds of thousands of proteins. 2. Proteins are immobilized on glass chip. 3. Various probes (protein, lipids, DNA, peptides, etc) are used.
  • 36.
    Protein Array VSDNA Microarray Target: Binding: Stability: Surface: Printing: Amplification: Proteins (Big, 3D) 3D affinity Low Glass Arrayer Cloning DNA (Small, 2D) 2D seq High Glass Arrayer PCR
  • 37.
    Protein Array Fabrication  Proteinsubstrates     Polyacrylamide or agarose gels Glass Nanowells Proteins deposited on chip surface by robots Benfey & Protopapas, 2005
  • 38.
    Protein Attachment     Diffusion  Proteinsuspended in random orientation, but presumably active Adsorption/Absorption  Some proteins inactive Covalent attachment  Some proteins inactive Affinity  Orientation of protein precisely controlled Diffusion Adsorption/ Absorption Covalent Affinity Benfey & Protopapas, 2005
  • 39.
    Protein Interactions   Different capturemolecules must be used to study different interactions Examples  Antibodies (or antigens) for detection  Proteins for protein-protein interaction  Enzyme-substrate for biochemical function Antigen– antibody Protein– protein Aptamers Enzyme– substrate Receptor– ligand Benfey & Protopapas, 2005
  • 40.
    Expression Array  Probes (antibody)on surface recognize target proteins.  Identification of expressed proteins from samples.  Typical quantification method for large # of expressed proteins.
  • 45.
    Interaction Array  Probes(proteins, peptides, lipids) on surface interact with target proteins.  Identification of protein interactions.  High throughput discovery of interactions .
  • 46.
    Functional Array  Probes(proteins) on surface react with target molecules .  Reaction products are detected.  Main goal of proteomics.
  • 50.
    Sample Preparation  Labeled  Fluorescent Dye     Cy3/Cy5via Lysines Photochemical Radioisotope May interfere
  • 51.
     Unlabeled  Antibody Sandwich   Surface Plasmon resonance     2ndantibody with label incubated on top of sample Measure electromagnetic waves Angle changes in the order of 0.1° with 1 nm film adsorption Needs special equipment Don’t affect protein structure
  • 52.
    Detection & Quantification  Scanner    Referencespots   Detects dye Adjusts for background Labeled known concentrations Computational Analysis
  • 57.
    Technical Challenges inProtein Chips 1. Poor control of immobilized protein activity. 2. Low yield immobilization. 3. High non-specific adsorption. 4. Fast denaturation of Protein. 5. Limited number of labels – low mutiplexing