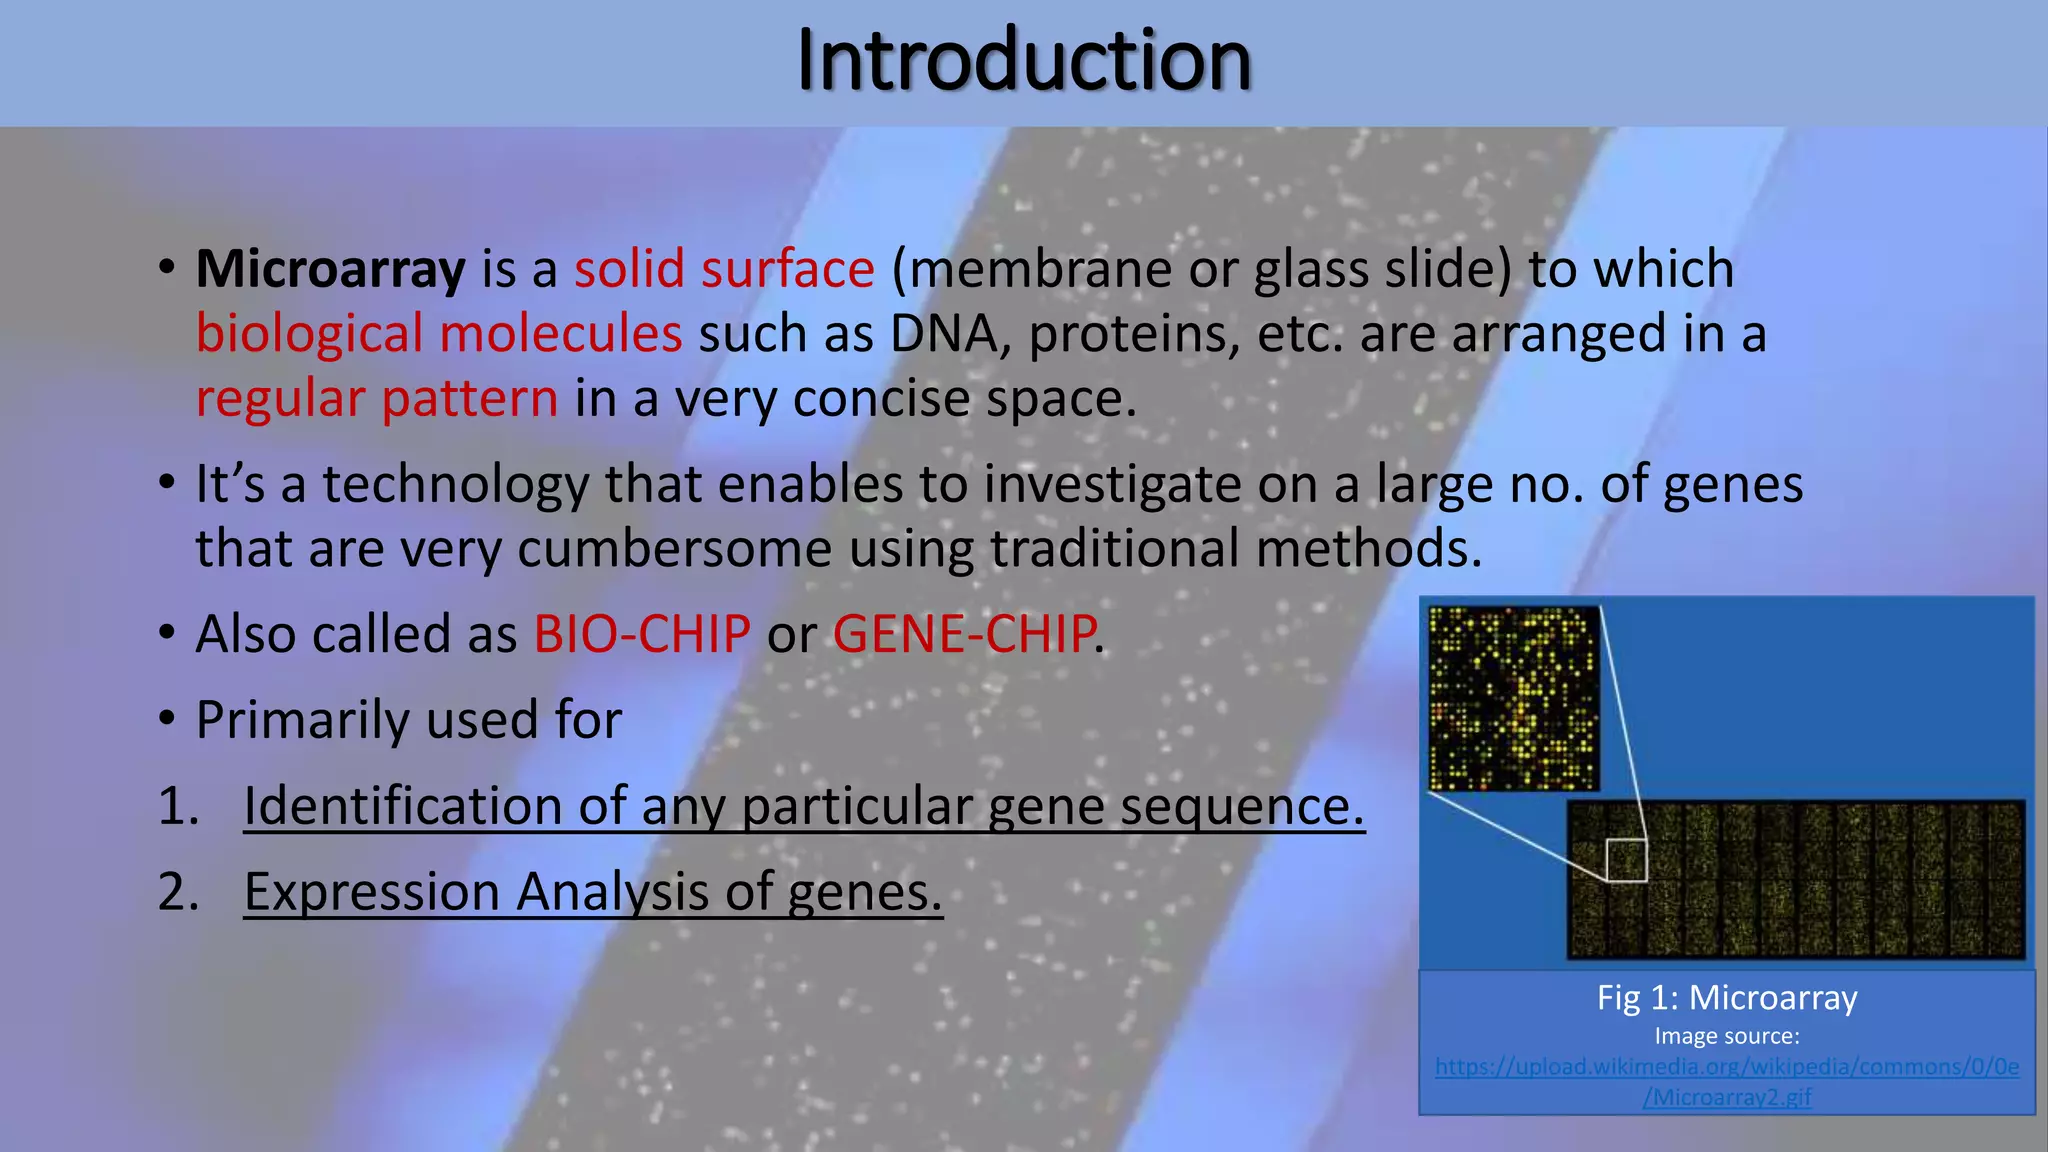
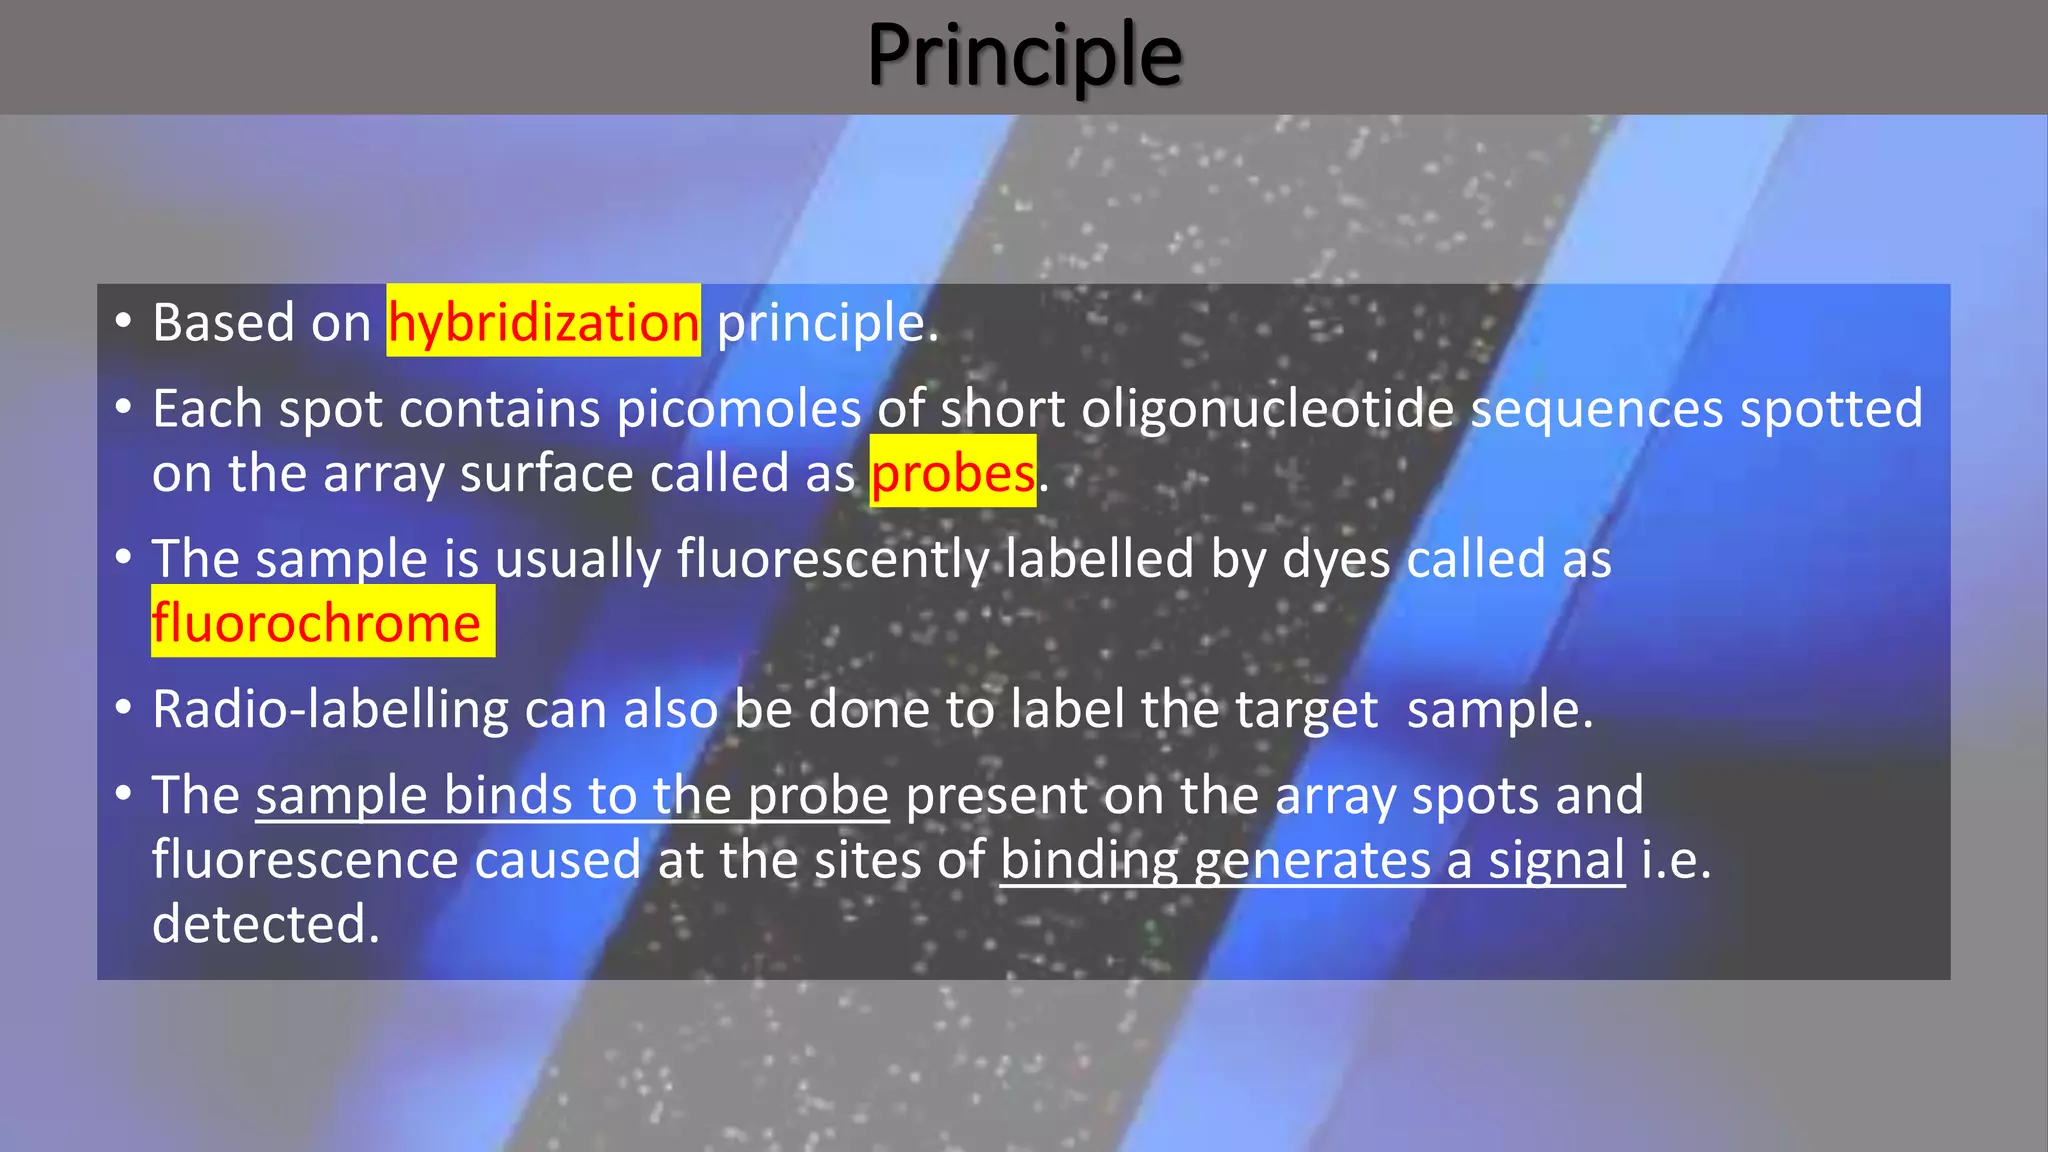
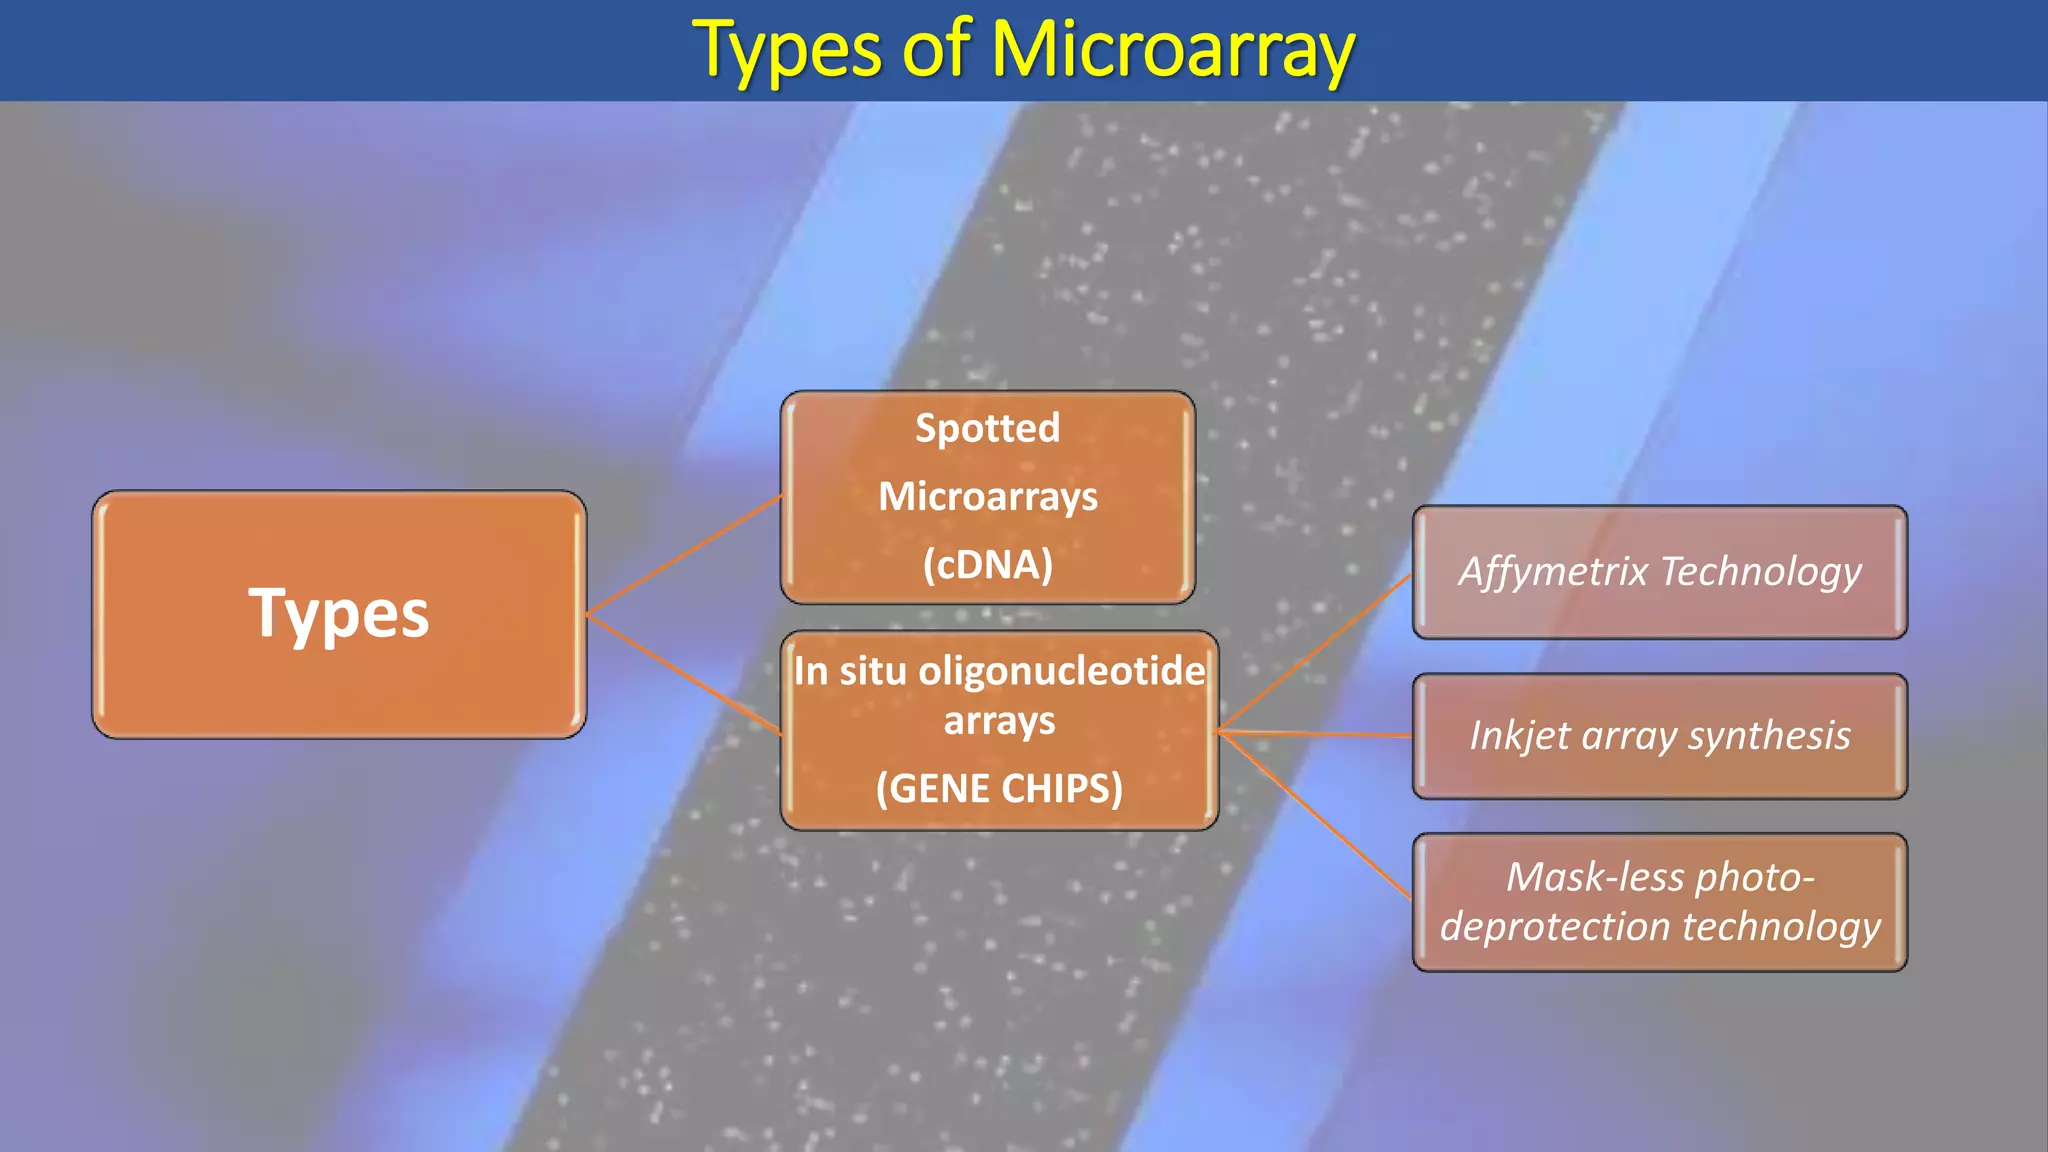
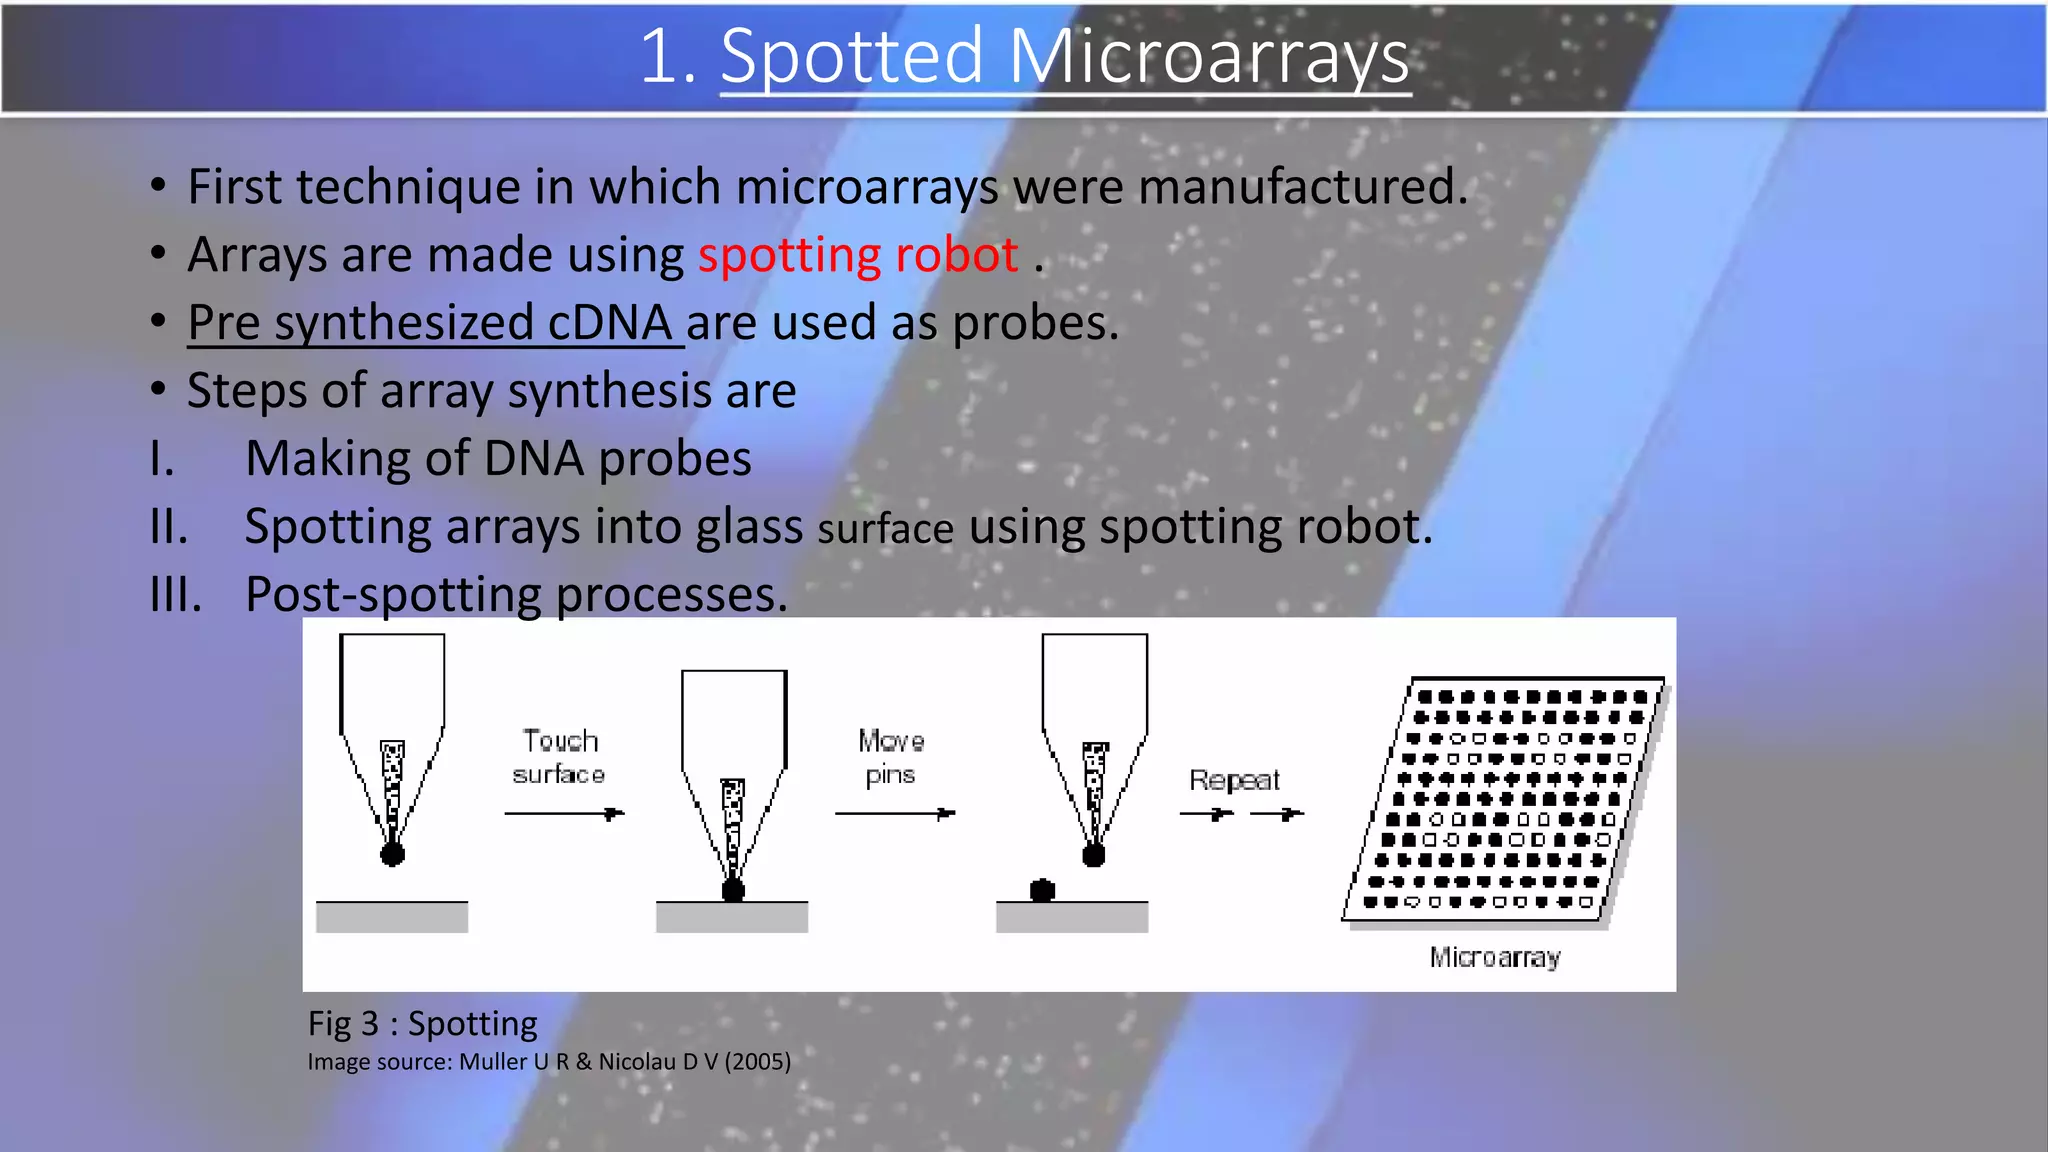
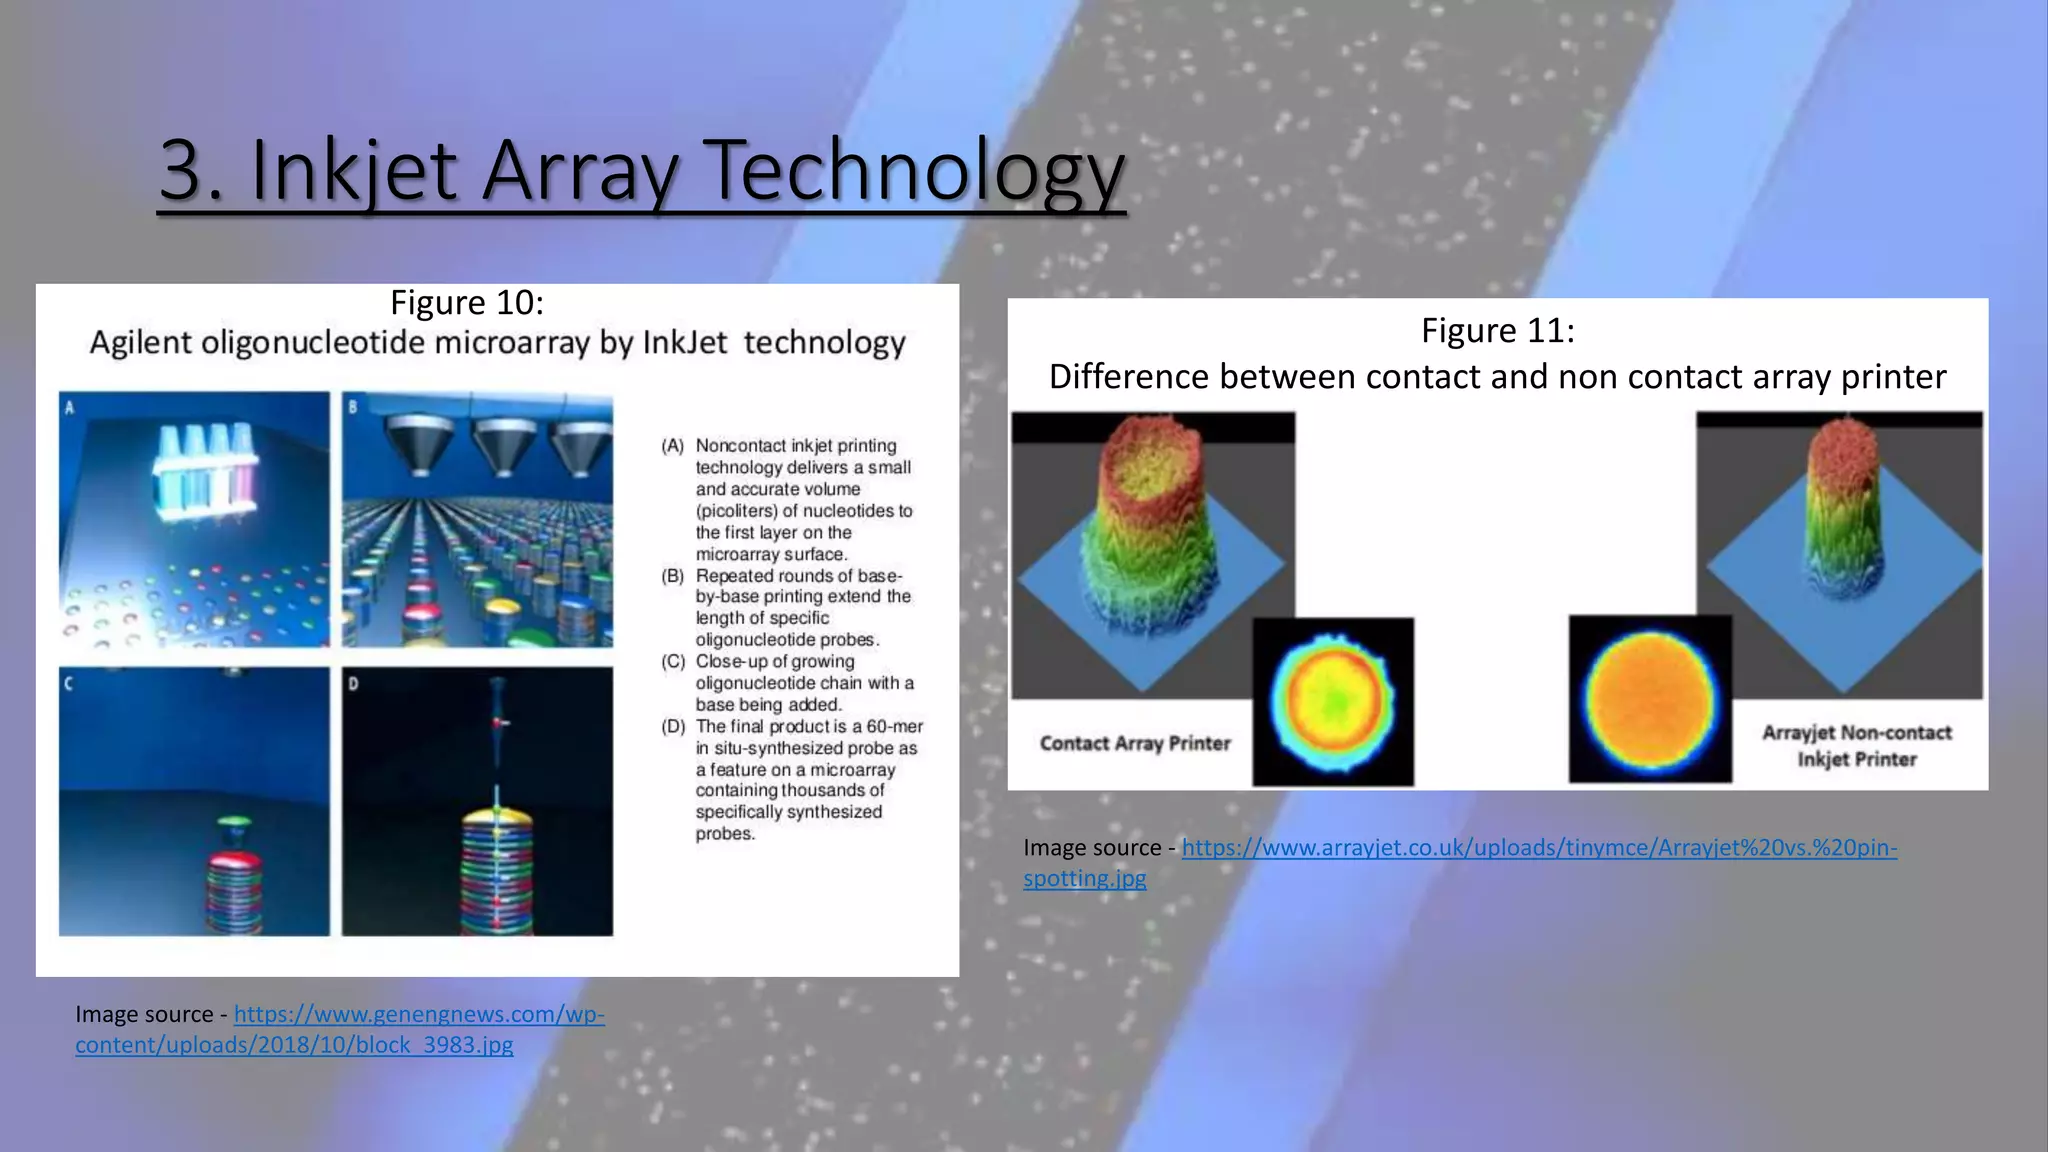
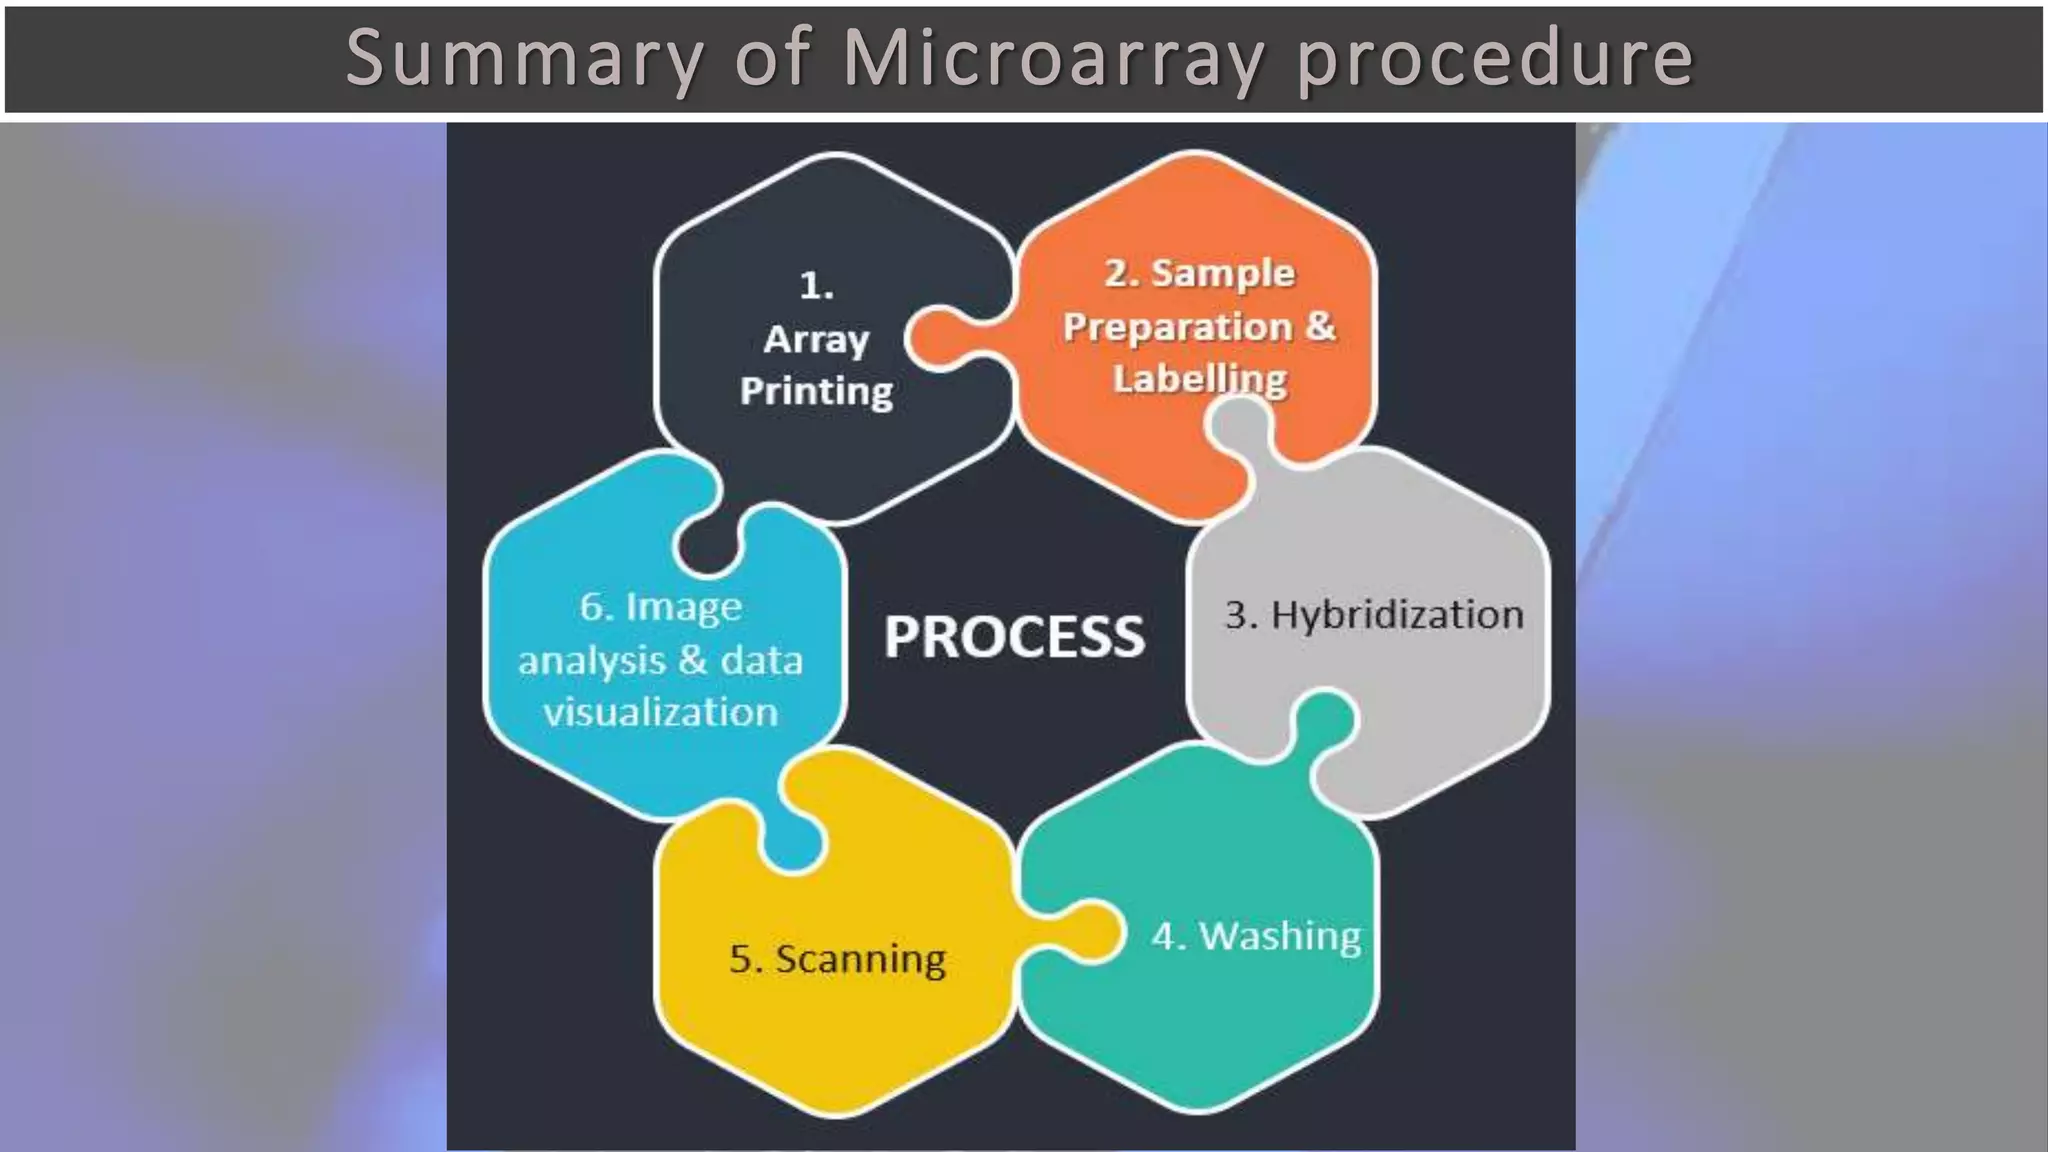
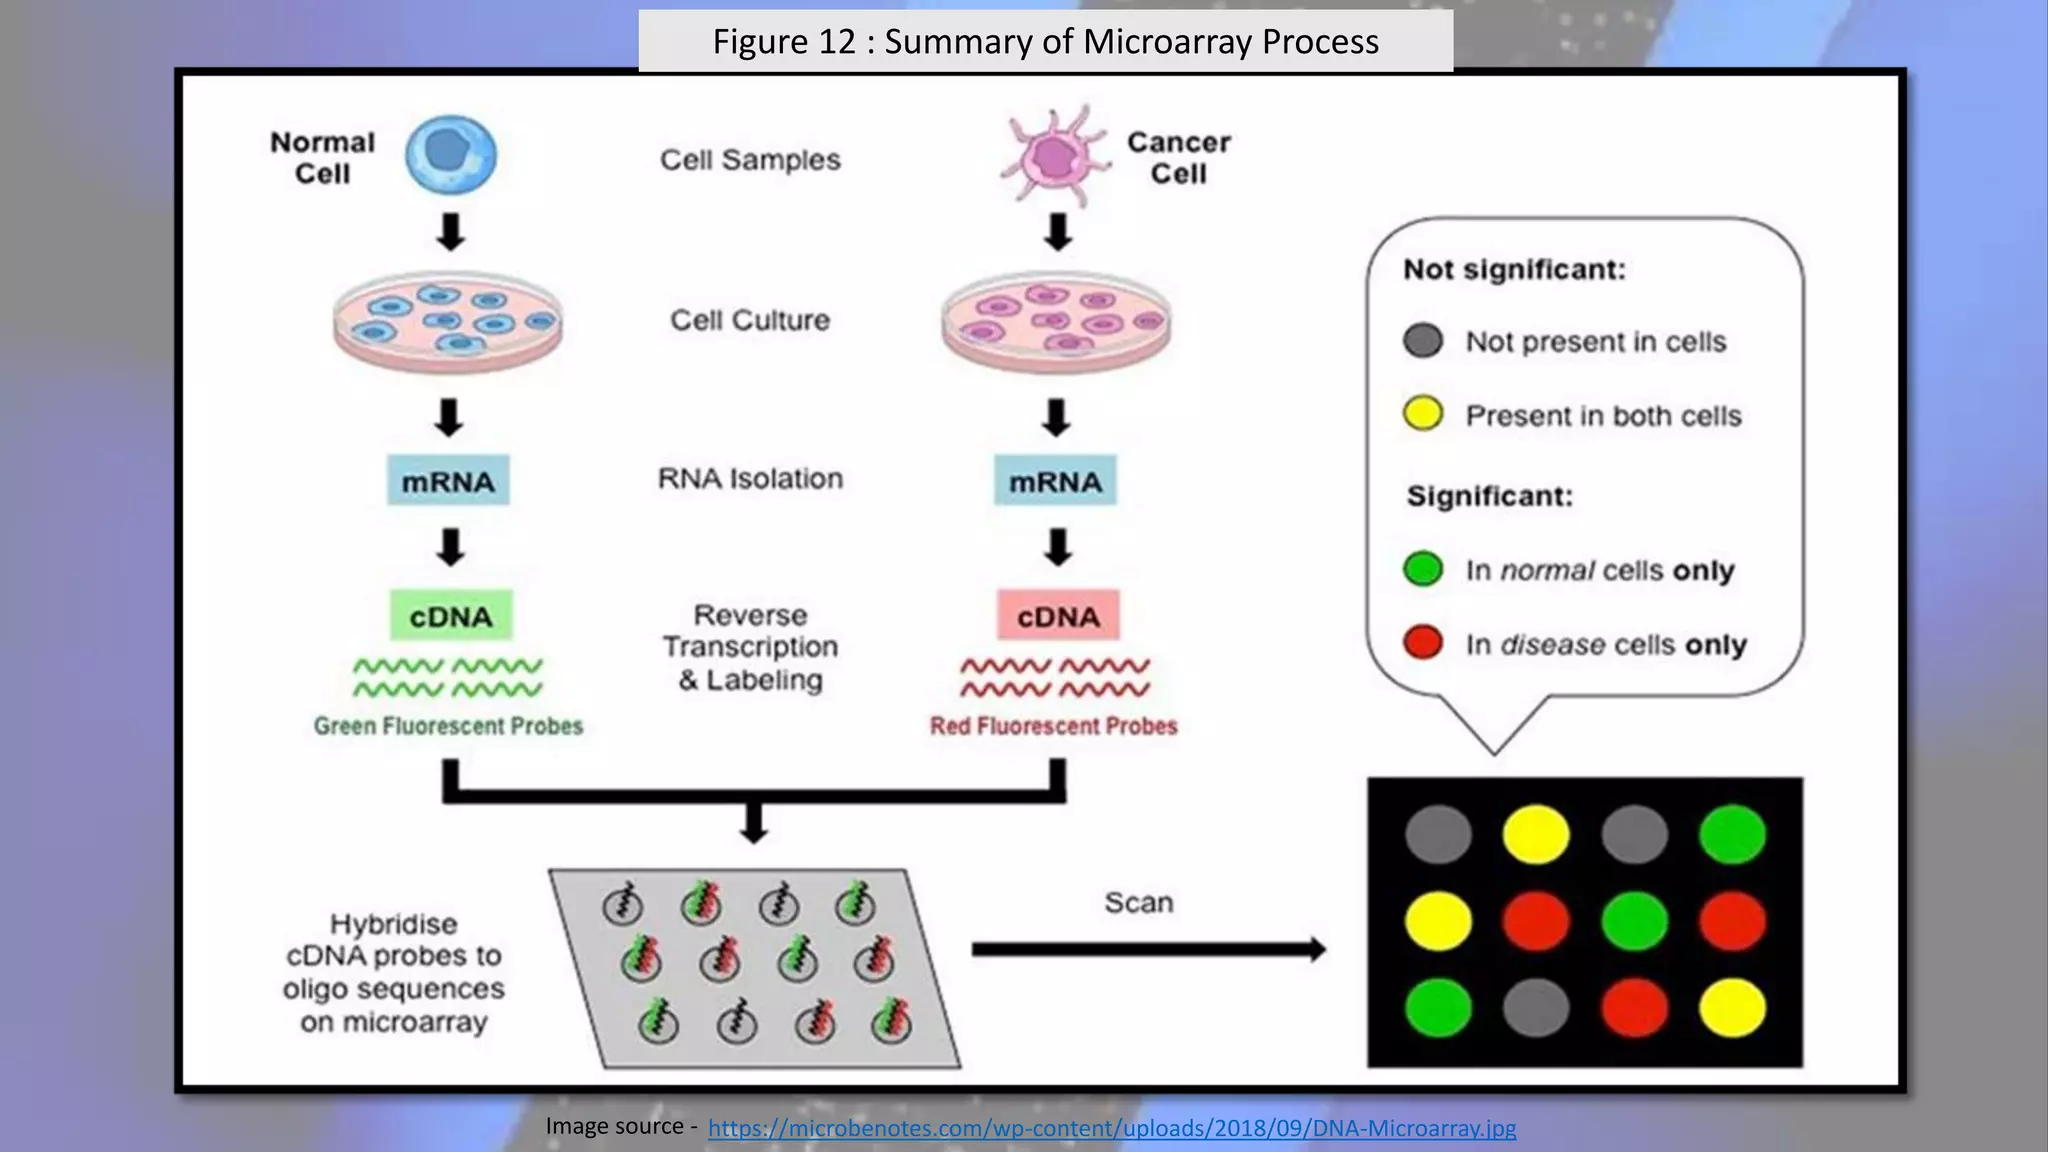
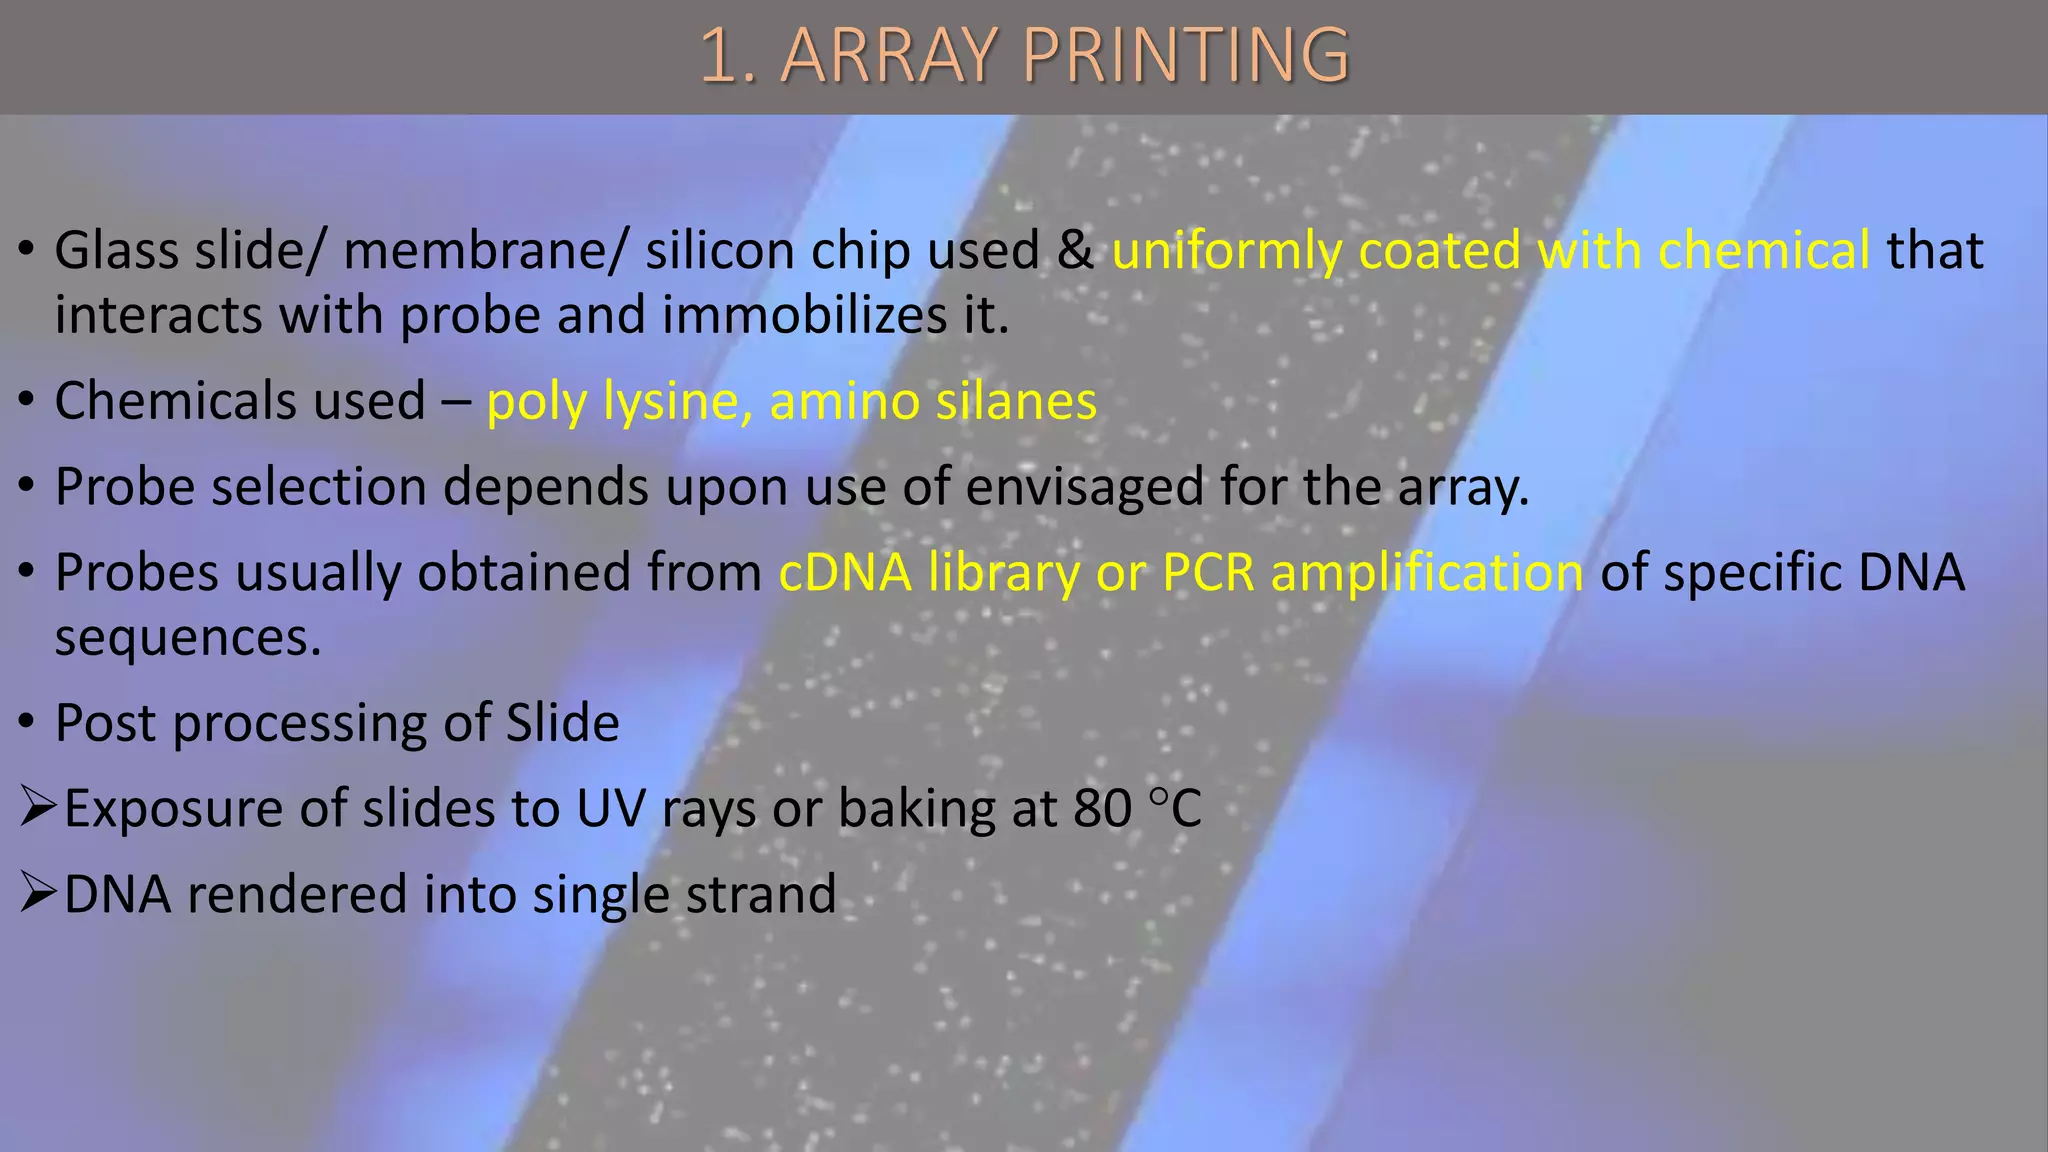
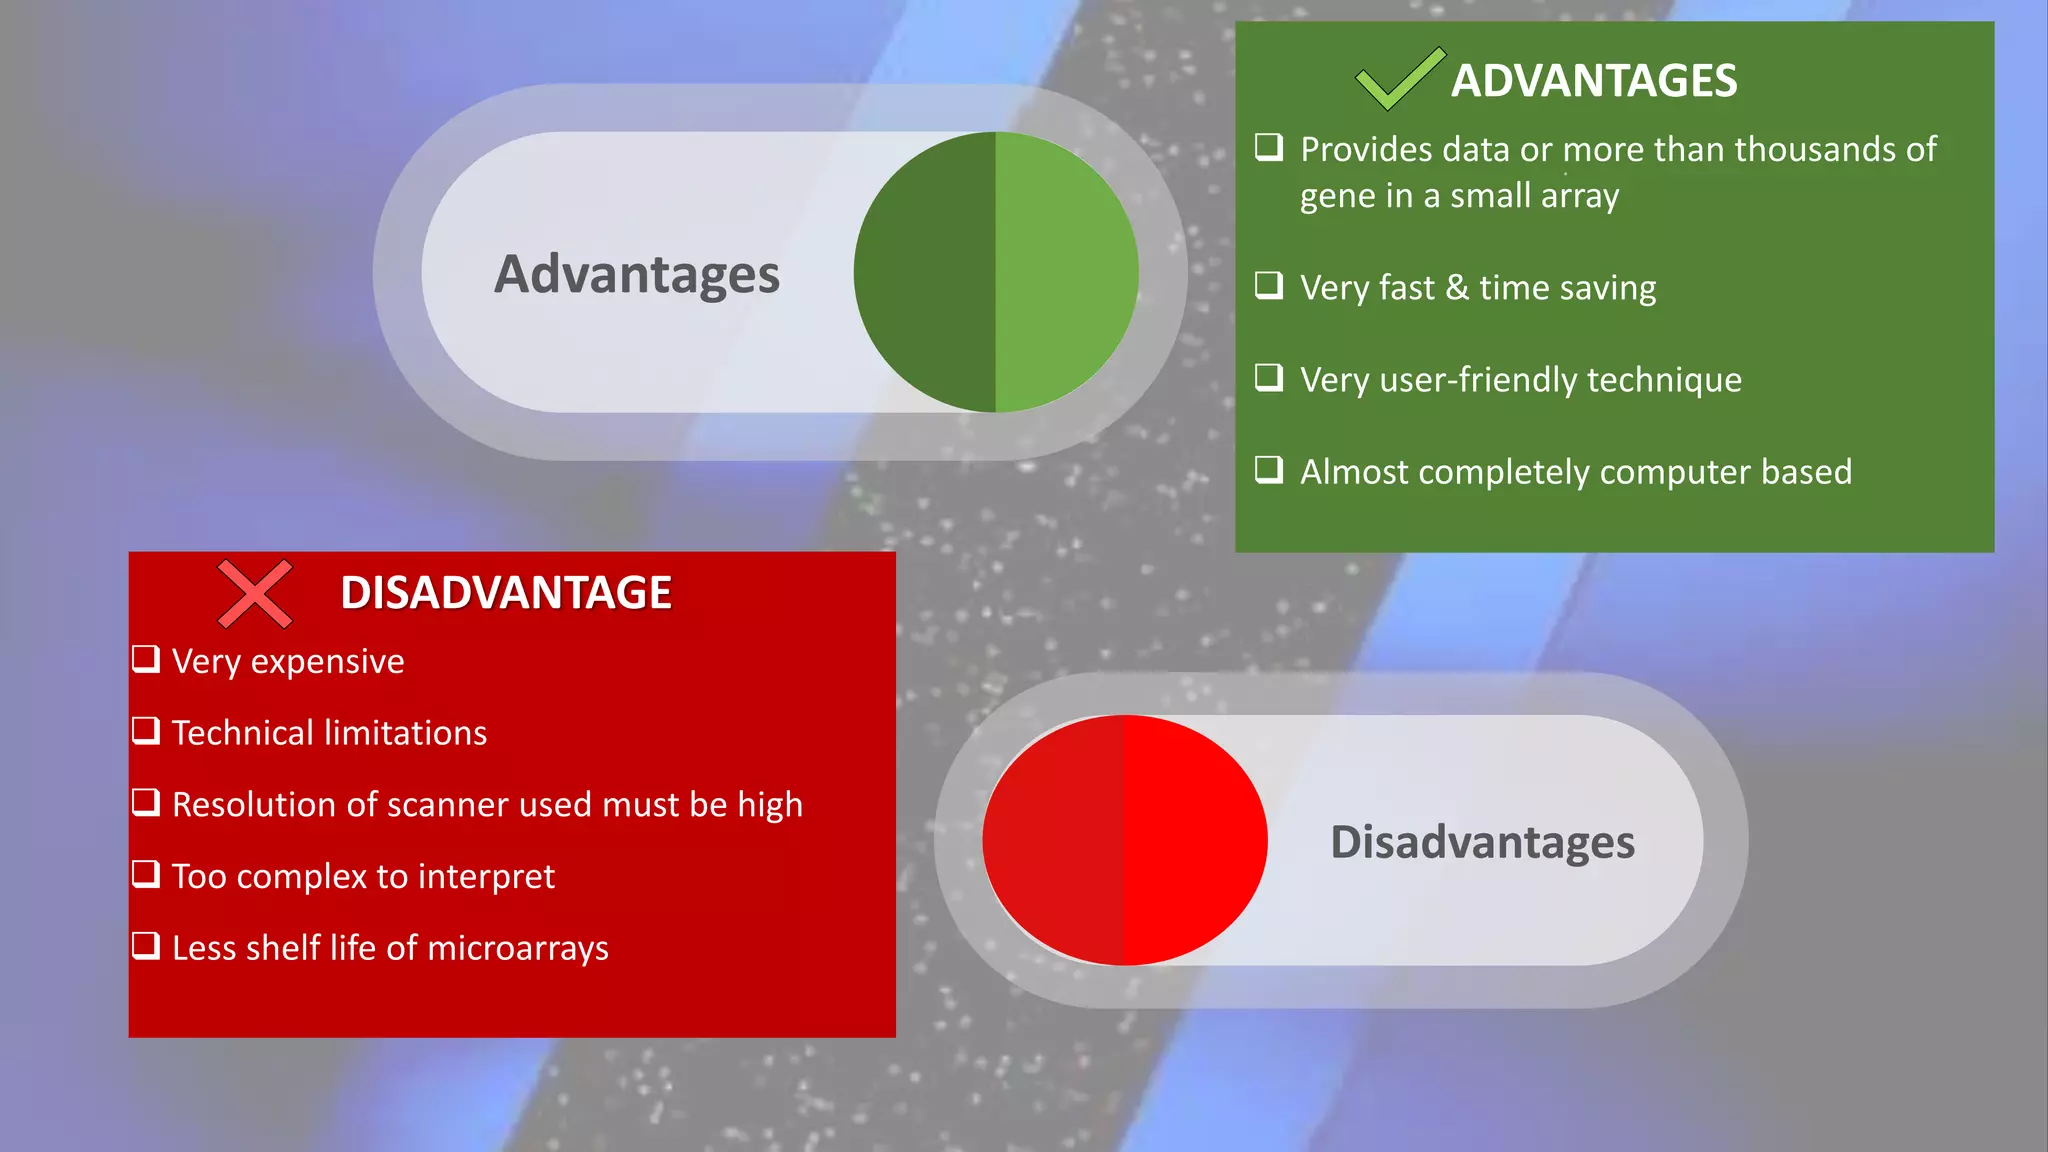
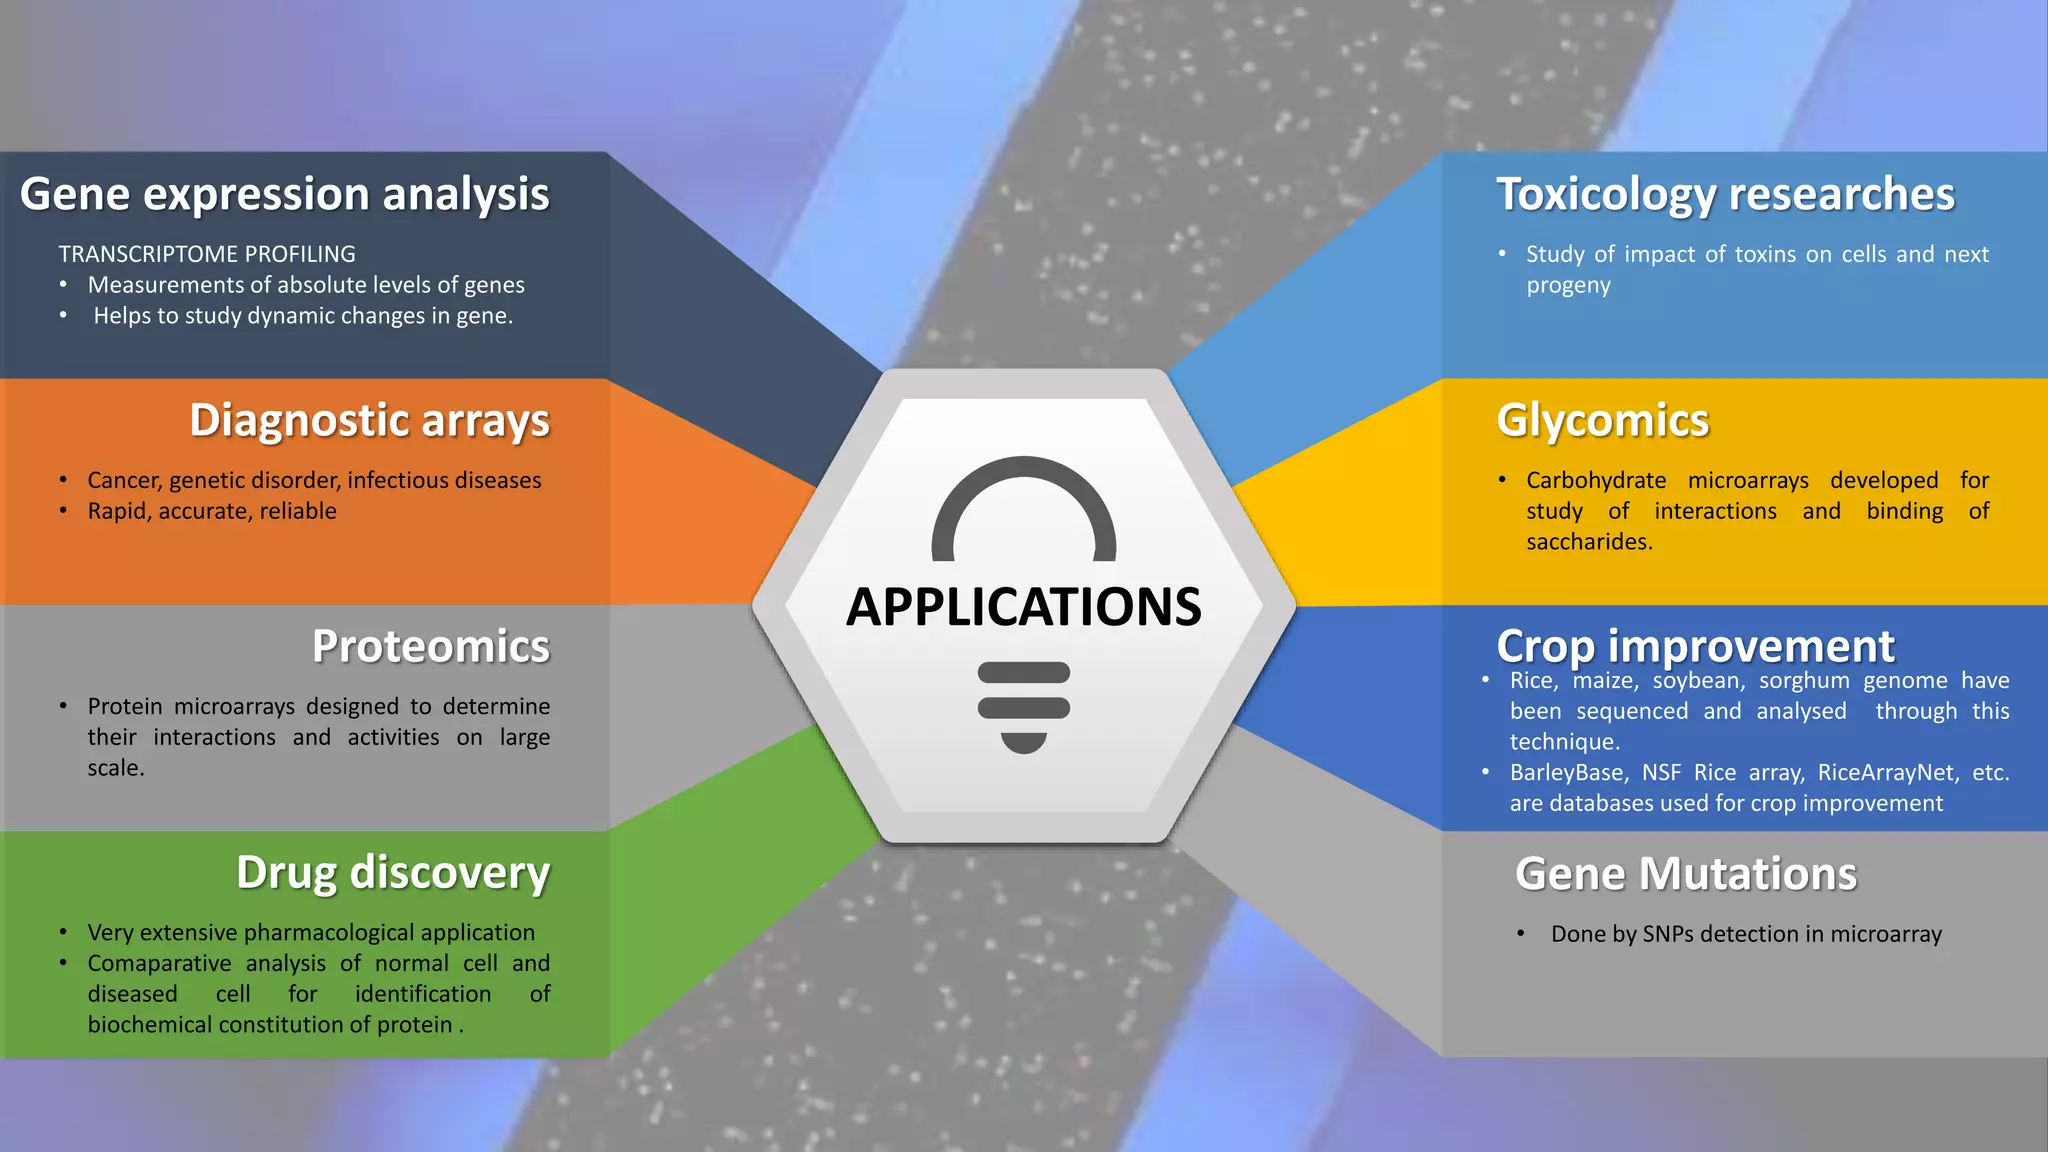
Microarray
ST. THOMAS COLLEGE, BHILAI
SESSION:
2020-21
Paper 9 : Genetic Engineering
Guided by :
Dr. Shubha Diwan
Presented by :
Pushpita Saha
(M.Sc. 3rd Sem Biotechnology)
C
O
N
T
E
N
T
S 8. References
5.
Experimental
procedure
2. History
6. Data
analysis
4.
Classification
7.
Applications
1.
Introduction
3. Principle
Introduction
• Microarray is a solid surface (membrane or glass slide) to which
biological molecules such as DNA, proteins, etc. are arranged in a
regular pattern in a very concise space.
• It’s a technology that enables to investigate on a large no. of genes
that are very cumbersome using traditional methods.
• Also called as BIO-CHIP or GENE-CHIP.
• Primarily used for
1. Identification of any particular gene sequence.
2. Expression Analysis of genes.
Fig 1: Microarray
Image source:
https://upload.wikimedia.org/wikipedia/commons/0/0e
/Microarray2.gif
History
In 1995, “ Quantitative monitoring of gene expression patterns with
complementary DNA microarray” was reported by Mark Schena and his
colleagues .
A complete eukaryotic genome of Saccharomyces cerevisiae on
microarray was published by Pat Brown and his group in 1997.
Mark Schena – The father of Microarray technique
Fig 2: Mark Schena
Image source: https://alchetron.com/cdn/mark-schena-7d54ccd7-324a-494f-b033-ba21fc03c79-resize-750.jpeg
Principle
• Based on hybridization principle.
• Each spot contains picomoles of short oligonucleotide sequences spotted
on the array surface called as probes.
• The sample is usually fluorescently labelled by dyes called as
fluorochrome
• Radio-labelling can also be done to label the target sample.
• The sample binds to the probe present on the array spots and
fluorescence caused at the sites of binding generates a signal i.e.
detected.
Types of Microarray
Types
Spotted
Microarrays
(cDNA)
In situ oligonucleotide
arrays
(GENE CHIPS)
Affymetrix Technology
Inkjet array synthesis
Mask-less photo-
deprotection technology
1. Spotted Microarray
1. Spotted Microarrays
• First technique in which microarrays were manufactured.
• Arrays are made using spotting robot .
• Pre synthesized cDNA are used as probes.
• Steps of array synthesis are
I. Making of DNA probes
II. Spotting arrays into glass surface using spotting robot.
III. Post-spotting processes.
Fig 3 : Spotting
Image source: Muller U R & Nicolau D V (2005)
Spotting Robot
Fig 4
Fig 5
Image source – Stekel , D. (2003)
2. In- situ
Oligonucleotide
Arrays
Fig 6 (a)
2. In- situ Oligonucleotide Arrays
• Instead of pre-synthesized cDNA, here oligos are built up base by base on the
array surface.
• Covalent reaction between ‘OH’ of sugar of last nucleotide to be attached to the
phosphate group of the next nucleotide.
• Each new nucleotide added consists of a protective group (PG) on 5’ position.
• This PG is converted into OH group by acid or light.
Fig 6(b) : Oligonucleotide array synthesis
Image source – Stekel , D. (2003)
Technologies for making in-situ Oligonucleotide Synthesis
1. Affymetrix
Technology
3. Inkjet
Array
Technology
2. Mask-less
photo-
deprotection
Technology
1. Affymetrix Technology
Image Source - https://www.researchgate.net/profile/Yi-
Wei_Tang/publication/26888549/figure/fig3/AS:277016894033926@1443057382670/Affymetrix-
GeneChip-oligonucleotide-microarray-Top-Photolithography-UV-light-is.png
Figure 7: Photolithography Figure 8: Gene Chip
Image Source -
https://upload.wikimedia.org/wikipedia/commo
ns/4/4b/201506_Affymetrix_Array_Chip.png
2. Mask-less Photo-deprotection Technology
Fig 9
Image source – Stekel , D. (2003)
3. Inkjet Array Technology
Image source - https://www.arrayjet.co.uk/uploads/tinymce/Arrayjet%20vs.%20pin-
spotting.jpg
Image source - https://www.genengnews.com/wp-
content/uploads/2018/10/block_3983.jpg
Figure 10:
Figure 11:
Difference between contact and non contact array printer
Summary of Microarray procedure
Figure 12 : Summary of Microarray Process
https://microbenotes.com/wp-content/uploads/2018/09/DNA-Microarray.jpg
Image source -
1. ARRAY PRINTING
• Glass slide/ membrane/ silicon chip used & uniformly coated with chemical that
interacts with probe and immobilizes it.
• Chemicals used – poly lysine, amino silanes
• Probe selection depends upon use of envisaged for the array.
• Probes usually obtained from cDNA library or PCR amplification of specific DNA
sequences.
• Post processing of Slide
Exposure of slides to UV rays or baking at 80 °C
DNA rendered into single strand
2. SAMPLE PREPARATION AND LABELLING
• Using phenol-based
method
• Using commercially
available kits
• Involves Reverse
transcription step
• Can be taken from libraries
of cDNA
• Crucial step at microarray process
• Usually, fluorochromes are used
• Cy 3- excited by green laser
(normal)
• Cy 5- excited by red laser
(abnormal)
Methods
of
labelling
Direct
Other
methods
Indirect
Fig 13 : Direct Labelling Fig 14: Indirect Labelling
Image source -
https://d3i71xaburhd42.net/483cc5f107a4c16e2d240
5dc58dfc741ed1/25-Figure4-1.png
Image source -
https://d3i71xaburhd42.16e2d2405dc58df7b19fc74
1ed1/25-Figure4-1.png
3. HYBRIDIZATION
• Heteroduplexes are formed by base pairing of the probe and the
labelled target sample.
• Blocking before hybridization is done to prevent non – specific
interactions.
Example:
Mixture of succinic anhydride, 1,2-dimethylpyrolidine & sodium borate
• Common components of hybridization solution contains salts,
detergents and buffering agents.
• Optimum temperature is between 45-65 ° C
• It can be manual or robotic.
Hybridization
Fig 15 : Hybridization
Fig 16: Types of Hybridization
Manual Robotic
Image source – Stekel , D. (2003)
4. WASHING
• Reasons for washing are
1. To remove excess hybridization solution and unhybridized sample
2. To increase stringency by reducing cross-hybridization
• Achieved by low salt wash or high temperature wash.
• The automated hybridization stations include washing cycle as a part
of automated process
5. SCANNING
• Scanner is a device that reads the array surface with the help of
fluorescence.
• It uses a light source to excite fluorophores present on the sample,
then detects the emitted light and stores as 16 bit tiff.
Fig 17: Working of scanner
https://www.biocompare.com/Lab-Equipment/20088-Microarray-Scanners-Microarray-Scanner-Systems
Scanner Types
Laser Scanners
CCD Scanners
02
01
• CCD is the source of
excitation.
• These capture multiple
images and then switch
altogether creating a more
accurate single image.
• Two different
monochromator is
used.
• PMT detects and
amplifies weak
signals.
Image source - https://www.olympus-global.com/en/news/2002tptb/image/nr02010e.gif
Image source – Stekel , D. (2003)
Fig 18: Laser scanner
working
Fig 19: CCD scanner working
IMAGE ANALYSIS AND DATA VISUALIZATION
Image acquisition depends upon a no. of factors such as follows:-
Fig 20: Gridding
Fig 21: Signal intensity filtering
Fig 23: Normalization
Image source -
https://journals.plos.org/plosone/article/figure/image?id=10.1371/journal.pone
.0172343.g002&size=large
Fig 22: Background noise cancellation
Image source - https://www.sicasys.de/fileadmin/newsletters/201706/images/noiseProcesssing.jpg
Image source -
https://www.researchgate.net/profile/Eleni_Zacharia/publication/224359286/fi
gure/fig1/AS:670006945779720@1536753512548/Gridding-results-in-a-
microarray-sub-image-contaminated-with-noise_Q320.jpg
Image source - https://media.springernature.com/full/springer-
static/image/art%3A10.1186%2Fs40478-018-0615-
0/MediaObjects/40478_2018_615_Fig4_HTML.png
DATA ANALYSIS
Quantification
PCA
.
Cluster Analysis
Scatter Plots
.
Microarray databases and tools
Image source - https://www.semanticscholar.org/paper/Bioinformatic-Tools-for-Inferring-Functional-from-Page-
Coulibaly/c9db61ecbc2bf4d306210db2845dc0e6b5f016bb
TABLE 1 : DATABASES TABLE 2: TOOLS
Image source - https://www.ebi.ac.uk/arrayexpress/
Fig 24(a): ArrayExpress homepage
Fig 24(b): ArrayExpress homepage
Image source - https://www.ebi.ac.uk/arrayexpress/
Fig 24(c): ArrayExpress homepage
Image source - https://www.ebi.ac.uk/arrayexpress/
Image source - https://images.slideplayer.com/16/5159679/slides/slide_2.jpg
Fig 25: Stanford microarray database homepage
Fig 26: GEO
Image source - https://www.ncbi.nlm.nih.gov/geo/
Advantages
Disadvantages
DISADVANTAGE
 Very expensive
 Technical limitations
 Resolution of scanner used must be high
 Too complex to interpret
 Less shelf life of microarrays
ADVANTAGES
.
 Provides data or more than thousands of
gene in a small array
 Very fast & time saving
 Very user-friendly technique
 Almost completely computer based
Gene expression analysis
TRANSCRIPTOME PROFILING
• Measurements of absolute levels of genes
• Helps to study dynamic changes in gene.
Diagnostic arrays
• Cancer, genetic disorder, infectious diseases
• Rapid, accurate, reliable
Proteomics
• Protein microarrays designed to determine
their interactions and activities on large
scale.
Drug discovery
• Very extensive pharmacological application
• Comaparative analysis of normal cell and
diseased cell for identification of
biochemical constitution of protein .
Toxicology researches
• Study of impact of toxins on cells and next
progeny
Glycomics
• Carbohydrate microarrays developed for
study of interactions and binding of
saccharides.
Crop improvement
• Rice, maize, soybean, sorghum genome have
been sequenced and analysed through this
technique.
• BarleyBase, NSF Rice array, RiceArrayNet, etc.
are databases used for crop improvement
Gene Mutations
• Done by SNPs detection in microarray
APPLICATIONS
REFERENCES
1 . C a u s t o n H C , Q u a c ke n b u s h J a n d B r a z m a A ( 2 0 0 3 )
“ M i c r o a r ra y - G e n e E x p r e s s i o n & a n a l y s i s ” 3 - 6 9
2 . S t e ke l D ( 2 0 0 4 ) “ M i c r o a r r a y B i o i n f o r m a t i c s ” C a m b r i d g e
U n i v e r s i t y P r e s s , 1 - 6 0
3 . A p p a s a n i K ( 2 0 0 7 ) “ B i o a r r a y s ” H u m a n a P r e s s , 1 4 8 - 1 7 5
4 . M u l l e r U R a n d N i c o l a u D V ( 2 0 0 4 ) “ M i c r o a r ra y
Te c h n o l o g y a n d i t s a p p l i c a t i o n ” 3 - 8 7
5 . H e l l e r M J ( 2 0 0 2 ) “ D N A M i c r o a r ra y Te c h n o l o g y :
D e v i c e s s y s t e m s & a p p l i c a t i o n s ” 1 2 0 - 1 4 3
6 . F e i z i T, Fa i z o F, C h a i W a n d Wo n g C H ( 2 0 0 3 ) “ C u r r e n t
o p i n i o n i n s t r u c t u ra l b i o l o g y ” 6 3 9 - 6 4 5
THANK YOU
Questions

Microarray By Pushpita Saha

  • 1.
    Microarray ST. THOMAS COLLEGE,BHILAI SESSION: 2020-21 Paper 9 : Genetic Engineering Guided by : Dr. Shubha Diwan Presented by : Pushpita Saha (M.Sc. 3rd Sem Biotechnology)
  • 2.
    C O N T E N T S 8. References 5. Experimental procedure 2.History 6. Data analysis 4. Classification 7. Applications 1. Introduction 3. Principle
  • 3.
    Introduction • Microarray isa solid surface (membrane or glass slide) to which biological molecules such as DNA, proteins, etc. are arranged in a regular pattern in a very concise space. • It’s a technology that enables to investigate on a large no. of genes that are very cumbersome using traditional methods. • Also called as BIO-CHIP or GENE-CHIP. • Primarily used for 1. Identification of any particular gene sequence. 2. Expression Analysis of genes. Fig 1: Microarray Image source: https://upload.wikimedia.org/wikipedia/commons/0/0e /Microarray2.gif
  • 4.
    History In 1995, “Quantitative monitoring of gene expression patterns with complementary DNA microarray” was reported by Mark Schena and his colleagues . A complete eukaryotic genome of Saccharomyces cerevisiae on microarray was published by Pat Brown and his group in 1997. Mark Schena – The father of Microarray technique Fig 2: Mark Schena Image source: https://alchetron.com/cdn/mark-schena-7d54ccd7-324a-494f-b033-ba21fc03c79-resize-750.jpeg
  • 5.
    Principle • Based onhybridization principle. • Each spot contains picomoles of short oligonucleotide sequences spotted on the array surface called as probes. • The sample is usually fluorescently labelled by dyes called as fluorochrome • Radio-labelling can also be done to label the target sample. • The sample binds to the probe present on the array spots and fluorescence caused at the sites of binding generates a signal i.e. detected.
  • 6.
    Types of Microarray Types Spotted Microarrays (cDNA) Insitu oligonucleotide arrays (GENE CHIPS) Affymetrix Technology Inkjet array synthesis Mask-less photo- deprotection technology
  • 7.
  • 8.
    1. Spotted Microarrays •First technique in which microarrays were manufactured. • Arrays are made using spotting robot . • Pre synthesized cDNA are used as probes. • Steps of array synthesis are I. Making of DNA probes II. Spotting arrays into glass surface using spotting robot. III. Post-spotting processes. Fig 3 : Spotting Image source: Muller U R & Nicolau D V (2005)
  • 9.
    Spotting Robot Fig 4 Fig5 Image source – Stekel , D. (2003) Image source – Stekel , D. (2003)
  • 10.
  • 11.
    2. In- situOligonucleotide Arrays • Instead of pre-synthesized cDNA, here oligos are built up base by base on the array surface. • Covalent reaction between ‘OH’ of sugar of last nucleotide to be attached to the phosphate group of the next nucleotide. • Each new nucleotide added consists of a protective group (PG) on 5’ position. • This PG is converted into OH group by acid or light. Fig 6(b) : Oligonucleotide array synthesis Image source – Stekel , D. (2003)
  • 12.
    Technologies for makingin-situ Oligonucleotide Synthesis 1. Affymetrix Technology 3. Inkjet Array Technology 2. Mask-less photo- deprotection Technology
  • 13.
    1. Affymetrix Technology ImageSource - https://www.researchgate.net/profile/Yi- Wei_Tang/publication/26888549/figure/fig3/AS:277016894033926@1443057382670/Affymetrix- GeneChip-oligonucleotide-microarray-Top-Photolithography-UV-light-is.png Figure 7: Photolithography Figure 8: Gene Chip Image Source - https://upload.wikimedia.org/wikipedia/commo ns/4/4b/201506_Affymetrix_Array_Chip.png
  • 14.
    2. Mask-less Photo-deprotectionTechnology Fig 9 Image source – Stekel , D. (2003)
  • 15.
    3. Inkjet ArrayTechnology Image source - https://www.arrayjet.co.uk/uploads/tinymce/Arrayjet%20vs.%20pin- spotting.jpg Image source - https://www.genengnews.com/wp- content/uploads/2018/10/block_3983.jpg Figure 10: Figure 11: Difference between contact and non contact array printer
  • 16.
  • 17.
    Figure 12 :Summary of Microarray Process https://microbenotes.com/wp-content/uploads/2018/09/DNA-Microarray.jpg Image source -
  • 18.
    1. ARRAY PRINTING •Glass slide/ membrane/ silicon chip used & uniformly coated with chemical that interacts with probe and immobilizes it. • Chemicals used – poly lysine, amino silanes • Probe selection depends upon use of envisaged for the array. • Probes usually obtained from cDNA library or PCR amplification of specific DNA sequences. • Post processing of Slide Exposure of slides to UV rays or baking at 80 °C DNA rendered into single strand
  • 19.
    2. SAMPLE PREPARATIONAND LABELLING • Using phenol-based method • Using commercially available kits • Involves Reverse transcription step • Can be taken from libraries of cDNA • Crucial step at microarray process • Usually, fluorochromes are used • Cy 3- excited by green laser (normal) • Cy 5- excited by red laser (abnormal)
  • 20.
    Methods of labelling Direct Other methods Indirect Fig 13 :Direct Labelling Fig 14: Indirect Labelling Image source - https://d3i71xaburhd42.net/483cc5f107a4c16e2d240 5dc58dfc741ed1/25-Figure4-1.png Image source - https://d3i71xaburhd42.16e2d2405dc58df7b19fc74 1ed1/25-Figure4-1.png
  • 21.
    3. HYBRIDIZATION • Heteroduplexesare formed by base pairing of the probe and the labelled target sample. • Blocking before hybridization is done to prevent non – specific interactions. Example: Mixture of succinic anhydride, 1,2-dimethylpyrolidine & sodium borate • Common components of hybridization solution contains salts, detergents and buffering agents. • Optimum temperature is between 45-65 ° C • It can be manual or robotic.
  • 22.
    Hybridization Fig 15 :Hybridization Fig 16: Types of Hybridization Manual Robotic Image source – Stekel , D. (2003) Image source – Stekel , D. (2003)
  • 23.
    4. WASHING • Reasonsfor washing are 1. To remove excess hybridization solution and unhybridized sample 2. To increase stringency by reducing cross-hybridization • Achieved by low salt wash or high temperature wash. • The automated hybridization stations include washing cycle as a part of automated process
  • 24.
    5. SCANNING • Scanneris a device that reads the array surface with the help of fluorescence. • It uses a light source to excite fluorophores present on the sample, then detects the emitted light and stores as 16 bit tiff. Fig 17: Working of scanner https://www.biocompare.com/Lab-Equipment/20088-Microarray-Scanners-Microarray-Scanner-Systems
  • 25.
    Scanner Types Laser Scanners CCDScanners 02 01 • CCD is the source of excitation. • These capture multiple images and then switch altogether creating a more accurate single image. • Two different monochromator is used. • PMT detects and amplifies weak signals. Image source - https://www.olympus-global.com/en/news/2002tptb/image/nr02010e.gif Image source – Stekel , D. (2003) Fig 18: Laser scanner working Fig 19: CCD scanner working
  • 26.
    IMAGE ANALYSIS ANDDATA VISUALIZATION Image acquisition depends upon a no. of factors such as follows:-
  • 27.
    Fig 20: Gridding Fig21: Signal intensity filtering Fig 23: Normalization Image source - https://journals.plos.org/plosone/article/figure/image?id=10.1371/journal.pone .0172343.g002&size=large Fig 22: Background noise cancellation Image source - https://www.sicasys.de/fileadmin/newsletters/201706/images/noiseProcesssing.jpg Image source - https://www.researchgate.net/profile/Eleni_Zacharia/publication/224359286/fi gure/fig1/AS:670006945779720@1536753512548/Gridding-results-in-a- microarray-sub-image-contaminated-with-noise_Q320.jpg Image source - https://media.springernature.com/full/springer- static/image/art%3A10.1186%2Fs40478-018-0615- 0/MediaObjects/40478_2018_615_Fig4_HTML.png
  • 28.
  • 29.
    Microarray databases andtools Image source - https://www.semanticscholar.org/paper/Bioinformatic-Tools-for-Inferring-Functional-from-Page- Coulibaly/c9db61ecbc2bf4d306210db2845dc0e6b5f016bb TABLE 1 : DATABASES TABLE 2: TOOLS
  • 30.
    Image source -https://www.ebi.ac.uk/arrayexpress/ Fig 24(a): ArrayExpress homepage
  • 31.
    Fig 24(b): ArrayExpresshomepage Image source - https://www.ebi.ac.uk/arrayexpress/
  • 32.
    Fig 24(c): ArrayExpresshomepage Image source - https://www.ebi.ac.uk/arrayexpress/
  • 33.
    Image source -https://images.slideplayer.com/16/5159679/slides/slide_2.jpg Fig 25: Stanford microarray database homepage
  • 34.
    Fig 26: GEO Imagesource - https://www.ncbi.nlm.nih.gov/geo/
  • 35.
    Advantages Disadvantages DISADVANTAGE  Very expensive Technical limitations  Resolution of scanner used must be high  Too complex to interpret  Less shelf life of microarrays ADVANTAGES .  Provides data or more than thousands of gene in a small array  Very fast & time saving  Very user-friendly technique  Almost completely computer based
  • 36.
    Gene expression analysis TRANSCRIPTOMEPROFILING • Measurements of absolute levels of genes • Helps to study dynamic changes in gene. Diagnostic arrays • Cancer, genetic disorder, infectious diseases • Rapid, accurate, reliable Proteomics • Protein microarrays designed to determine their interactions and activities on large scale. Drug discovery • Very extensive pharmacological application • Comaparative analysis of normal cell and diseased cell for identification of biochemical constitution of protein . Toxicology researches • Study of impact of toxins on cells and next progeny Glycomics • Carbohydrate microarrays developed for study of interactions and binding of saccharides. Crop improvement • Rice, maize, soybean, sorghum genome have been sequenced and analysed through this technique. • BarleyBase, NSF Rice array, RiceArrayNet, etc. are databases used for crop improvement Gene Mutations • Done by SNPs detection in microarray APPLICATIONS
  • 37.
    REFERENCES 1 . Ca u s t o n H C , Q u a c ke n b u s h J a n d B r a z m a A ( 2 0 0 3 ) “ M i c r o a r ra y - G e n e E x p r e s s i o n & a n a l y s i s ” 3 - 6 9 2 . S t e ke l D ( 2 0 0 4 ) “ M i c r o a r r a y B i o i n f o r m a t i c s ” C a m b r i d g e U n i v e r s i t y P r e s s , 1 - 6 0 3 . A p p a s a n i K ( 2 0 0 7 ) “ B i o a r r a y s ” H u m a n a P r e s s , 1 4 8 - 1 7 5 4 . M u l l e r U R a n d N i c o l a u D V ( 2 0 0 4 ) “ M i c r o a r ra y Te c h n o l o g y a n d i t s a p p l i c a t i o n ” 3 - 8 7 5 . H e l l e r M J ( 2 0 0 2 ) “ D N A M i c r o a r ra y Te c h n o l o g y : D e v i c e s s y s t e m s & a p p l i c a t i o n s ” 1 2 0 - 1 4 3 6 . F e i z i T, Fa i z o F, C h a i W a n d Wo n g C H ( 2 0 0 3 ) “ C u r r e n t o p i n i o n i n s t r u c t u ra l b i o l o g y ” 6 3 9 - 6 4 5
  • 38.
  • 39.

Editor's Notes

  • #26 © Copyright PresentationGO.com – The free PowerPoint and Google Slides template library
  • #29 © Copyright PresentationGO.com – The free PowerPoint and Google Slides template library
  • #36 © Copyright PresentationGO.com – The free PowerPoint and Google Slides template library
  • #37 © Copyright PresentationGO.com – The free PowerPoint and Google Slides template library