1. 30th Oct’14 Aaj Ka Trend
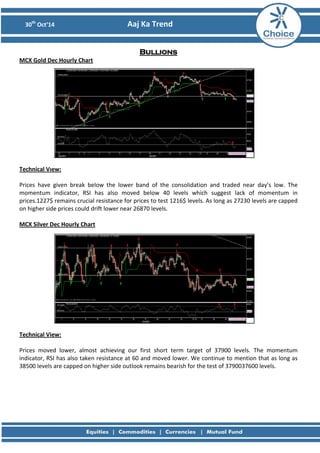
Bullions MCX Gold Dec Hourly Chart
Technical View: Prices have given break below the lower band of the consolidation and traded near day’s low. The momentum indicator, RSI has also moved below 40 levels which suggest lack of momentum in prices.1227$ remains crucial resistance for prices to test 1216$ levels. As long as 27230 levels are capped on higher side prices could drift lower near 26870 levels. MCX Silver Dec Hourly Chart
Technical View: Prices moved lower, almost achieving our first short term target of 37900 levels. The momentum indicator, RSI has also taken resistance at 60 and moved lower. We continue to mention that as long as 38500 levels are capped on higher side outlook remains bearish for the test of 3790037600 levels.
2. 30th Oct’14 Aaj Ka Trend
Fundamental News:
• Gold futures little changed ahead of Fed outcome
• Gold prices were little changed on Wednesday, as investors remained cautious ahead of the outcome of a highly anticipated Federal Reserve meeting later in the day.
• On the Comex division of the New York Mercantile Exchange, gold futures for December delivery traded at $1,229.00 a troy ounce during European morning hours, down 40 cents, or 0.03%
Pivot Levels for the Day:
S1
S2
S3
Pivot
R1
R2
R3
Gold
26996
26914
26732
27096
27178
27278
27460
Silver
38052
37831
37473
38189
38410
38547
38905
Recommendation:
Gold
Sell
Silver
Sell
3. 30th Oct’14 Aaj Ka Trend
Base Metals MCX Copper Nov Hourly Chart
Technical Views: Prices moved higher negating the bearish bat formation. However prices are trading near the immediate resistance of 422 levels. Breach of the mentioned resistance could move prices towards 426/428 levels while failure to breach the mentioned levels could drift prices towards 419/416 levels. Favored view remains bullish as the momentum indicator, RSI is above 60 levels.
MCX Aluminum Oct Hourly Chart
MCX Lead Oct Hourly Chart
MCX Nickel Oct Hourly Chart
MCX Zinc Oct Hourly Chart
4. 30th Oct’14 Aaj Ka Trend
Fundamental News:
• Copper futures hit 11-day high ahead of FOMC statement.
• Copper prices rose to a fresh two-week high on Wednesday, amid speculation the Fed will reassure markets that interest rates will remain on hold for some time to come.
• On the Comex division of the New York Mercantile Exchange, copper for December delivery rose to a session high of $3.099 a pound, the most since October 14. Prices last traded at $3.092 a pound during European morning hours, up 0.2 cents, or 0.05%
Pivot Levels for the Day:
S1
S2
S3
Pivot
R1
R2
R3
Copper
419.2
416.8
412.8
420.9
423.3
424.9
429.0
Aluminum
122.7
120.7
117.2
124.1
126.1
127.6
131.0
Lead
123.8
123.2
122.1
124.3
124.9
125.4
126.5
Nickel
942.8
927.5
898.2
956.8
972.1
986.1
1015.4
Zinc
138.8
136.4
132.8
140.1
142.5
143.7
147.4
Recommendation:
Copper
Buy above 422
Aluminum
Buy on dips
Lead
Sell
Nickel
Buy
Zinc
Buy on dips
5. 30th Oct’14 Aaj Ka Trend
Energy MCX Crude Nov Hourly Chart:
Technical Views: Prices moved higher almost achieving our first short term target of 5100 levels. Bias remains bullish with no change in outlook as prices are trading above the center band of the Bollinger band. The momentum indicator, RSI has also moved above 60 levels giving momentum confirmation for prices. As long as 5000 levels are protected on downside prices can head towards 5150/5200 levels. MCX Natural Gas Oct Hourly Chart:
Technical Views: Prices have given positive confirmation as prices have broken the crucial resistance of 227. For now dips can be considered as good buying opportunity to test 237/239levels. While 229 could act as a support. RSI has also in overbought zone so correction could be healthy for prices to again start moving higher. Super trend indicator has also moved into buy zone.
6. 30th Oct’14 Aaj Ka Trend
Fundamental News:
• Natural gas futures rise to 1-week high ahead of storage data.
• U.S. natural gas futures rose to a one-week high on Wednesday, as market players monitored near-term weather forecasts to gauge the strength of demand for the fuel ahead of Thursday’s closely-watched supply report
• On the New York Mercantile Exchange, natural gas for delivery in December climbed to a session high of $3.790 per million British thermal units, the most since October 22.
• An upbeat report on U.S. oil stockpiles coupled with a weaker dollar ahead of the Federal Reserve's monetary policy statement due out later sent crude futures gaining on Wednesday
• A weaker greenback makes oil and more attractive commodity in dollar-denominated exchanges, especially in the eyes of investors holding other currencies
• In the New York Mercantile Exchange, West Texas Intermediate crude oil futures for delivery in December traded up 1.40% at $82.56 a barrel during U.S. trading, up from a session low of $81.31 a barrel and off a high of $82.87 a barrel.
Pivot Levels for the Day:
S1
S2
S3
Pivot
R1
R2
R3
Crude
5017
4951
4846
5056
5122
5161
5266
Natural Gas
233.8
226.2
216.9
235.5
243.1
244.8
254.1
Recommendation:
Crude
Buy
Natural Gas
Buy on dips
8. 30th Oct’14 Aaj Ka Trend
This is solely for information of clients of Choice India and does not construe to be an investment advice. It is also not intended as an offer or solicitation for the purchase and sale of any financial instruments. Any action taken by you on the basis of the information contained herein is your responsibility alone and Choice India its subsidiaries or its employees or associates will not be liable in any manner for the consequences of such action taken by you. We have exercised due diligence in checking the correctness and authenticity of the information contained in this recommendation, but Choice India or any of its subsidiaries or associates or employees shall not be in any way responsible for any loss or damage that may arise to any person from any inadvertent error in the information contained in this recommendation or any action taken on basis of this information. Technical analysis studies market psychology, price patterns and volume levels. It is used to forecast future price and market movements. Technical analysis is complementary to fundamental analysis and news sources. The recommendations issued herewith might be contrary to recommendations issued by Choice India in the company research undertaken as the recommendations stated in this report is derived purely from technical analysis. Choice India has based this document on information obtained from sources it believes to be reliable but which it has not independently verified; Choice India makes no guarantee, representation or warranty and accepts no responsibility or liability as to its accuracy or completeness. The opinions contained within the report are based upon publicly available information at the time of publication and are subject to change without notice. The information and any disclosures provided herein are in summary form and have been prepared for informational purposes. The recommendations and suggested price levels are intended purely for trading purposes. The recommendations are valid for the day of the report however trading trends and volumes might vary substantially on an intraday basis and the recommendations may be subject to change. The information and any disclosures provided herein may be considered confidential. Any use, distribution, modification, copying, forwarding or disclosure by any person is strictly prohibited. The information and any disclosures provided herein do not constitute a solicitation or offer to purchase or sell any security or other financial product or instrument. The current performance may be unaudited. Past performance does not guarantee future returns. There can be no assurance that investments will achieve any targeted rates of return, and there is no guarantee against the loss of your entire investment. POTENTIAL CONFLICT OF INTEREST DISCLOSURE (as on date of report) Disclosure of interest statement – • Analyst interest of the stock /Instrument(s): - No. • Firm interest of the stock / Instrument (s): - No.
Disclaimer