1. 25th Sept 2014 Aaj Ka Trend
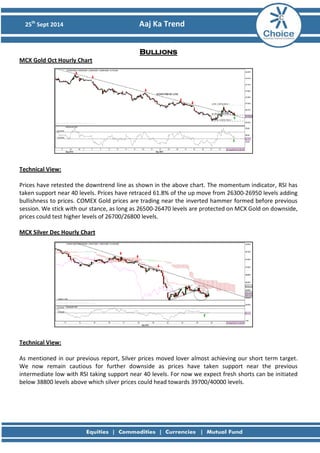
Bullions MCX Gold Oct Hourly Chart
Technical View: Prices have retested the downtrend line as shown in the above chart. The momentum indicator, RSI has taken support near 40 levels. Prices have retraced 61.8% of the up move from 26300-26950 levels adding bullishness to prices. COMEX Gold prices are trading near the inverted hammer formed before previous session. We stick with our stance, as long as 26500-26470 levels are protected on MCX Gold on downside, prices could test higher levels of 26700/26800 levels. MCX Silver Dec Hourly Chart
Technical View: As mentioned in our previous report, Silver prices moved lover almost achieving our short term target. We now remain cautious for further downside as prices have taken support near the previous intermediate low with RSI taking support near 40 levels. For now we expect fresh shorts can be initiated below 38800 levels above which silver prices could head towards 39700/40000 levels.
2. 25th Sept 2014 Aaj Ka Trend
Fundamental News:
• Gold prices trimmed gains on Wednesday, as continued strength in the U.S. dollar dampened demand for the precious metal.
• Gold prices gained ground on Tuesday, recovering from the lowest levels since January as the dollar eased after hitting four year highs against a basket of major currencies.
• The strikes are part of a military campaign the Obama administration authorized nearly two weeks ago to "degrade, and ultimately destroy" the ISIS fighters.
Pivot Levels for the Day:
S1
S2
S3
Pivot
R1
R2
R3
Gold
26471
26394
26182
26606
26683
26818
27030
Silver
38922
38579
37851
39307
39650
40035
40763
Recommendation:
Gold
Buy
Silver
Buy
3. 25th Sept 2014 Aaj Ka Trend
Base Metals MCX Copper Nov Daily Chart
Technical Views: As mentioned copper prices initially moved lower near our recommended levels and moved higher. We expect prices should remain within the range of 412-418 levels for few trading session as the momentum indicator RSI is also moving in the range of 60-40 levels. Copper prices have formed spinning bottom on daily timeframe which would indicate downside is limited.
MCX Aluminum Sept Hourly Chart
MCX Lead Sept Hourly Chart
MCX Nickel Sept Hourly Chart
MCX Zinc Sept Hourly Chart
4. 25th Sept 2014 Aaj Ka Trend
Fundamental News:
• The red metal rebounded from a three-month low today after the release of Positive New Homes Sales USA Data.
• Positive Housing Data will boost Demand for all the Base Metals and the Outlook for Base Metals looks Positive from here on.
• Core durable good order and durable goods order will the data to watch out for base metals this week.
Pivot Levels for the Day:
S1
S2
S3
Pivot
R1
R2
R3
Copper
412.7
409.6
403.9
415.3
418.4
421.0
426.7
Aluminum
117.7
116.8
115.3
118.4
119.3
119.9
121.5
Lead
125.7
124.4
122.3
126.4
127.7
128.5
130.5
Nickel
1046.9
1033.5
1012.1
1054.9
1068.3
1076.3
1097.7
Zinc
137.7
136.6
135.0
138.3
139.3
139.9
141.6
Recommendation:
Copper
Buy
Aluminum
Neutral
Lead
Buy
Nickel
Buy
Zinc
Buy
5. 25th Sept 2014 Aaj Ka Trend
Energy MCX Crude Oct Hourly Chart:
Technical Views: Prices are trading in the range along with the momentum indicator, RSI which is moving in the range of 60-40 levels. MACD has moved above zero levels on hourly chart which adds positive confirmation for prices to move higher. RSI has formed positive reversal on hourly chart of NYMEX Crude which would add bullishness to prices. Break above 91.95$ could move prices towards 92.20/92.35$ levels. On MCX Crude, break above 5650 could move prices towards 5780/5850 levels. MCX Natural Gas Sept Hourly Chart:
Technical Views: Natural gas prices moved lover below uptrend line but failed to move below our mentioned levels of 230 and moved higher. Prices have given hourly close above the downtrend line shown in the above chart. RSI is near 60 above which prices would be supported by the momentum as well. We now expect prices should move towards 240/243 levels as long as 230 is protected on down side.
6. 25th Sept 2014 Aaj Ka Trend
Fundamental News:
• Crude prices edged higher on Wednesday on the coattails of upbeat U.S. inventory data, though concerns the world is awash in oil at a time when global demand remains soft sent futures dipping into negative territory at times.
• The Department of Energy reported earlier that crude stockpiles plunged by 4.3 million barrels last week, confounding market calls for a build of 386,000.
• Natural gas prices fell on Tuesday after updated weather-forecasting models scaled back on calls for colder temperatures dipping across the U.S., with milder temperatures seen reducing the need for air conditioning or heating.
• A blast of cool air sweeping in from Canada might not dip as far south as markets have been expecting, which sent natural gas prices falling on expectations for power thermal plants to burn less of the commodity due to mild mercury readings.
Pivot Levels for the Day:
S1
S2
S3
Pivot
R1
R2
R3
Crude
5597
5563
5507
5619
5653
5675
5731
Natural Gas
234.1
230.2
224.9
235.5
239.4
240.8
246.1
Recommendation:
Crude
Buy above 5650
Natural Gas
Buy
8. 25th Sept 2014 Aaj Ka Trend
Disclaimer
This is solely for information of clients of Choice India and does not construe to be an investment advice. It is also not intended as an offer or solicitation for the purchase and sale of any financial instruments. Any action taken by you on the basis of the information contained herein is your responsibility alone and Choice India its subsidiaries or its employees or associates will not be liable in any manner for the consequences of such action taken by you. We have exercised due diligence in checking the correctness and authenticity of the information contained in this recommendation, but Choice India or any of its subsidiaries or associates or employees shall not be in any way responsible for any loss or damage that may arise to any person from any inadvertent error in the information contained in this recommendation or any action taken on basis of this information. Technical analysis studies market psychology, price patterns and volume levels. It is used to forecast future price and market movements. Technical analysis is complementary to fundamental analysis and news sources. The recommendations issued herewith might be contrary to recommendations issued by Choice India in the company research undertaken as the recommendations stated in this report is derived purely from technical analysis. Choice India has based this document on information obtained from sources it believes to be reliable but which it has not independently verified; Choice India makes no guarantee, representation or warranty and accepts no responsibility or liability as to its accuracy or completeness. The opinions contained within the report are based upon publicly available information at the time of publication and are subject to change without notice. The information and any disclosures provided herein are in summary form and have been prepared for informational purposes. The recommendations and suggested price levels are intended purely for trading purposes. The recommendations are valid for the day of the report however trading trends and volumes might vary substantially on an intraday basis and the recommendations may be subject to change. The information and any disclosures provided herein may be considered confidential. Any use, distribution, modification, copying, forwarding or disclosure by any person is strictly prohibited. The information and any disclosures provided herein do not constitute a solicitation or offer to purchase or sell any security or other financial product or instrument. The current performance may be unaudited. Past performance does not guarantee future returns. There can be no assurance that investments will achieve any targeted rates of return, and there is no guarantee against the loss of your entire investment. POTENTIAL CONFLICT OF INTEREST DISCLOSURE (as on date of report) Disclosure of interest statement – • Analyst interest of the stock /Instrument(s): - No. • Firm interest of the stock / Instrument (s): - No.