1. 07th Oct’14 Aaj Ka Trend
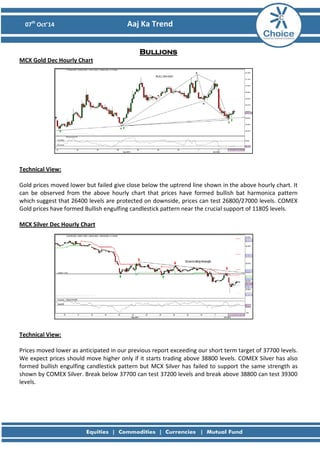
Bullions MCX Gold Dec Hourly Chart
Technical View: Gold prices moved lower but failed give close below the uptrend line shown in the above hourly chart. It can be observed from the above hourly chart that prices have formed bullish bat harmonica pattern which suggest that 26400 levels are protected on downside, prices can test 26800/27000 levels. COMEX Gold prices have formed Bullish engulfing candlestick pattern near the crucial support of 1180$ levels. MCX Silver Dec Hourly Chart
Technical View: Prices moved lower as anticipated in our previous report exceeding our short term target of 37700 levels. We expect prices should move higher only if it starts trading above 38800 levels. COMEX Silver has also formed bullish engulfing candlestick pattern but MCX Silver has failed to support the same strength as shown by COMEX Silver. Break below 37700 can test 37200 levels and break above 38800 can test 39300 levels.
2. 07th Oct’14 Aaj Ka Trend
Fundamental News:
• Gold futures inched higher during U.S. morning trade, but held below the key $1,200-level as upbeat U.S. employment data underlined optimism over the strength of the economy and fuelled expectations that the Federal Reserve will begin to raise rates sooner than previously thought.
• Gold and silver recovered as the U.S. dollar took a breather from its recent rally against a basket of other major currencies sparked by upbeat U.S. employment data.
• Data from the CFTC showed that net silver shorts totaled 6,073 contracts as of last week, compared to net shorts of 4,893 contracts in the preceding week.
• On the week, the December silver futures contract lost 75.0 cents, or 4.26%, the fifth straight weekly loss.
Pivot Levels for the Day:
S1
S2
S3
Pivot
R1
R2
R3
Gold
26774
26643
26442
26844
26975
27045
27246
Silver
38086
37684
37025
38343
38745
39002
39661
Recommendation:
Gold
Buy
Silver
Neutral
3. 07th Oct’14 Aaj Ka Trend
Base Metals MCX Copper Nov Daily Chart
Technical Views: As anticipated Copper prices moved lower achieving our short term target of 413 levels. On Daily timeframe prices have formed bullish Harami candlestick pattern indicating break above 417 can move prices towards higher levels. Prices have also taken support near 61.8% retracement level of the previous up move from 494-439 levels. The momentum indicator, RSI has taken support near 40 levels which would add bullishness to the prices. For now, as long as 411 levels are protected on downside prices can head towards 420/425 levels.
MCX Aluminum Oct Hourly Chart
MCX Lead Oct Hourly Chart
MCX Nickel Oct Hourly Chart
MCX Zinc Oct Hourly Chart
4. 07th Oct’14 Aaj Ka Trend
Fundamental News:
• Copper futures edge higher as greenback rally pauses.
• Copper futures edged higher during European morning trade on Monday, as the greenback took a breather from its recent rally against a basket of other major currencies sparked by upbeat U.S. employment data.
• On the COMEX division of the New York Mercantile Exchange, copper for December delivery traded at $3.015 a pound during European morning hours, up 1.6 cents, or 0.54%, from a closing price of $2.998.
Pivot Levels for the Day:
S1
S2
S3
Pivot
R1
R2
R3
Copper
414.6
413.0
410.1
424.4
417.5
418.7
421.5
Aluminum
118.7
118.5
118.2
118.8
119.0
119.1
119.4
Lead
128.5
127.4
125.6
129.1
130.2
130.9
132.6
Nickel
1021.7
1010.8
992.8
1028.8
1039.7
1046.8
1064.8
Zinc
141.0
139.9
138.2
141.6
142.7
143.3
145.0
Recommendation:
Copper
Buy
Aluminum
Sell Below 117.40
Lead
Buy
Nickel
Buy
Zinc
Buy
5. 07th Oct’14 Aaj Ka Trend
Energy MCX Crude Oct Hourly Chart:
Technical Views: MCX Crude prices moved lower achieving our short term target of 5500 levels. It can be observed from the above hourly chart that prices have broken the crucial support of 5560 levels. However rallies near 5560-5600 can be used as selling opportunity to test lower levels. 91.80$ on NYMEX Crude prices can move prices towards higher levels while failure to breach the mentioned levels could suggest weakness. MCX Natural Gas Oct Hourly Chart:
Technical Views: Natural gas prices moved lower with bearish range shift on the momentum indicator, RSI on hourly chart. Prices are trading near the previous gap level of 241 which could act as a support for the test of higher levels while breach of 240 levels could attract more selling pressure.
6. 07th Oct’14 Aaj Ka Trend
Fundamental News:
• Brent oil futures fall to fresh 27-month low on ample global supplies.
• Brent oil futures fell to a 27-month low during U.S. morning trade on Monday, amid ongoing speculation rising global supplies will be more than enough to meet slowing demand.
• London-traded Brent prices have fallen more than 20% since June, when it climbed near $116 following violence in the Middle East and North Africa.
• U.S. natural gas futures gave back all of the previous session's strong gains during U.S. morning trade on Monday, as market players positioned themselves for a bearish weekly storage report later in the week.
• Investors continued to digest last week's inventory data, which showed a larger than expected increase for the 24th consecutive week.
Pivot Levels for the Day:
S1
S2
S3
Pivot
R1
R2
R3
Crude
5496
5436
5335
5537
5597
5638
5739
Natural Gas
222.9
228.0
220.5
235.5
230.4
243.0
250.5
Recommendation:
Crude
Sell on Rallies
Natural Gas
Neutral
8. 07th Oct’14 Aaj Ka Trend
Disclaimer
This is solely for information of clients of Choice India and does not construe to be an investment advice. It is also not intended as an offer or solicitation for the purchase and sale of any financial instruments. Any action taken by you on the basis of the information contained herein is your responsibility alone and Choice India its subsidiaries or its employees or associates will not be liable in any manner for the consequences of such action taken by you. We have exercised due diligence in checking the correctness and authenticity of the information contained in this recommendation, but Choice India or any of its subsidiaries or associates or employees shall not be in any way responsible for any loss or damage that may arise to any person from any inadvertent error in the information contained in this recommendation or any action taken on basis of this information. Technical analysis studies market psychology, price patterns and volume levels. It is used to forecast future price and market movements. Technical analysis is complementary to fundamental analysis and news sources. The recommendations issued herewith might be contrary to recommendations issued by Choice India in the company research undertaken as the recommendations stated in this report is derived purely from technical analysis. Choice India has based this document on information obtained from sources it believes to be reliable but which it has not independently verified; Choice India makes no guarantee, representation or warranty and accepts no responsibility or liability as to its accuracy or completeness. The opinions contained within the report are based upon publicly available information at the time of publication and are subject to change without notice. The information and any disclosures provided herein are in summary form and have been prepared for informational purposes. The recommendations and suggested price levels are intended purely for trading purposes. The recommendations are valid for the day of the report however trading trends and volumes might vary substantially on an intraday basis and the recommendations may be subject to change. The information and any disclosures provided herein may be considered confidential. Any use, distribution, modification, copying, forwarding or disclosure by any person is strictly prohibited. The information and any disclosures provided herein do not constitute a solicitation or offer to purchase or sell any security or other financial product or instrument. The current performance may be unaudited. Past performance does not guarantee future returns. There can be no assurance that investments will achieve any targeted rates of return, and there is no guarantee against the loss of your entire investment. POTENTIAL CONFLICT OF INTEREST DISCLOSURE (as on date of report) Disclosure of interest statement – • Analyst interest of the stock /Instrument(s): - No. • Firm interest of the stock / Instrument (s): - No.