1. 09th Oct’14 Aaj Ka Trend
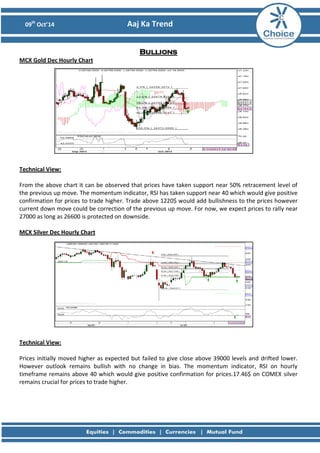
Bullions MCX Gold Dec Hourly Chart
Technical View: From the above chart it can be observed that prices have taken support near 50% retracement level of the previous up move. The momentum indicator, RSI has taken support near 40 which would give positive confirmation for prices to trade higher. Trade above 1220$ would add bullishness to the prices however current down move could be correction of the previous up move. For now, we expect prices to rally near 27000 as long as 26600 is protected on downside. MCX Silver Dec Hourly Chart
Technical View: Prices initially moved higher as expected but failed to give close above 39000 levels and drifted lower. However outlook remains bullish with no change in bias. The momentum indicator, RSI on hourly timeframe remains above 40 which would give positive confirmation for prices.17.46$ on COMEX silver remains crucial for prices to trade higher.
2. 09th Oct’14 Aaj Ka Trend
Fundamental News:
• Gold futures rose for the third consecutive session on Wednesday, as investors turned their attention to the minutes of the Federal Reserve’s September meeting, due out later in the day, for fresh indications on the future possible direction of U.S. monetary policy.
• On the Comex division of the New York Mercantile Exchange, for December delivery traded at $1,217.60 a troy ounce, up $5.20, or 0.43%.
Pivot Levels for the Day:
S1
S2
S3
Pivot
R1
R2
R3
Gold
26630
26522
26232
26812
26920
27102
27392
Silver
37962
37708
36997
38419
38673
39130
39841
Recommendation:
Gold
Buy
Silver
Buy
3. 09th Oct’14 Aaj Ka Trend
Base Metals MCX Copper Nov Daily Chart
Technical Views: Copper prices moved lower but failed to give close below our mentioned support level of 411 levels. Prices have taken support near the 61.8% retracement level of the up move shown in the above chart which happens to the multiple support levels. The momentum indicator, RSI has taken support near the 40 levels. For now we expect prices could remain strong above 411 below which panic fall is expected which would drift copper prices towards 407 levels.
MCX Aluminum Oct Hourly Chart
MCX Lead Oct Hourly Chart
MCX Nickel Oct Hourly Chart
MCX Zinc Oct Hourly Chart
4. 09th Oct’14 Aaj Ka Trend
Fundamental News:
• Copper futures edged lower during European morning trade on Wednesday, as worries about the strength of global growth drove down prices.
• On the Comex division of the New York Mercantile Exchange, for December delivery traded at $3.025 a pound during European morning hours, down 1.4 cents, or 0.45%.
• A day earlier, copper prices tacked on 0.3 cents, or 0.12%, to settle at $3.039.
Pivot Levels for the Day:
S1
S2
S3
Pivot
R1
R2
R3
Copper
409.8
407.7
402.4
413.0
415.1
418.3
423.6
Aluminum
117.5
116.7
114.8
118.5
119.4
120.4
122.2
Lead
127.1
126.3
124.5
128.2
128.9
130.0
131.9
Nickel
1000.2
987.6
954.1
1021.1
1033.7
1054.6
1088.1
Zinc
142.1
141.5
140.0
142.9
143.6
144.4
145.8
Recommendation:
Copper
Sell below 411
Aluminum
Buy
Lead
Sell
Nickel
Sell
Zinc
Buy
5. 09th Oct’14 Aaj Ka Trend
Energy MCX Crude Oct Hourly Chart:
Technical Views: As mentioned in our previous report prices moved lower exceeding our short term target of 5400 levels. We now remain cautious in selling crude further as RSI has formed positive divergence while prices have made hammer near 5350 levels. Break below 5350 could move prices lower but failure to breach the mentioned level could move prices near 5500/5600 levels. MCX Natural Gas Oct Hourly Chart:
Technical Views: As expected prices moved lower achieving our short term target of 238 levels. Prices have given negative confirmation as prices have broken crucial support of 239 levels and given close below the same. We expect selling opportunity can be generated near 240 levels with 245 as resistance for the test of 230 levels.
6. 09th Oct’14 Aaj Ka Trend
Fundamental News:
• U.S. oil futures droppes to the lowest level since April 2013 on Wednesday, after data showed that U.S. stockpiles rose far more than expected last week.
• On the New York Mercantile Exchange, for delivery in November hit a session low of $86.86 a barrel, a level not seen since April 18, 2013
• Prices recovered to last trade at $87.09 a barrel during U.S. morning hours, down $1.78, or 1.98%.
• A day earlier, Nymex oil futures lost $1.49, or 1.65%, to settle at $88.85, as worries about the strength of global growth drove prices lower.
• U.S. natural gas futures were under pressure during early U.S. trade on Wednesday, as market players monitored near-term weather forecasts to gauge the strength of demand for the fuel ahead of Thursday’s closely-watched supply report.
• On the New York Mercantile Exchange, for delivery in November traded at $3.896 per million British thermal units during U.S. morning hours, down 6.1 cents, or 1.55%.
Pivot Levels for the Day:
S1
S2
S3
Pivot
R1
R2
R3
Crude
5332
5282
5163
5401
5451
5520
5639
Natural Gas
246.0
243.9
238.5
249.3
251.4
254.7
260.1
Recommendation:
Crude
Neutral
Natural Gas
Sell
8. 09th Oct’14 Aaj Ka Trend
This is solely for information of clients of Choice India and does not construe to be an investment advice. It is also not intended as an offer or solicitation for the purchase and sale of any financial instruments. Any action taken by you on the basis of the information contained herein is your responsibility alone and Choice India its subsidiaries or its employees or associates will not be liable in any manner for the consequences of such action taken by you. We have exercised due diligence in checking the correctness and authenticity of the information contained in this recommendation, but Choice India or any of its subsidiaries or associates or employees shall not be in any way responsible for any loss or damage that may arise to any person from any inadvertent error in the information contained in this recommendation or any action taken on basis of this information. Technical analysis studies market psychology, price patterns and volume levels. It is used to forecast future price and market movements. Technical analysis is complementary to fundamental analysis and news sources. The recommendations issued herewith might be contrary to recommendations issued by Choice India in the company research undertaken as the recommendations stated in this report is derived purely from technical analysis. Choice India has based this document on information obtained from sources it believes to be reliable but which it has not independently verified; Choice India makes no guarantee, representation or warranty and accepts no responsibility or liability as to its accuracy or completeness. The opinions contained within the report are based upon publicly available information at the time of publication and are subject to change without notice. The information and any disclosures provided herein are in summary form and have been prepared for informational purposes. The recommendations and suggested price levels are intended purely for trading purposes. The recommendations are valid for the day of the report however trading trends and volumes might vary substantially on an intraday basis and the recommendations may be subject to change. The information and any disclosures provided herein may be considered confidential. Any use, distribution, modification, copying, forwarding or disclosure by any person is strictly prohibited. The information and any disclosures provided herein do not constitute a solicitation or offer to purchase or sell any security or other financial product or instrument. The current performance may be unaudited. Past performance does not guarantee future returns. There can be no assurance that investments will achieve any targeted rates of return, and there is no guarantee against the loss of your entire investment. POTENTIAL CONFLICT OF INTEREST DISCLOSURE (as on date of report) Disclosure of interest statement – • Analyst interest of the stock /Instrument(s): - No. • Firm interest of the stock / Instrument (s): - No.
Disclaimer