1. 17th
Nov’14 Equity Bazaar
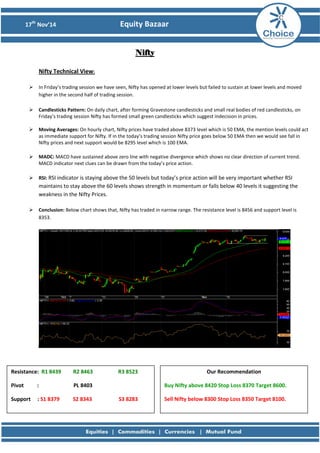
Nifty
Nifty Technical View:
In Friday’s trading session we have seen, Nifty has opened at lower levels but failed to sustain at lower levels and moved
higher in the second half of trading session.
Candlesticks Pattern: On daily chart, after forming Gravestone candlesticks and small real bodies of red candlesticks, on
Friday’s trading session Nifty has formed small green candlesticks which suggest indecision in prices.
Moving Averages: On hourly chart, Nifty prices have traded above 8373 level which is 50 EMA, the mention levels could act
as immediate support for Nifty. If in the today’s trading session Nifty price goes below 50 EMA then we would see fall in
Nifty prices and next support would be 8295 level which is 100 EMA.
MADC: MACD have sustained above zero line with negative divergence which shows no clear direction of current trend.
MACD indicator next clues can be drawn from the today’s price action.
RSI: RSI indicator is staying above the 50 levels but today’s price action will be very important whether RSI
maintains to stay above the 60 levels shows strength in momentum or falls below 40 levels it suggesting the
weakness in the Nifty Prices.
Conclusion: Below chart shows that, Nifty has traded in narrow range. The resistance level is 8456 and support level is
8353.
Resistance: R1 8439 R2 8463 R3 8523
Pivot : PL 8403
Support : S1 8379 S2 8343 S3 8283
Our Recommendation
Buy Nifty above 8420 Stop Loss 8370 Target 8600.
Sell Nifty below 8300 Stop Loss 8350 Target 8100.
2. 17th
Nov’14 Equity Bazaar
Bank Nifty
Bank Nifty Technical View:
In Friday’s trading session, Bank Nifty has bounce from its lower levels and given close near days high.
Candlesticks Pattern: On daily chart, after forming Bearish Engulfing candlesticks pattern, Bank Nifty has formed small
green candlesticks, which shows indecision in price.
Moving Averages: On hourly chart, Bank Nifty prices has closed above 50 EMA (17468) levels, mention levels would act as
immediate support for Bank Nifty, If Bank Nifty prices goes below 50 EMA then prices could fall to 17198 levels which is 100
EMA.
MACD: The MACD on the hourly charts has sustained above zero line and formed negative divergence which is a sideway
confirmation for Bank Nifty prices.
RSI: The momentum indicator, RSI sustained at 60 levels, if in today’s trading session RSI sustains above 60 levels then we
would consider that positive confirmation for Bank Nifty prices to move higher.
Conclusion: Bank Nifty is trading in a broad range with resistance at 17750 levels and support at 17300 levels.
Resistance: R1 17754 R2 17839 R3 18063
Pivot : PL 17615
Support : S1 17530 S2 17391 S3 17167
Our Recommendation
Buy BNF above 17750 Stop Loss 17650 Target: 17900.
Sell BNF below 17400 Stop Loss 17500 Target: 17100.
3. 17th
Nov’14 Equity Bazaar
Stock of the Day
Tata Steel View:
After short consolidation, we have seen Tata Steel has given downtrend line breakout and sustain above the
crucial resistance of 474 levels.
Candlesticks Pattern: On daily chart, we have seen Tata Steel has formed large green candle which gives positive
confirmation for prices.
Moving Average: On hourly chart we have seen that Tata Steel prices are trading above 50 EMA (475 levels), mention level
could act as immediate support.
MACD: The MACD on the hourly charts has given cross over signal and sustain above the zero line, which indicates that the
current trend is strong.
RSI: On hourly chart RSI have managed near 60 levels, if in today’s trading session RSI will sustain above 60 levels then it will
sign as strong momentum for stock.
Conclusion: If Tata Steel trade above 483 levels then prices could bounce towards 495 and 515 levels.
Resistance: R1 484 R2 491 R3 507
Pivot : PL 475
Support : S1 469 S2 460 S3 444
Our Recommendation
Buy Tata Steel above 483 Stop Loss 472 Target: 502
4. 17th
Nov’14 Equity Bazaar
Derivative Analysis
FIIS Data: FII’s are net Rs 645.9 Cr Buyers on 14
th
November 2014 and Dll’s are the net Rs 517.51 Cr Sellers on
14
th
November 2014.
Option Data: 8500 CE has the highest OI with 57 lakhs and 8400 CE has the second highest OI with 51 lakhs and
8300 PE has the highest OI with 59 lakhs and 8200 PE has the second highest OI with 53 lakhs.
Open Interest: The above options data shows that nifty has strong support at 8000 and has resistance at 8500.
The change in level will take place once when NIFTY prices breaks 8300 mark.
Intraday Option Strategy: (A) Buy Nifty 8300 calls and Sell Nifty 8400 puts if buy level is breached.
(B) Sell Nifty 8400 calls and Buy Nifty 8300 puts if sell level is breached.
5. 17th
Nov’14 Equity Bazaar
Symbol S3 S2 S1 P R1 R2 R3 Trend Action
ACC 1463.62 1485.62 1498.23 1507.62 1520.23 1529.62 1551.62 UP Buy
AMBUJACEM 214.78 221.53 225.82 228.2833 232.57 235.03 241.78 UP Buy
ASIANPAINT 599.12 631.07 651.63 663.0167 683.58 694.97 726.92 UP Buy
AXISBANK 457.33 466.53 471.72 475.7333 480.92 484.93 494.13 UP Buy
BAJAJ-AUTO 2539.53 2591.18 2622.02 2642.833 2673.67 2694.48 2746.13 UP Buy
BANKBARODA 963.10 986.20 1000.50 1009.3 1023.60 1032.40 1055.50 UP Buy
BHEL 218.30 230.95 238.40 243.6 251.05 256.25 268.90 UP Buy
BPCL 690.78 711.68 723.27 732.5833 744.17 753.48 774.38 UP Buy
BHARTIARTL 375.28 382.58 385.47 389.8833 392.77 397.18 404.48 Down Sell
CAIRN 244.42 254.77 261.23 265.1167 271.58 275.47 285.82 UP Buy
CIPLA 569.70 592.50 600.85 615.3 623.65 638.10 660.90 Down Sell
COALINDIA 326.60 339.90 348.10 353.2 361.40 366.50 379.80 UP Buy
DLF 134.18 137.93 140.12 141.6833 143.87 145.43 149.18 UP Buy
DRREDDY 3294.52 3367.02 3401.03 3439.517 3473.53 3512.02 3584.52 Down Sell
GAIL 442.60 463.70 476.70 484.8 497.80 505.90 527.00 UP Buy
GRASIM 3448.30 3515.20 3542.30 3582.1 3609.20 3649.00 3715.90 Down Sell
HCLTECH 1534.23 1578.23 1594.47 1622.233 1638.47 1666.23 1710.23 Down Sell
HDFCBANK 882.45 903.70 916.90 924.95 938.15 946.20 967.45 UP Buy
HEROMOTOCO 2832.37 2894.27 2929.33 2956.167 2991.23 3018.07 3079.97 UP Buy
HINDALCO 140.23 147.93 152.62 155.6333 160.32 163.33 171.03 UP Buy
HINDUNILVR 737.08 747.48 751.82 757.8833 762.22 768.28 778.68 Down Sell
HDFC 1060.83 1091.28 1109.07 1121.733 1139.52 1152.18 1182.63 UP Buy
ITC 362.47 365.77 367.48 369.0667 370.78 372.37 375.67 UP Buy
ICICIBANK 1664.57 1678.37 1685.33 1692.167 1699.13 1705.97 1719.77 UP Buy
IDFC 148.83 151.78 153.22 154.7333 156.17 157.68 160.63 Down Sell
INDUSINDBK 694.55 710.65 720.60 726.75 736.70 742.85 758.95 UP Buy
INFY 4117.47 4154.92 4173.28 4192.367 4210.73 4229.82 4267.27 Down Sell
JINDALSTEL 141.13 148.98 153.77 156.8333 161.62 164.68 172.53 UP Buy
KOTAKBANK 1044.37 1070.97 1082.23 1097.567 1108.83 1124.17 1150.77 Down Sell
LT 1573.38 1597.28 1609.47 1621.183 1633.37 1645.08 1668.98 UP Buy
LUPIN 1395.90 1419.65 1431.80 1443.4 1455.55 1467.15 1490.90 UP Buy
M&M 1224.62 1239.02 1247.43 1253.417 1261.83 1267.82 1282.22 UP Buy
MARUTI 3283.88 3307.58 3318.57 3331.283 3342.27 3354.98 3378.68 Down Sell
NMDC 144.37 149.22 152.03 154.0667 156.88 158.92 163.77 UP Buy
NTPC 135.15 138.80 140.95 142.45 144.60 146.10 149.75 UP Buy
ONGC 371.82 381.42 387.33 391.0167 396.93 400.62 410.22 UP Buy
POWERGRID 138.53 141.43 142.77 144.3333 145.67 147.23 150.13 Down Sell
PNB 900.77 921.37 929.98 941.9667 950.58 962.57 983.17 Down Sell
RELIANCE 945.25 957.95 963.55 970.65 976.25 983.35 996.05 Down Sell
SSLT 218.52 228.52 234.33 238.5167 244.33 248.52 258.52 UP Buy
SBIN 2597.78 2684.68 2736.27 2771.583 2823.17 2858.48 2945.38 UP Buy
SUNPHARMA 819.60 857.25 872.00 894.9 909.65 932.55 970.20 Down Sell
TCS 2525.23 2561.38 2583.92 2597.533 2620.07 2633.68 2669.83 UP Buy
TATAMOTORS 492.48 509.63 516.77 526.7833 533.92 543.93 561.08 Down Sell
TATAPOWER 79.58 83.73 86.27 87.88333 90.42 92.03 96.18 UP Buy
TATASTEEL 444.72 460.32 469.23 475.9167 484.83 491.52 507.12 UP Buy
TECHM 2540.53 2593.73 2615.87 2646.933 2669.07 2700.13 2753.33 Down Sell
ULTRACEMCO 2499.67 2552.67 2584.33 2605.667 2637.33 2658.67 2711.67 UP Buy
WIPRO 549.60 556.90 560.40 564.2 567.70 571.50 578.80 Down Sell
ZEEL 356.92 366.02 371.08 375.1167 380.18 384.22 393.32 UP Buy
7. 17th
Nov’14 Equity Bazaar
Disclaimer
This is solely for information of clients of Choice Broking and does not construe to be an investment
advice. It is also not intended as an offer or solicitation for the purchase and sale of any financial
instruments. Any action taken by you on the basis of the information contained herein is your
responsibility alone and Choice Broking its subsidiaries or its employees or associates will not be liable in
any manner for the consequences of such action taken by you. We have exercised due diligence in
checking the correctness and authenticity of the information contained in this recommendation, but
Choice Broking or any of its subsidiaries or associates or employees shall not be in any way responsible
for any loss or damage that may arise to any person from any inadvertent error in the information
contained in this recommendation or any action taken on basis of this information. Technical analysis
studies market psychology, price patterns and volume levels. It is used to forecast future price and
market movements. Technical analysis is complementary to fundamental analysis and news sources.
The recommendations issued herewith might be contrary to recommendations issued by Choice Broking
in the company research undertaken as the recommendations stated in this report is derived purely from
technical analysis. Choice Broking has based this document on information obtained from sources it
believes to be reliable but which it has not independently verified; Choice Broking makes no guarantee,
representation or warranty and accepts no responsibility or liability as to its accuracy or completeness.
The opinions contained within the report are based upon publicly available information at the time of
publication and are subject to change without notice. The information and any disclosures provided
herein are in summary form and have been prepared for informational purposes. The recommendations
and suggested price levels are intended purely for trading purposes. The recommendations are valid for
the day of the report however trading trends and volumes might vary substantially on an intraday basis
and the recommendations may be subject to change. The information and any disclosures provided
herein may be considered confidential. Any use, distribution, modification, copying, forwarding or
disclosure by any person is strictly prohibited. The information and any disclosures provided herein do
not constitute a solicitation or offer to purchase or sell any security or other financial product or
instrument. The current performance may be unaudited. Past performance does not guarantee future
returns. There can be no assurance that investments will achieve any targeted rates of return, and there
is no guarantee against the loss of your entire investment.
POTENTIAL CONFLICT OF INTEREST DISCLOSURE (as on date of report) Disclosure of interest statement –
• Analyst interest of the stock /Instrument(s): - No. • Firm interest of the stock / Instrument (s): - No.