1. 28th Oct’14 Aaj Ka Trend
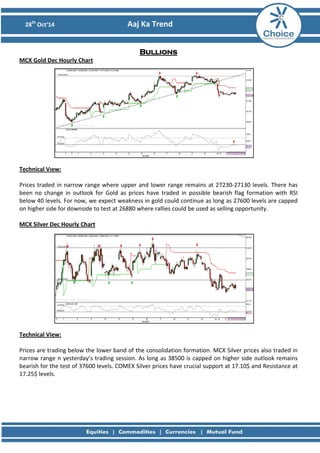
Bullions MCX Gold Dec Hourly Chart
Technical View: Prices traded in narrow range where upper and lower range remains at 27230-27130 levels. There has been no change in outlook for Gold as prices have traded in possible bearish flag formation with RSI below 40 levels. For now, we expect weakness in gold could continue as long as 27600 levels are capped on higher side for downside to test at 26880 where rallies could be used as selling opportunity. MCX Silver Dec Hourly Chart
Technical View: Prices are trading below the lower band of the consolidation formation. MCX Silver prices also traded in narrow range n yesterday’s trading session. As long as 38500 is capped on higher side outlook remains bearish for the test of 37600 levels. COMEX Silver prices have crucial support at 17.10$ and Resistance at 17.25$ levels.
2. 28th Oct’14 Aaj Ka Trend
Fundamental News:
• Gold prices edged lower on Monday, amid expectations the Federal Reserve will end its bond- buying program later this week.
• On the Comex division of the New York Mercantile Exchange, gold futures for December delivery traded at $1,228.80 a troy ounce during European morning hours, down $3.00, or 0.24%.
• Futures were likely to find support at $1,222.00, the low from October 15, and resistance at $1,255.60, the high from October 21.
Pivot Levels for the Day:
S1
S2
S3
Pivot
R1
R2
R3
Gold
27150
27086
26978
27194
27258
27302
27410
Silver
37983
37822
37547
38097
38258
38372
38647
Recommendation:
Gold
Sell
Silver
Sell
3. 28th Oct’14 Aaj Ka Trend
Base Metals MCX Copper Nov Hourly Chart
Technical Views: Initially prices moved lower but failed to sustain at lower levels and moved higher. The momentum indicator, RSI has also moved above 60 levels. Prices could resist near 78.6% retracement level of the previous down move. However, move above 418.20 could head prices towards 421/423 levels. Failure to breach the level could drift prices lower near 414/411 levels.
MCX Aluminum Oct Hourly Chart
MCX Lead Oct Hourly Chart
MCX Nickel Oct Hourly Chart
MCX Zinc Oct Hourly Chart
4. 28th Oct’14 Aaj Ka Trend
Fundamental News:
• Copper futures inch higher after ECB stress test results. • Copper prices inched higher on Monday, after the results of stress tests on Europe’s largest banks released over the weekend painted a brighter picture than some investors had expected.
• On the Comex division of the New York Mercantile Exchange, copper for December delivery traded at $3.045 a pound during European morning hours, up 0.4 cents, or 0.12%.
Pivot Levels for the Day:
S1
S2
S3
Pivot
R1
R2
R3
Copper
412.6
408.4
401.5
415.2
419.4
422.1
428.9
Aluminum
120.3
119.2
117.5
121.0
122.1
122.7
124.5
Lead
121.8
120.4
118.2
122.7
124.1
124.9
127.2
Nickel
900.0
892.0
876.9
907.1
915.1
922.2
937.3
Zinc
137.6
136.7
135.1
138.2
139.2
139.8
141.3
Recommendation:
Copper
Buy above 418.20
Aluminum
Sell
Lead
Sell
Nickel
Sell
Zinc
Neutral
5. 28th Oct’14 Aaj Ka Trend
Energy MCX Crude Nov Hourly Chart:
Technical Views: Prices have broken the crucial support and drifted lower achieving our target of 4900 levels and bounced back above the center band of the Bollinger band. We would wait for the momentum to move above 60 levels which would confirm the bullish bias. For now, 5020 could act as crucial resistance above which prices can head higher towards 5100/5175 levels while break below 4900 would negate our bullish outlook. MCX Natural Gas Oct Hourly Chart:
Technical Views: As mentioned prices unable to move above 225 and drifted lower almost achieving the short term target. However, possible double bottom formation with positive divergence on the momentum indicator, RSI would suggest strength in prices. For now, as long as previous intermediate low of 217 is protected, prices can head higher towards 223/225 levels.
6. 28th Oct’14 Aaj Ka Trend
Fundamental News:
• WTI crude tumbles below $80 following Goldman downgrade.
• West Texas Intermediate oil futures plunged below the key $80-a-barrel level on Monday, after Goldman Sachs slashed its 2015 price forecast, citing rising global supplies
• On the New York Mercantile Exchange, crude oil for delivery in December traded at $79.77 a barrel during U.S. morning hours, down $1.24, or 1.53%
• Natural gas falls as weather forecasts point to mild U.S. temperatures.
• Natural gas prices moved lower on Monday after updated weather-forecasting models continued to call for mild temperatures across much of the U.S., which should curb demand for both heating and air conditioning.
• On the New York Mercantile Exchange, natural gas futures for delivery in December were down 1.33% at $3.649 per million British thermal units during U.S. trading. The commodity hit a session low of $3.623, and a high of $3.720.
Pivot Levels for the Day:
S1
S2
S3
Pivot
R1
R2
R3
Crude
4918
4857
4755
4959
5020
5061
5163
Natural Gas
216.50
213.80
207.30
220.30
223.00
226.80
233.30
Recommendation:
Crude
Buy above 5020
Natural Gas
Buy
8. 28th Oct’14 Aaj Ka Trend
This is solely for information of clients of Choice India and does not construe to be an investment advice. It is also not intended as an offer or solicitation for the purchase and sale of any financial instruments. Any action taken by you on the basis of the information contained herein is your responsibility alone and Choice India its subsidiaries or its employees or associates will not be liable in any manner for the consequences of such action taken by you. We have exercised due diligence in checking the correctness and authenticity of the information contained in this recommendation, but Choice India or any of its subsidiaries or associates or employees shall not be in any way responsible for any loss or damage that may arise to any person from any inadvertent error in the information contained in this recommendation or any action taken on basis of this information. Technical analysis studies market psychology, price patterns and volume levels. It is used to forecast future price and market movements. Technical analysis is complementary to fundamental analysis and news sources. The recommendations issued herewith might be contrary to recommendations issued by Choice India in the company research undertaken as the recommendations stated in this report is derived purely from technical analysis. Choice India has based this document on information obtained from sources it believes to be reliable but which it has not independently verified; Choice India makes no guarantee, representation or warranty and accepts no responsibility or liability as to its accuracy or completeness. The opinions contained within the report are based upon publicly available information at the time of publication and are subject to change without notice. The information and any disclosures provided herein are in summary form and have been prepared for informational purposes. The recommendations and suggested price levels are intended purely for trading purposes. The recommendations are valid for the day of the report however trading trends and volumes might vary substantially on an intraday basis and the recommendations may be subject to change. The information and any disclosures provided herein may be considered confidential. Any use, distribution, modification, copying, forwarding or disclosure by any person is strictly prohibited. The information and any disclosures provided herein do not constitute a solicitation or offer to purchase or sell any security or other financial product or instrument. The current performance may be unaudited. Past performance does not guarantee future returns. There can be no assurance that investments will achieve any targeted rates of return, and there is no guarantee against the loss of your entire investment. POTENTIAL CONFLICT OF INTEREST DISCLOSURE (as on date of report) Disclosure of interest statement – • Analyst interest of the stock /Instrument(s): - No. • Firm interest of the stock / Instrument (s): - No.
Disclaimer