
Recommended
More Related Content
What's hot
What's hot (20)
Viewers also liked
Viewers also liked (20)
Similar to MCX Gold breaks out, may rise to Rs 31650
Similar to MCX Gold breaks out, may rise to Rs 31650 (20)
Recently uploaded
Recently uploaded (20)
MCX Gold breaks out, may rise to Rs 31650
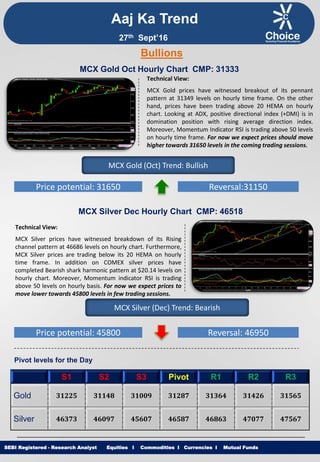
- 1. Equities I Commodities I Currencies I Mutual Funds Aaj Ka Trend Technical View: MCX Gold prices have witnessed breakout of its pennant pattern at 31349 levels on hourly time frame. On the other hand, prices have been trading above 20 HEMA on hourly chart. Looking at ADX, positive directional index (+DMI) is in domination position with rising average direction index. Moreover, Momentum Indicator RSI is trading above 50 levels on hourly time frame. For now we expect prices should move higher towards 31650 levels in the coming trading sessions. SEBI Registered - Research Analyst Equities I Commodities I Currencies I Mutual Funds Bullions MCX Gold Oct Hourly Chart CMP: 31333 MCX Gold (Oct) Trend: Bullish Price potential: 31650 Reversal:31150 MCX Silver Dec Hourly Chart CMP: 46518 Technical View: MCX Silver prices have witnessed breakdown of its Rising channel pattern at 46686 levels on hourly chart. Furthermore, MCX Silver prices are trading below its 20 HEMA on hourly time frame. In addition on COMEX silver prices have completed Bearish shark harmonic pattern at $20.14 levels on hourly chart. Moreover, Momentum indicator RSI is trading above 50 levels on hourly basis. For now we expect prices to move lower towards 45800 levels in few trading sessions. MCX Silver (Dec) Trend: Bearish Price potential: 45800 Reversal: 46950 Pivot levels for the Day S1 S2 S3 Pivot R1 R2 R3 Gold 31225 31148 31009 31287 31364 31426 31565 Silver 46373 46097 45607 46587 46863 47077 47567 27th Sept’16
- 2. Equities I Commodities I Currencies I Mutual Funds Technical View: On hourly chart MCX Copper has witnessed breakout of Rectangle at 325.70 levels on hourly time frame. Furthermore, Counter is trading above its 50 HEMA on hourly chart. Moreover, momentum indicator MACD has observed positive crossover on hourly time frame. In addition, Momentum indicator RSI is trading above 60 levels on Daily basis. For now we expect prices to move higher towards 334.50 levels in coming trading sessions. SEBI Registered - Research Analyst Equities I Commodities I Currencies I Mutual Funds MCX Copper Nov hourly Chart CMP: 326.70 MCX Copper (Nov) Trend: Bullish Price potential: 334.50 Reversal: 321.50 MCX Crude Oil Oct. Hourly Chart CMP: 3080 Technical View: MCX Crude Oil prices witnessed breakout of its consolidation range at 3040 levels on hourly time frame. Furthermore, Counter is trading above its 20 HEMA on hourly chart. Looking at ADX, positive directional index (+DMI) is in domination position with rising average direction index. Moreover, Momentum indicator RSI is trading above 50 levels on hourly basis. For now we expect prices to move higher towards 3135 levels in coming trading sessions. MCX Crude Oil (Oct) Trend: Bullish Price potential: 3135 Reversal: 3010 Pivot levels for the Day S1 S2 S3 Pivot R1 R2 R3 Copper 325.1 323.7 321.0 326.3 327.8 329.0 331.6 Crude 3003 2936 2826 3046 3113 3156 3266 Base Metal Energy Aaj Ka Trend 27th Sept’16
- 3. Equities I Commodities I Currencies I Mutual FundsSEBI Registered - Research Analyst Equities I Commodities I Currencies I Mutual Funds Other Base Metals & Energy S1 S2 S3 Pivot R1 R2 R3 Trend Copper 325.1 323.7 321.0 326.3 327.8 329.0 331.6 Aluminum 108.3 106.9 104.6 109.3 110.7 111.6 114.0 Lead 127.4 125.7 123.1 128.2 129.9 130.8 133.3 Nickel 691.7 686.1 673.8 698.4 704.0 710.7 723.0 Zinc 150.2 148.6 146.1 151.1 152.7 153.6 156.1 Natural Gas 197.3 194.8 190.5 199.1 201.6 203.4 207.7 Fundamental News: Gold prices wobbled during Europe's session on Monday, but held near a two-week high, as investors squared positions ahead of Monday night's U.S. presidential debate between Donald Trump and Hillary Clinton. Gold fell in Asia on Monday, giving up early gains, with a busy week of central bank remarks ahead and what is expected to be a record audience for the first debate between the top two contenders for the U.S. presidency. Gold prices swung between small gains and losses during North America's session on Monday, remaining near a two-week high as investors' attention turned from central banks to American politics ahead of the first U.S. presidential debate. Oil prices rallied in volatile trade during North American hours on Monday, amid hopes global oil producers will make progress on a deal to limit production at a meeting later this week. Oil rallied on Monday as the world's largest producers gathered in Algeria to discuss ways to support the market, with nervous trade driving volatility to its highest since exporters met in April. Russian oil majors Rosneft and Gazprom Neft are raising the share of production from hard-to-recover reserves, to counter declining conventional output, showing the complexities facing producer nations seeking to tackle a global oversupply of crude. Iran downplayed on Monday the chances of OPEC and non-OPEC oil producers clinching an output-restraint deal in Algeria this week even though several other members of the group said they still hoped for steps to tackle a price-eroding glut of crude. U.S. natural gas futures rose for the first time in three sessions on Monday, climbing back towards the highest level since January 2015 amid forecasts for unusually warm temperatures across most parts of the continental U.S. in the days ahead. Aaj Ka Trend 27th Sept’16
- 4. Equities I Commodities I Currencies I Mutual FundsSEBI Registered - Research Analyst Equities I Commodities I Currencies I Mutual Funds International Market Commodity Closing Price Gold 1339.25 Silver 19.48 Crude Oil 45.25 Brent Crude Oil 47.88 Natural Gas 3.07 COMEX/NYMEX/ICE ( Precious Metals & Energy) Currency & Commodity Index Currency (Spot) Current Price USD / INR 66.61 Dollar Index 95.26 EUR / USD 1.12 CRB Index* 184.98 Closing as on 26.09.16 *Closing as on 26.09.16 LME (Base Metals) ( $ per tones) Commodity Closing Price Copper 4880 Aluminum 1661 Zinc 2289 Lead 1947 Nickel 10530 SHFE (Base Metals) (Yuan per tones) Commodity Closing Price Copper 37470 Aluminum 12460 Zinc 17250 Lead 13650 Closing as on 26.09.16 Closing as on 26.09.16 LME INVENTORY DATA Aaj Ka Trend 20-Sept-16 21-Sept-16 22-Sept-16 23-Sept-16 26-Sept-16 Aluminium -6700 -6600 -8150 -6700 -10701 Copper -1675 -150 -1750 10825 7252 Lead 875 2200 -200 -25 250 Nickel -1075 -1002 120 -1686 -854 Zinc -50 -250 -300 -1200 -648 27th Sept’16
- 5. Equities I Commodities I Currencies I Mutual Funds This is solely for information of clients of Choice Broking and does not construe to be an investment advice. It is also not intended as an offer or solicitation for the purchase and sale of any financial instruments. Any action taken by you on the basis of the information contained herein is your responsibility alone and Choice Broking its subsidiaries or its employees or associates will not be liable in any manner for the consequences of such action taken by you. We have exercised due diligence in checking the correctness and authenticity of the information contained in this recommendation, but Choice Broking or any of its subsidiaries or associates or employees shall not be in any way responsible for any loss or damage that may arise to any person from any inadvertent error in the information contained in this recommendation or any action taken on basis of this information. Technical analysis studies market psychology, price patterns and volume levels. It is used to forecast future price and market movements. Technical analysis is complementary to fundamental analysis and news sources. The recommendations issued herewith might be contrary to recommendations issued by Choice Broking in the company research undertaken as the recommendations stated in this report is derived purely from technical analysis. Choice Broking has based this document on information obtained from sources it believes to be reliable but which it has not independently verified; Choice Broking makes no guarantee, representation or warranty and accepts no responsibility or liability as to its accuracy or completeness. The opinions contained within the report are based upon publicly available information at the time of publication and are subject to change without notice. The information and any disclosures provided herein are in summary form and have been prepared for informational purposes. The recommendations and suggested price levels are intended purely for trading purposes. The recommendations are valid for the day of the report however trading trends and volumes might vary substantially on an intraday basis and the recommendations may be subject to change. The information and any disclosures provided herein may be considered confidential. Any use, distribution, modification, copying, forwarding or disclosure by any person is strictly prohibited. The information and any disclosures provided herein do not constitute a solicitation or offer to purchase or sell any security or other financial product or instrument. The current performance may be unaudited. Past performance does not guarantee future returns. There can be no assurance that investments will achieve any targeted rates of return, and there is no guarantee against the loss of your entire investment. POTENTIAL CONFLICT OF INTEREST DISCLOSURE (as on date of report) Disclosure of interest statement – • Analyst interest of the stock /Instrument(s): - No. • Firm interest of the stock / Instrument (s): - No. Disclaimer Contact Us Amit Pathania Research Associate amit.pathania@choiceindia.com Rohan Patil Research Associate rohan.patil@choiceindia.com www.choicebroking.incustomercare@choiceindia.com SEBI Registered - Research Analyst Equities I Commodities I Currencies I Mutual Funds Aaj Ka Trend 27th Sept’16 Neeraj Yadav Research Advisor neeraj.yadav@choiceindia.com Anish Vyas Senior Research Associate anish.vyas@choiceindia.com Amit Pathania Digitally signed by Amit Pathania DN: cn=Amit Pathania, o=Choice Equity Broking Pvt. ltd, ou=Research Department, email=amit.pathania@choiceindia.com, c=IN Date: 2016.09.27 08:38:20 +05'30'