QNBFS Daily Technical Trader - Qatar for February 22, 2018 التحليل الفني اليو...
Currency highlights 31.10.14
1. 31st Oct’14 Currency Highlights
USDINR
USDINR Technical View:
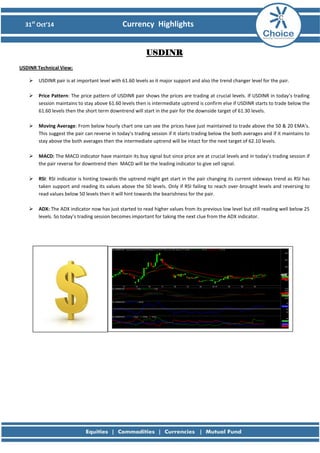
USDINR pair is at important level with 61.60 levels as it major support and also the trend changer level for the pair.
Price Pattern: The price pattern of USDINR pair shows the prices are trading at crucial levels. If USDINR in today’s trading session maintains to stay above 61.60 levels then is intermediate uptrend is confirm else if USDINR starts to trade below the 61.60 levels then the short term downtrend will start in the pair for the downside target of 61.30 levels.
Moving Average: From below hourly chart one can see the prices have just maintained to trade above the 50 & 20 EMA’s. This suggest the pair can reverse in today’s trading session if it starts trading below the both averages and if it maintains to stay above the both averages then the intermediate uptrend will be intact for the next target of 62.10 levels.
MACD: The MACD indicator have maintain its buy signal but since price are at crucial levels and in today’s trading session if the pair reverse for downtrend then MACD will be the leading indicator to give sell signal.
RSI: RSI indicator is hinting towards the uptrend might get start in the pair changing its current sideways trend as RSI has taken support and reading its values above the 50 levels. Only if RSI failing to reach over-brought levels and reversing to read values below 50 levels then it will hint towards the bearishness for the pair.
ADX: The ADX indicator now has just started to read higher values from its previous low level but still reading well below 25 levels. So today’s trading session becomes important for taking the next clue from the ADX indicator.
2. 31st Oct’14 Currency Highlights
Economic Indicators Date Time Data Prior Expected Impact
31.10.14
06:00 PM Core PCE Price Index m/m
0.1%
0.1%
Actual > Expected=Good for USD
31.10.14
06:00 PM Employment Cost Index q/q
0.7%
0.6%
66
Actual > Expected=Good for USD
31.10.14
06:00 PM Personal Spending m/m 0.5% 0.2%
Actual > Expected=Good for USD
31.10.14
06:00 PM Personal Income m/m 0.3% 0.3%
Actual > Expected=Good for USD
31.10.14
07:15 PM Chicago PMI 60.5 60.2
Actual > Expected=Good for USD
31.10.14
07:25 PM Revised UoM Consumer Sentiment 86.4 86.4
Actual > Expected=Good for USD
31.10.14
07:25 PM Revised UoM Inflation Expectations 2.8%
Actual > Expected=Good for USD
3. 31st Oct’14 Currency Highlights
EURINR
EURINR Technical View:
Finally, EURINR failed to reverse for a uptrend and resumes its previous downtrend.
Price Pattern: EURINR open gap down in yesterday’s trading session resuming its previous downtrend. The price pattern for the pair look very bearish and if USDINR reverse for a downtrend then EURINR prices will observe a secular downtrend making new lows.
Moving Average: The below chart clearly shows the how the prices have traded and closed below the both averages. This says intermediate downtrend will continue for the pair till there is no major price pattern reversal for uptrend.
MACD: MACD indicator reverse to give sell signal as the intermediate downtrend resume for the pair. So it will better to ignore any buy signal generated by the indicator till the intermediate downtrend does not reverse for a uptrend.
RSI: With the gap down opening, RSI went to read at the oversold region suggesting the momentum to remain weak till the pair does not reverse for intermediate uptrend.
ADX: With the resumption of downtrend, ADX finally started reading values above the 25 levels suggesting the trending phase have started for the pair. So the pair will observe a higher volatility and larger price range in the coming trading session.
4. 31st Oct’14 Currency Highlights
Economic Indicators Date Time Data Prior Expected Impact
31.10.14
12:30 PM German Retail Sales m/m
2.5%
-0.8%
Actual > Expected=Good for EUR
31.10.14
01:15 PM French Consumer Spending m/m
0.7%
-0.3%
Actual > Expected=Good for EUR
31.10.14
02:30 PM Italian Monthly Unemployment Rate
12.3%
12.4%
Actual > Expected=Good for EUR
31.10.14
03:30 PM CPI Flash Estimate y/y
0.3%
0.4%
Actual > Expected=Good for EUR
31.10.14
03:30 PM Core CPI Flash Estimate y/y
0.8%
0.8%
Actual > Expected=Good for EUR
31.10.14
03:30 PM Unemployment Rate
0.7%
0.6%
Actual > Expected=Good for EUR
31.10.14
03:30 PM Italian Prelim CPI m/m
-0.3%
-0.1%
Actual > Expected=Good for EUR
5. 31st Oct’14 Currency Highlights
GBPINR
GBPINR Technical View:
Like EURINR, GBPINR also finally made a breakout for downtrend and the pair will be sell on rise
Price Pattern: GBPINR finally made a breakout for downtrend from its sideways trend. The price pattern for the pair looks very bearish till GBPINR do not fills its upside gap.
Moving Average: From the below hourly chart one can clearly see that there is negative crossover of both the averages making the pair very bearish. So GBPINR will be sell on rise till there is no positive crossover of both the averages.
MACD: MACD has generated sell signal on the below hourly chart and this sell signal will remain intact till prices do not reverse for uptrend.
RSI: Momentum indicator RSI has gained some strength as is reading above the oversold region but still below the mid- range level 50 which tells the pair intermediate trend to remain bearish till RSI do not starts reading above the mid-range level 50.
ADX: ADX indicator has also reading values for the trending phase suggesting the pair will move in larger range for intraday. So traders can get a larger price range to trade the pair as ADX in coming trading session reads at higher values.
Economic Indicators Date Time Data Prior Expected Impact
31.10.14
05:35 AM GfK Consumer Confidence
-1
-1
Actual > Expected=Good for GBP
6. 31st Oct’14 Currency Highlights
JPYINR
JPYINR Technical View:
JPYINR pair continues to trade for a bear market with selling observed in the EURINR & GBPINR pair.
Price Pattern: JPYINR price pattern continues to remain bearish showing no sign of reversal. Also with downtrend in above currencies pair is putting pressure on the JPYINR prices and If USDINR resumes for a downtrend the JPYINR will be the weakest currency pair.
Moving Average: The below hourly chart shows prices continues to trades below the 50 & 20 EMA suggesting the trend remains weak till prices do not start trading above the both averages.
MACD: MACD indicator continues its sell signal with continuation of the downtrend. So again MACD indicator if reverse to give a buy signal it will be better to ignore but a new sell signal can be taken as the intermediate trend is down.
RSI: RSI indicator continues to read below the mid-range level 50 suggesting the momentum remain weak till RSI do starts reading above the mid-range level 50. Here if RSI is facing a resistance at 50 levels providing us an opportunity to sell the pair on rise.
ADX: ADX indicator continues to show the trending phase for the pair as it is reading well above the 20 levels. With ADX reading above the 25 levels hinting the trending phase will make the pair to trade at lower values with larger price range.
7. 31st Oct’14 Currency Highlights
Economic Indicators Date Time Data Prior Expected Impact
31.10.14
05:00 AM Household Spending y/y
-4.7%
-4.0%
Actual > Expected=Good for JPY
31.10.14
05:00 AM Tokyo Core CPI y/y
2.6%
2.5%
Actual > Expected=Good for JPY
31.10.14
05:00 AM National Core CPI y/y
3.1%
3.0%
Actual > Expected=Good for JPY
31.10.14
05:00 AM Unemployment Rate
3.5%
3.6%
Actual > Expected=Good for JPY
31.10.14
06:00 AM Monetary Policy Statement
More Hawkish=Good for JPY
31.10.14
10:30 AM Housing Starts y/y
-12.5%
-17.1%
Actual > Expected=Good for JPY
31.10.14
11:30 AM BOJ Outlook Report
More Hawkish=Good for JPY
31.10.14
11:30 AM BOJ Press Conference
More Hawkish=Good for JPY
9. 31st Oct’14 Currency Highlights
Disclaimer
This is solely for information of clients of Choice India and does not construe to be an investment advice. It is also not intended as an offer or solicitation for the purchase and sale of any financial instruments. Any action taken by you on the basis of the information contained herein is your responsibility alone and Choice India its subsidiaries or its employees or associates will not be liable in any manner for the consequences of such action taken by you. We have exercised due diligence in checking the correctness and authenticity of the information contained in this recommendation, but Choice India or any of its subsidiaries or associates or employees shall not be in any way responsible for any loss or damage that may arise to any person from any inadvertent error in the information contained in this recommendation or any action taken on basis of this information. Technical analysis studies market psychology, price patterns and volume levels. It is used to forecast future price and market movements. Technical analysis is complementary to fundamental analysis and news sources. The recommendations issued herewith might be contrary to recommendations issued by Choice India in the company research undertaken as the recommendations stated in this report is derived purely from technical analysis. Choice India has based this document on information obtained from sources it believes to be reliable but which it has not independently verified; Choice India makes no guarantee, representation or warranty and accepts no responsibility or liability as to its accuracy or completeness. The opinions contained within the report are based upon publicly available information at the time of publication and are subject to change without notice. The information and any disclosures provided herein are in summary form and have been prepared for informational purposes. The recommendations and suggested price levels are intended purely for trading purposes. The recommendations are valid for the day of the report however trading trends and volumes might vary substantially on an intraday basis and the recommendations may be subject to change. The information and any disclosures provided herein may be considered confidential. Any use, distribution, modification, copying, forwarding or disclosure by any person is strictly prohibited. The information and any disclosures provided herein do not constitute a solicitation or offer to purchase or sell any security or other financial product or instrument. The current performance may be unaudited. Past performance does not guarantee future returns. There can be no assurance that investments will achieve any targeted rates of return, and there is no guarantee against the loss of your entire investment.
POTENTIAL CONFLICT OF INTEREST DISCLOSURE (as on date of report) Disclosure of interest statement – • Analyst interest of the stock /Instrument(s): - No. • Firm interest of the stock / Instrument (s): - No.