
Recommended
More Related Content
What's hot
What's hot (20)
Viewers also liked
Viewers also liked (20)
Similar to Aaj ka trend 29.11.16
Similar to Aaj ka trend 29.11.16 (20)
Recently uploaded
Recently uploaded (20)
Aaj ka trend 29.11.16
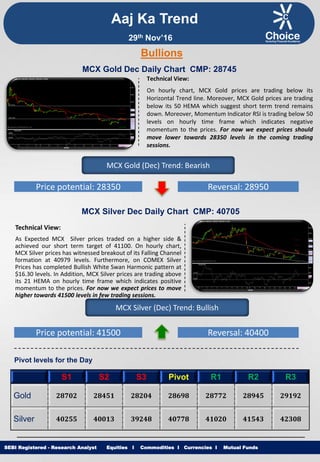
- 1. Equities I Commodities I Currencies I Mutual Funds Aaj Ka Trend Technical View: On hourly chart, MCX Gold prices are trading below its Horizontal Trend line. Moreover, MCX Gold prices are trading below its 50 HEMA which suggest short term trend remains down. Moreover, Momentum Indicator RSI is trading below 50 levels on hourly time frame which indicates negative momentum to the prices. For now we expect prices should move lower towards 28350 levels in the coming trading sessions. SEBI Registered - Research Analyst Equities I Commodities I Currencies I Mutual Funds Bullions MCX Gold Dec Daily Chart CMP: 28745 MCX Gold (Dec) Trend: Bearish Price potential: 28350 Reversal: 28950 MCX Silver Dec Daily Chart CMP: 40705 Technical View: As Expected MCX Silver prices traded on a higher side & achieved our short term target of 41100. On hourly chart, MCX Silver prices has witnessed breakout of its Falling Channel formation at 40979 levels. Furthermore, on COMEX Silver Prices has completed Bullish White Swan Harmonic pattern at $16.30 levels. In Addition, MCX Silver prices are trading above its 21 HEMA on hourly time frame which indicates positive momentum to the prices. For now we expect prices to move higher towards 41500 levels in few trading sessions. MCX Silver (Dec) Trend: Bullish Price potential: 41500 Reversal: 40400 Pivot levels for the Day S1 S2 S3 Pivot R1 R2 R3 Gold 28702 28451 28204 28698 28772 28945 29192 Silver 40255 40013 39248 40778 41020 41543 42308 29th Nov’16
- 2. Equities I Commodities I Currencies I Mutual Funds Technical View: On hourly chart, MCX Copper price has formed Bullish Cup & Candle pattern at 404 levels . Moreover, COMEX Copper are trading in higher high higher low pattern on hourly chart. In addition MCX Copper prices are trading above its 50 HEMA. Furthermore, momentum indicator RSI is trading above 60 levels on daily time frame. For now we expect prices to move higher towards 410 levels in coming trading sessions. SEBI Registered - Research Analyst Equities I Commodities I Currencies I Mutual Funds MCX Copper Nov Daily Chart CMP: 400.65 MCX Copper (Nov) Trend: Bullish Price potential: 410 Reversal: 395 MCX Crude Oil Dec. Daily Chart CMP: 3260 Technical View: MCX Crude Oil prices are trading above its Horizontal trend line support in hourly time frame. MCX Crude Oil is trading above its 50 HEMA on hourly chart. In addition, NYMEX Crude Oil has formed Bullish Anti Alternate Shark harmonic pattern in hourly time frame. Moreover, Momentum indicator RSI is trading above 50 levels on hourly chart which suggest the positive movement in the prices. For now we expect prices to move higher 3340 towards levels in coming trading sessions. MCX Crude Oil (Dec) Trend: Bullish Price potential: 3340 Reversal: 3200 Pivot levels for the Day S1 S2 S3 Pivot R1 R2 R3 Copper 399.2 394.7 382.3 407.0 411.6 419.4 431.7 Crude 3134 3070 2944 3196 3260 3322 3448 Base Metal Energy Aaj Ka Trend 29th Nov’16
- 3. Equities I Commodities I Currencies I Mutual FundsSEBI Registered - Research Analyst Equities I Commodities I Currencies I Mutual Funds Other Base Metals & Energy S1 S2 S3 Pivot R1 R2 R3 Trend Copper 399.2 394.7 382.3 407.0 411.6 419.4 431.7 Aluminum 119.7 118.8 116.5 121.1 122.0 123.4 125.7 Lead 161.9 158.6 150.2 167.1 170.3 175.5 184.0 Nickel 791.5 783.6 763.2 804.0 811.9 824.4 844.8 Zinc 194.4 191.7 184.4 199.0 201.7 206.3 213.6 Natural Gas 219.4 218.4 212.3 224.5 225.5 230.6 236.7 Fundamental News: Gold prices gained in early Asia on Monday as investors focused on the recent declines as an opportunity to buy. Gold prices rose more than 1% on Monday, rebounding from nine-and-a-half month lows as the dollar reversed some of its post U.S. election gains after surging to almost 14-year highs last week. Gold may be oversold but the bull market for the precious metal has been broken. Oil prices edged higher on Monday, after falling as much as 2 percent in early trading, as the market grappled over the shaky prospect of major producers being able to agree output cuts at a meeting on Wednesday aimed at reining in global oversupply. Oil prices retraced losses on Monday, after sharp falls overnight on the back of mounting concerns that Wednesday’s crunch OPEC meeting will not yield an agreement on output cuts. Oil was lower Monday as the chances of an OPEC deal to cut output hung in the balance. Oil prices jumped in choppy trade on Monday after Iraq’s oil minister said he was “optimistic” that Wednesday’s crunch OPEC meeting will yield an agreement on output cuts. Saudi Arabia's disavowal of a need for OPEC to cut output may or may not be a bluff. The U.S. dollar dropped against its Canadian counterpart on Monday, as a rally in oil prices boosted demand for the commodity-related Canadian currency. Aaj Ka Trend 29th Nov’16
- 4. Equities I Commodities I Currencies I Mutual FundsSEBI Registered - Research Analyst Equities I Commodities I Currencies I Mutual Funds International Market Commodity Closing Price Gold 1192 Silver 16.71 Crude Oil 46.93 Brent Crude Oil 48.99 Natural Gas 3.36 COMEX/NYMEX/ICE ( Precious Metals & Energy) Currency & Commodity Index Currency (Spot) Current Price USD / INR 68.60 Dollar Index 101.38 EUR / USD 1.059 CRB Index* 187.75 Closing as on 28.11.16 *Closing as on 28.11.16 LME (Base Metals) ( $ per tones) Commodity Closing Price Copper 5770 Aluminum 1743 Zinc 2802 Lead 2320 Nickel 11460 SHFE (Base Metals) (Yuan per tones) Commodity Closing Price Copper 48120 Aluminum 13720 Zinc 23520 Lead 21120 Closing as on 28.11.16 Closing as on 28.11.16 LME INVENTORY DATA Aaj Ka Trend 22-Nov-16 23-Nov-16 24-Nov-16 25-Nov-16 28-Nov-16 Aluminium -8051 -7801 899 -5451 26524 Copper -4798 -2874 -3526 1324 -2951 Lead -1025 0 0 0 0 Nickel 1025 468 -223 -6 -715 Zinc -76 -451 -1274 -226 -224 29th Nov’16
- 5. Equities I Commodities I Currencies I Mutual Funds This is solely for information of clients of Choice Broking and does not construe to be an investment advice. It is also not intended as an offer or solicitation for the purchase and sale of any financial instruments. Any action taken by you on the basis of the information contained herein is your responsibility alone and Choice Broking its subsidiaries or its employees or associates will not be liable in any manner for the consequences of such action taken by you. We have exercised due diligence in checking the correctness and authenticity of the information contained in this recommendation, but Choice Broking or any of its subsidiaries or associates or employees shall not be in any way responsible for any loss or damage that may arise to any person from any inadvertent error in the information contained in this recommendation or any action taken on basis of this information. Technical analysis studies market psychology, price patterns and volume levels. It is used to forecast future price and market movements. Technical analysis is complementary to fundamental analysis and news sources. The recommendations issued herewith might be contrary to recommendations issued by Choice Broking in the company research undertaken as the recommendations stated in this report is derived purely from technical analysis. Choice Broking has based this document on information obtained from sources it believes to be reliable but which it has not independently verified; Choice Broking makes no guarantee, representation or warranty and accepts no responsibility or liability as to its accuracy or completeness. The opinions contained within the report are based upon publicly available information at the time of publication and are subject to change without notice. The information and any disclosures provided herein are in summary form and have been prepared for informational purposes. The recommendations and suggested price levels are intended purely for trading purposes. The recommendations are valid for the day of the report however trading trends and volumes might vary substantially on an intraday basis and the recommendations may be subject to change. The information and any disclosures provided herein may be considered confidential. Any use, distribution, modification, copying, forwarding or disclosure by any person is strictly prohibited. The information and any disclosures provided herein do not constitute a solicitation or offer to purchase or sell any security or other financial product or instrument. The current performance may be unaudited. Past performance does not guarantee future returns. There can be no assurance that investments will achieve any targeted rates of return, and there is no guarantee against the loss of your entire investment. POTENTIAL CONFLICT OF INTEREST DISCLOSURE (as on date of report) Disclosure of interest statement – • Analyst interest of the stock /Instrument(s): - No. • Firm interest of the stock / Instrument (s): - No. Disclaimer Contact Us Amit Pathania Research Associate amit.pathania@choiceindia.com Rohan Patil Research Associate rohan.patil@choiceindia.com www.choicebroking.incustomercare@choiceindia.com SEBI Registered - Research Analyst Equities I Commodities I Currencies I Mutual Funds Aaj Ka Trend 29th Nov’16 Neeraj Yadav Research Advisor neeraj.yadav@choiceindia.com Anish Vyas Senior Research Associate anish.vyas@choiceindia.com Amit Pathania Digitally signed by Amit Pathania DN: cn=Amit Pathania, o=Choice Equity Broking Pvt. ltd, ou=Research Department, email=amit.pathania@choiceindia.com, c=IN Date: 2016.11.29 08:30:03 +05'30'