1. 28thNov’14 Aaj Ka Trend
Bullions
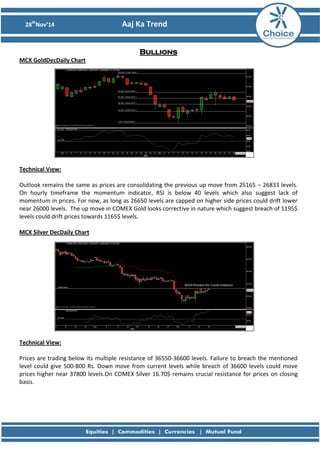
MCX GoldDecDaily Chart
Technical View:
Outlook remains the same as prices are consolidating the previous up move from 25165 – 26833 levels. On hourly timeframe the momentum indicator, RSI is below 40 levels which also suggest lack of momentum in prices. For now, as long as 26650 levels are capped on higher side prices could drift lower near 26000 levels. The up move in COMEX Gold looks corrective in nature which suggest breach of 1195$ levels could drift prices towards 1165$ levels.
MCX Silver DecDaily Chart
Technical View:
Prices are trading below its multiple resistance of 36550-36600 levels. Failure to breach the mentioned level could give 500-800 Rs. Down move from current levels while breach of 36600 levels could move prices higher near 37800 levels.On COMEX Silver 16.70$ remains crucial resistance for prices on closing basis.
2. 28thNov’14 Aaj Ka Trend
Fundamental News: Gold futures drift lower; U.S. markets closed for Thanksgiving. Gold prices inched lower on Thursday, as trading conditions remained thin with markets in the U.S. closed for the Thanksgiving Day holiday. On the Comex division of the New York Mercantile Exchange, gold futures for February delivery dipped $2.80, or 0.23%, to trade at $1,195.00 a troy ounce during U.S. morning hours. A day earlier, Comex gold prices lost 30 cents, or 0.03%, to settle at $1,197.50 an ounce.
Pivot Levelsfor the Day:
S1
S2
S3
Pivot
R1
R2
R3 Gold 26141 26034 25831 26237 26344 26440 26643
Silver
35577
35266
34517
36015
36326
36764
37513
Recommendation:
Gold
Neutral to negative Silver Neutral
3. 28thNov’14 Aaj Ka Trend
Base Metals
MCX Copper NovHourlyChart
Technical Views:
Copper prices are trading near the support of 403 levels breach of the same could move prices towards 400 followed by 398 levels. The momentum indicator, RSI is also taking resistance near the 40 levels which would give negative confirmation for prices to trade lower. Upside would remain capped at 407.5 levels.
MCX Aluminum NovHourly Chart
MCX Lead Nov Hourly Chart
MCX Nickel Nov Daily Chart
MCX Zinc Nov Hourly Chart
4. 28thNov’14 Aaj Ka Trend
Fundamental News:
Copper futures bounce off 8-month low amid stimulus hopes.
Copper futures bounced off the previous session's eight-month low on Thursday, amid speculation policymakers around the world will have to introduce further stimulus measures to support the global economy and boost growth.
On the Comex division of the New York Mercantile Exchange, copper for March delivery tacked on 0.6 cents, or 0.21% to trade at $2.963 a pound during European morning hours.
Pivot Levelsfor the Day:
S1
S2
S3
Pivot
R1
R2
R3 Copper 401.9 400.1 395.7 404.6 406.3 409.0 413.5
Aluminum
127.8
127.1
125.4
128.8
129.5
130.5
132.2 Lead 126.4 125.9 124.7 127.1 127.6 128.3 129.5
Nickel
1007.0
1002.6
992.9
1012.3
1016.7
1022.0
1031.7 Zinc 139.0 138.3 136.5 140.1 140.8 141.9 143.7
Recommendation:
Copper
Sell Below 403
Aluminum
Sell
Lead
Sell
Nickel
Neutral
Zinc
Sell
5. 28thNov’14 Aaj Ka Trend
Energy
MCX Crude Dec Hourly Chart:
Technical Views:
Prices moved lower achieving our both the short term targets. Outlook remains bearish as prices have hit lower circuit twice in the yesterday’s trading session following OPEC statement. We expect rallies can be used as selling opportunity to move further lower near 4100 levels in near term.
MCX Natural Gas DecHourly Chart:
Technical Views:
As expected Natural gas prices drifted lower achieving both the short term targets. The momentum indicator, RSI remained below 40 levels which would add bearishness to the prices. We expect prices could drift lower to test the gap level of 255-256 levels as long as 265 levels are capped on higher side.
6. 28thNov’14 Aaj Ka Trend
Fundamental News:
WTI drops 6% to fall below $70 for first time since May 2010
West Texas Intermediate oil prices tumbled to the lowest level since May 2010 on Thursday, after the Organization of the Petroleum Exporting Countries decided not to cut output at the conclusion of its highly-anticipated meeting. On the New York Mercantile Exchange, crude oil for delivery in January fell by as much as 6.7% to hit a daily low of $69.12 a barrel, before recovering to last trade at $69.41 during U.S. morning hours, down $4.68, or 6.32%. Natural gas futures plunge 3% in holiday-thinned trade. Investing.com - U.S. natural gas prices plunged sharply in holiday-thinned trade on Thursday, as updated weather forecasting models for the first week of December pointed to a return to mild weather, prompting investors to bet that utilities and homes will burn less natural gas as demand for heating falls.
Pivot Levels for the Day:
S1
S2
S3
Pivot
R1
R2
R3 Crude 4180 4069 3765 4373 4484 4677 4981
Natural Gas
256
251
237
264
270
278
292
Recommendation:
Crude
Sell on Rallies
Natural Gas
Sell
7. 28thNov’14 Aaj Ka Trend
SumeetBagadia (Associate Director) sumeet.bagadia@choiceindia.com
Ritesh Patel (Research Associate) ritesh.patel@choiceindia.com
DeveyaGaglani (Research Advisor) deveya.gaglani@chocieindia.com
For Private Circulation Only Website: www.choiceindia.com https://twitter.com/ChoiceBroking
http://www.slideshare.net/choiceindiabroking
https://www.youtube.com/user/ChoiceBroking
https://plus.google.com/115293033595831069270/posts
https://www.facebook.com/pages/Choice-Equity-Broking-Pvt-Ltd/352491718249644
https://www.linkedin.com/company/choice-international-limited?trk=parent_company_logo
8. 28thNov’14 Aaj Ka Trend
This is solely for information of clients of Choice Broking and does not construe to be an investment advice. It is also not intended as an offer or solicitation for the purchase and sale of any financial instruments. Any action taken by you on the basis of the information contained herein is your responsibility alone and Choice Broking its subsidiaries or its employees or associates will not be liable in any manner for the consequences of such action taken by you. We have exercised due diligence in checking the correctness and authenticity of the information contained in this recommendation, but Choice Broking or any of its subsidiaries or associates or employees shall not be in any way responsible for any loss or damage that may arise to any person from any inadvertent error in the information contained in this recommendation or any action taken on basis of this information. Technical analysis studies market psychology, price patterns and volume levels. It is used to forecast future price and market movements. Technical analysis is complementary to fundamental analysis and news sources. The recommendations issued herewith might be contrary to recommendations issued by Choice Broking in the company research undertaken as the recommendations stated in this report is derived purely from technical analysis. Choice Broking has based this document on information obtained from sources it believes to be reliable but which it has not independently verified; Choice Broking makes no guarantee, representation or warranty and accepts no responsibility or liability as to its accuracy or completeness. The opinions contained within the report are based upon publicly available information at the time of publication and are subject to change without notice. The information and any disclosures provided herein are in summary form and have been prepared for informational purposes. The recommendations and suggested price levels are intended purely for trading purposes. The recommendations are valid for the day of the report however trading trends and volumes might vary substantially on an intraday basis and the recommendations may be subject to change. The information and any disclosures provided herein may be considered confidential. Any use, distribution, modification, copying, forwarding or disclosure by any person is strictly prohibited. The information and any disclosures provided herein do not constitute a solicitation or offer to purchase or sell any security or other financial product or instrument. The current performance may be unaudited. Past performance does not guarantee future returns. There can be no assurance that investments will achieve any targeted rates of return, and there is no guarantee against the loss of your entire investment.
POTENTIAL CONFLICT OF INTEREST DISCLOSURE (as on date of report) Disclosure of interest statement – • Analyst interest of the stock /Instrument(s): - No. • Firm interest of the stock / Instrument (s): - No.
Disclaimer