( Jasmin ) Top VIP Escorts Service Dindigul 💧 7737669865 💧 by Dindigul Call G...
Aaj ka trend 24.11.16
1. Equities I Commodities I Currencies I Mutual Funds
Aaj Ka Trend
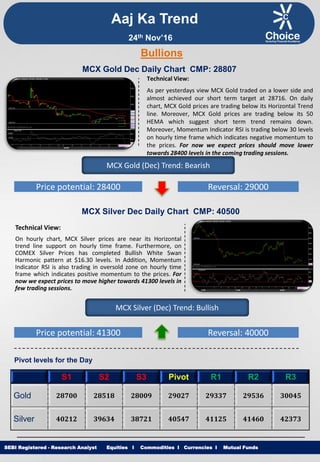
Technical View:
As per yesterdays view MCX Gold traded on a lower side and
almost achieved our short term target at 28716. On daily
chart, MCX Gold prices are trading below its Horizontal Trend
line. Moreover, MCX Gold prices are trading below its 50
HEMA which suggest short term trend remains down.
Moreover, Momentum Indicator RSI is trading below 30 levels
on hourly time frame which indicates negative momentum to
the prices. For now we expect prices should move lower
towards 28400 levels in the coming trading sessions.
SEBI Registered - Research Analyst Equities I Commodities I Currencies I Mutual Funds
Bullions
MCX Gold Dec Daily Chart CMP: 28807
MCX Gold (Dec) Trend: Bearish
Price potential: 28400 Reversal: 29000
MCX Silver Dec Daily Chart CMP: 40500
Technical View:
On hourly chart, MCX Silver prices are near its Horizontal
trend line support on hourly time frame. Furthermore, on
COMEX Silver Prices has completed Bullish White Swan
Harmonic pattern at $16.30 levels. In Addition, Momentum
Indicator RSI is also trading in oversold zone on hourly time
frame which indicates positive momentum to the prices. For
now we expect prices to move higher towards 41300 levels in
few trading sessions.
MCX Silver (Dec) Trend: Bullish
Price potential: 41300 Reversal: 40000
Pivot levels for the Day
S1 S2 S3 Pivot R1 R2 R3
Gold 28700 28518 28009 29027 29337 29536 30045
Silver 40212 39634 38721 40547 41125 41460 42373
24th Nov’16
2. Equities I Commodities I Currencies I Mutual Funds
Technical View:
As per yesterdays view MCX Copper traded on a higher side
and achieved our short term target of 390. On hourly chart,
MCX Copper price have observed breakout of its
Consolidation range at 391 levels on hourly time frame.
Moreover, COMEX Copper has observed breakout of its
Symmetrical pattern at $2.60 levels on hourly chart. In
addition MCX Copper prices are trading above its 50 HEMA.
For now we expect prices to move higher towards 402
levels in coming trading sessions.
SEBI Registered - Research Analyst Equities I Commodities I Currencies I Mutual Funds
MCX Copper Nov Daily Chart CMP: 395.85
MCX Copper (Nov) Trend: Bullish
Price potential: 402 Reversal: 389
MCX Crude Oil Dec. Daily Chart CMP: 3313
Technical View:
As per our yesterdays view MCX Crude Oil traded on a higher
side. MCX Crude oil price have retested its trend line at 3239
levels & is trading above its Horizontal trend line on hourly
chart. MCX Crude Oil is trading above its 21 HEMA on hourly
chart. Moreover, Momentum indicator RSI is trading above
60 levels on hourly chart which suggest the positive
movement in the prices. For now we expect prices to move
higher 3400 towards levels in coming trading sessions.
MCX Crude Oil (Dec) Trend: Bullish
Price potential: 3400 Reversal: 3265
Pivot levels for the Day
S1 S2 S3 Pivot R1 R2 R3
Copper 379.1 374.6 363.2 386.0 390.5 397.4 408.8
Crude 3242 3226 3161 3291 3307 3356 3421
Base Metal
Energy
Aaj Ka Trend
24th Nov’16
3. Equities I Commodities I Currencies I Mutual FundsSEBI Registered - Research Analyst Equities I Commodities I Currencies I Mutual Funds
Other Base Metals & Energy
S1 S2 S3 Pivot R1 R2 R3 Trend
Copper 379.1 374.6 363.2 386.0 390.5 397.4 408.8
Aluminum 119.3 118.4 116.3 120.5 121.4 122.6 124.7
Lead 148.1 146.9 144.1 149.7 150.9 152.5 155.3
Nickel 766.7 759.4 738.6 780.2 787.5 801.0 821.8
Zinc 174.8 172.7 167.3 178.0 180.1 183.4 188.7
Natural Gas 200.7 197.2 190.4 204.0 207.5 210.8 217.6
Fundamental News:
Gold prices gave up gains on Tuesday as the dollar regained ground against a basket of the other major
currencies, pushing the precious metal back towards recent lows.
Gold prices edged higher on Wednesday as the dollar hovered below almost 14-year highs against a currency
basket as investors awaited the release of minutes from the Federal Reserve’s policy meeting earlier this month.
Gold prices fell to the lowest levels since February on Wednesday after the dollar surged to fresh 14-year highs
as upbeat U.S. economic reports underlined expectations for higher interest rates.
Oil prices rose on Wednesday, after the U.S. Energy Information Administration reported a larger-than-expected
U.S. oil inventory drawdown last week.
OPEC will debate an oil output cut of 4.0-4.5 percent for all of its members except Libya and Nigeria next week
but the deal's success hinges on an agreement from Iraq and Iran, which are far from certain to give full backing.
U.S. oil prices moved higher on Wednesday, hovering close to a three-week peak as traders were still hoping
OPEC will be able to hammer out a production freeze deal before the end of the month.
Oil edged higher Wednesday with hopes for an OPEC deal to cut output in the balance.
Oil prices edged lower on Wednesday on investors' doubts that OPEC would agree a large enough production
cut to significantly reduce the global surplus when it meets next week.
The American Petroleum Institute said Tuesday that crude oil inventories fell 1.28 million barrels at the end of
last week, following a build of 3.65 million barrels the previous week and breaking three straight weekly builds.
Aaj Ka Trend
24th Nov’16
4. Equities I Commodities I Currencies I Mutual FundsSEBI Registered - Research Analyst Equities I Commodities I Currencies I Mutual Funds
International Market
Commodity Closing Price
Gold 1183.50
Silver 16.25
Crude Oil 47.97
Brent Crude Oil 48.92
Natural Gas 3.06
COMEX/NYMEX/ICE ( Precious Metals & Energy) Currency & Commodity Index
Currency (Spot) Current Price
USD / INR 68.80
Dollar Index 101.94
EUR / USD 1.05
CRB Index* 187.68
Closing as on 23.11.16 *Closing as on 23.11.16
LME (Base Metals) ( $ per tones)
Commodity Closing Price
Copper 5818
Aluminum 1780
Zinc 2701
Lead 2280
Nickel 11560
SHFE (Base Metals) (Yuan per tones)
Commodity Closing Price
Copper 44150
Aluminum 13850
Zinc 21060
Lead 18250
Closing as on 23.11.16 Closing as on 23.11.16
LME INVENTORY DATA
Aaj Ka Trend
17-Nov-16 18-Nov-16 21-Nov-16 22-Nov-16 23-Nov-16
Aluminium 3401 -5900 -5451 -8051 -7801
Copper 2275 -4175 -6626 -4798 -2874
Lead -25 775 0 -1025 0
Nickel 48 0 581 1025 468
Zinc -375 -325 -202 -76 -451
24th Nov’16
5. Equities I Commodities I Currencies I Mutual Funds
This is solely for information of clients of Choice Broking and does not construe to be an investment advice. It is also not intended as an offer or solicitation
for the purchase and sale of any financial instruments. Any action taken by you on the basis of the information contained herein is your responsibility alone
and Choice Broking its subsidiaries or its employees or associates will not be liable in any manner for the consequences of such action taken by you. We
have exercised due diligence in checking the correctness and authenticity of the information contained in this recommendation, but Choice Broking or any of
its subsidiaries or associates or employees shall not be in any way responsible for any loss or damage that may arise to any person from any inadvertent
error in the information contained in this recommendation or any action taken on basis of this information. Technical analysis studies market psychology,
price patterns and volume levels. It is used to forecast future price and market movements. Technical analysis is complementary to fundamental analysis
and news sources. The recommendations issued herewith might be contrary to recommendations issued by Choice Broking in the company research
undertaken as the recommendations stated in this report is derived purely from technical analysis. Choice Broking has based this document on information
obtained from sources it believes to be reliable but which it has not independently verified; Choice Broking makes no guarantee, representation or warranty
and accepts no responsibility or liability as to its accuracy or completeness. The opinions contained within the report are based upon publicly available
information at the time of publication and are subject to change without notice. The information and any disclosures provided herein are in summary form
and have been prepared for informational purposes. The recommendations and suggested price levels are intended purely for trading purposes. The
recommendations are valid for the day of the report however trading trends and volumes might vary substantially on an intraday basis and the
recommendations may be subject to change. The information and any disclosures provided herein may be considered confidential. Any use, distribution,
modification, copying, forwarding or disclosure by any person is strictly prohibited. The information and any disclosures provided herein do not constitute a
solicitation or offer to purchase or sell any security or other financial product or instrument. The current performance may be unaudited. Past performance
does not guarantee future returns. There can be no assurance that investments will achieve any targeted rates of return, and there is no guarantee against
the loss of your entire investment.
POTENTIAL CONFLICT OF INTEREST DISCLOSURE (as on date of report) Disclosure of interest statement – • Analyst interest of the stock
/Instrument(s): - No. • Firm interest of the stock / Instrument (s): - No.
Disclaimer
Contact Us
Amit Pathania
Research Associate
amit.pathania@choiceindia.com
Rohan Patil
Research Associate
rohan.patil@choiceindia.com
www.choicebroking.incustomercare@choiceindia.com
SEBI Registered - Research Analyst Equities I Commodities I Currencies I Mutual Funds
Aaj Ka Trend
24th Nov’16
Neeraj Yadav
Research Advisor
neeraj.yadav@choiceindia.com
Anish Vyas
Senior Research Associate
anish.vyas@choiceindia.com
Amit Pathania
Digitally signed by Amit Pathania
DN: cn=Amit Pathania, o=Choice Equity Broking Pvt.
ltd, ou=Research Department,
email=amit.pathania@choiceindia.com, c=IN
Date: 2016.11.24 08:32:16 +05'30'