1. 29th Oct’14 Equity Bazaar
Nifty
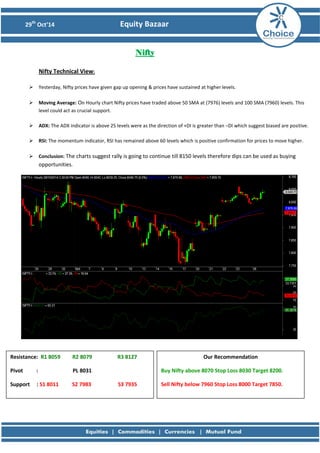
Nifty Technical View:
Yesterday, Nifty prices have given gap up opening & prices have sustained at higher levels.
Moving Average: On Hourly chart Nifty prices have traded above 50 SMA at (7976) levels and 100 SMA (7960) levels. This level could act as crucial support.
ADX: The ADX indicator is above 25 levels were as the direction of +DI is greater than –DI which suggest biased are positive.
RSI: The momentum indicator, RSI has remained above 60 levels which is positive confirmation for prices to move higher.
Conclusion: The charts suggest rally is going to continue till 8150 levels therefore dips can be used as buying opportunities.
Resistance: R1 8059 R2 8079 R3 8127
Pivot : PL 8031
Support : S1 8011 S2 7983 S3 7935
Our Recommendation
Buy Nifty above 8070 Stop Loss 8030 Target 8200.
Sell Nifty below 7960 Stop Loss 8000 Target 7850.
2. 29th Oct’14 Equity Bazaar
Bank Nifty
Bank Nifty Technical View:
Yesterday Bank Nifty Prices gave a gap up opening and moved higher and prices are closed near days high.
Moving Average: On Hourly chart Bank Nifty have traded above 50 SMA (16400) & 100 SMA (16167) levels. These levels could act as strong support for Bank Nifty.
ADX: ADX indicator is above the 25 were as +DI is greater than –DI which is positive sign for prices.
RSI: RSI has managed to give close above 60 levels which would add bullishness in prices.
Conclusion: If Bank Nifty prices will sustain above its previous session high, prices can move towards 17000 levels.
Resistance: R1 16742 R2 16784 R3 16892
Pivot : PL 16676
Support : S1 16634 S2 16568 S3 16460
Our Recommendation
Buy BNF above 16700 Stop Loss 16600 Target: 17000.
Sell BNF below 16200 Stop Loss 16300 Target: 15900.
3. 29th Oct’14 Equity Bazaar
Stock of the Day
LICHSGFIN View:
LIC Housing Finance prices are treading in uptrend formation whereas prices have tested the crucial support of uptrend line.
Candlesticks Pattern: On hourly chart we can see that LIC Housing Finance prices are forming Bullish Engulfing near 61.8% retracement levels.
Moving Average: On hourly chart prices are treading above 50 SMA (333) and 100 SMA (329) levels, 50 SMA (333) levels could act as immediate support.
RSI: RSI has remained between 60-40 levels with positive reversal which suggest momentum is positive.
Conclusion: In short term, if prices will sustain above 338 levels then rally could continue till 348 levels.
Resistance: R1 341 R2 345 R3 354
Pivot : PL 336
Support : S1 332 S2 327 S3 318
Our Recommendation
Buy LICHSGFIN above 338 Stop Loss 333 Target: 348
4. 29th Oct’14 Equity Bazaar
Derivative Analysis FIIS Data: FII’s are net Rs 108 Cr Sellers on 28th October 2014 and Dll’s are the net Rs 99.66 Cr Sellers on 28th October 2014. Option Data: 8100 CE has the highest OI with 66 lakhs and 8200 CE has the second highest OI with 54 lakhs and 8000 PE has the highest OI with 58 lakhs and 7900 PE has the second highest OI with 54 lakhs. Open Interest: The above options data shows that nifty has strong support at 7900 and has resistance at 8100. The change in level will take place once when NIFTY prices breaks 8000 mark. Intraday Option Strategy: (A) Buy Nifty 8000 calls and Sell Nifty 8100 puts if buy level is breached. (B) Sell Nifty 7900 calls and Buy Nifty 8000 puts if sell level is breached.
7. 29th Oct’14 Equity Bazaar
Disclaimer
This is solely for information of clients of Choice India and does not construe to be an investment advice. It is also not intended as an offer or solicitation for the purchase and sale of any financial instruments. Any action taken by you on the basis of the information contained herein is your responsibility alone and Choice India its subsidiaries or its employees or associates will not be liable in any manner for the consequences of such action taken by you. We have exercised due diligence in checking the correctness and authenticity of the information contained in this recommendation, but Choice India or any of its subsidiaries or associates or employees shall not be in any way responsible for any loss or damage that may arise to any person from any inadvertent error in the information contained in this recommendation or any action taken on basis of this information. Technical analysis studies market psychology, price patterns and volume levels. It is used to forecast future price and market movements. Technical analysis is complementary to fundamental analysis and news sources. The recommendations issued herewith might be contrary to recommendations issued by Choice India in the company research undertaken as the recommendations stated in this report is derived purely from technical analysis. Choice India has based this document on information obtained from sources it believes to be reliable but which it has not independently verified; Choice India makes no guarantee, representation or warranty and accepts no responsibility or liability as to its accuracy or completeness. The opinions contained within the report are based upon publicly available information at the time of publication and are subject to change without notice. The information and any disclosures provided herein are in summary form and have been prepared for informational purposes. The recommendations and suggested price levels are intended purely for trading purposes. The recommendations are valid for the day of the report however trading trends and volumes might vary substantially on an intraday basis and the recommendations may be subject to change. The information and any disclosures provided herein may be considered confidential. Any use, distribution, modification, copying, forwarding or disclosure by any person is strictly prohibited. The information and any disclosures provided herein do not constitute a solicitation or offer to purchase or sell any security or other financial product or instrument. The current performance may be unaudited. Past performance does not guarantee future returns. There can be no assurance that investments will achieve any targeted rates of return, and there is no guarantee against the loss of your entire investment.
POTENTIAL CONFLICT OF INTEREST DISCLOSURE (as on date of report) Disclosure of interest statement – • Analyst interest of the stock /Instrument(s): - No. • Firm interest of the stock / Instrument (s): - No.