Aaj ka trend 13.11.14
•
0 likes•46 views

- Gold and silver prices are expected to move lower in the near future as selling pressure continues. Gold is expected to fall to 25450 and 25050 levels while silver may test 34200 levels. - Copper, aluminum, lead, nickel, and zinc prices are expected to trade sideways in a narrow range in the short term with copper seen as neutral and the others recommended for selling. - Crude oil is recommended for buying provided 4700 support holds, while natural gas is expected to continue falling with further tests of 254/250 levels seen if 264 resistance is broken.

Recommended
More Related Content
What's hot
What's hot (18)
Viewers also liked
Similar to Aaj ka trend 13.11.14
Similar to Aaj ka trend 13.11.14 (16)
Aaj ka trend 13.11.14
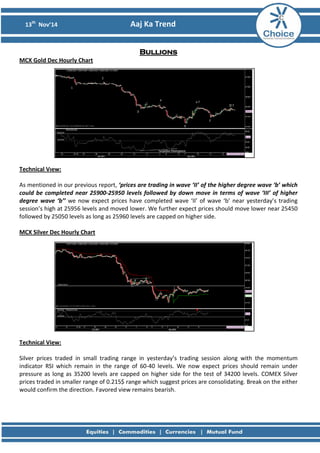
- 1. 13th Nov’14 Aaj Ka Trend Bullions MCX Gold Dec Hourly Chart Technical View: As mentioned in our previous report, ‘prices are trading in wave ‘II’ of the higher degree wave ‘b’ which could be completed near 25900-25950 levels followed by down move in terms of wave ‘III’ of higher degree wave ‘b’’ we now expect prices have completed wave ‘II’ of wave ‘b’ near yesterday’s trading session’s high at 25956 levels and moved lower. We further expect prices should move lower near 25450 followed by 25050 levels as long as 25960 levels are capped on higher side. MCX Silver Dec Hourly Chart Technical View: Silver prices traded in small trading range in yesterday’s trading session along with the momentum indicator RSI which remain in the range of 60-40 levels. We now expect prices should remain under pressure as long as 35200 levels are capped on higher side for the test of 34200 levels. COMEX Silver prices traded in smaller range of 0.215$ range which suggest prices are consolidating. Break on the either would confirm the direction. Favored view remains bearish.
- 2. 13th Nov’14 Aaj Ka Trend Fundamental News: • Gold prices edged up modestly on Wednesday, but gains remained limited amid expectations that the Federal Reserve will raise interest rates sooner than expected • On the Comex division of the New York Mercantile Exchange, gold futures for December delivery traded at $1,166.10 a troy ounce during U.S. morning hours, up $3.10, or 0.27%. Pivot Levels for the Day: S1 S2 S3 Pivot R1 R2 R3 Gold 25693 25599 25373 25825 25919 26051 26277 Silver 34488 34280 33839 34721 34929 35162 35603 Recommendation: Gold Sell Silver Neutral
- 3. 13th Nov’14 Aaj Ka Trend Base Metals MCX Copper Nov Hourly Chart Technical Views: Prices remained volatile throughout the trading session where prices moved near 414 levels on higher side while made 410.30 low. The momentum indicator, RSI has taken resistance near 60 levels and is between 60-40 levels which suggest sideways moment in the copper prices. We expect prices could continue it sideways direction and remain in the mentioned range for few trading session. MCX Aluminum Nov Hourly Chart MCX Lead Nov Hourly Chart MCX Nickel Nov Hourly Chart MCX Zinc Nov Hourly Chart
- 4. 13th Nov’14 Aaj Ka Trend Fundamental News: • Copper futures edged lower on Wednesday, as traders looked ahead to key Chinese economic data later in the week to gauge the strength of the world’s second largest economy and biggest consumer of the industrial metal. • On the Comex division of the New York Mercantile Exchange, copper for December delivery shed 0.6 cents, or 0.2% to trade at $3.027 a pound during European morning hours. Pivot Levels for the Day: S1 S2 S3 Pivot R1 R2 R3 Copper 409.6 408.1 404.5 411.8 413.2 415.4 419.1 Aluminum 126.3 125.0 122.7 127.3 128.6 129.6 131.9 Lead 125.2 124.6 123.4 125.8 126.4 127.0 128.2 Nickel 945.7 935.5 913.7 957.3 967.5 979.1 1000.9 Zinc 139.0 138.1 136.3 140.0 140.9 141.8 143.7 Recommendation: Copper Neutral Aluminum Sell Lead Sell Nickel Sell Zinc Neutral
- 5. 13th Nov’14 Aaj Ka Trend Energy MCX Crude Nov Hourly Chart: Technical Views: Prices traded in range however outlook remains bullish as long as mentioned hammer’s low of 4710 is protected on downside. RSI has remained in 60-40 range. On daily timeframe prices have formed doji which itself suggest no clear trend in the prices. For now as long as 4700 levels are protected on downside prices can head towards 4850 levels. MCX Natural Gas Oct Hourly Chart: Technical Views: As expected natural gas prices drifted lower almost near our target levels. Bias remains bearish with no change in outlook. We expect prices should test 254/250 levels as long as 264 levels are capped on higher side.
- 6. 13th Nov’14 Aaj Ka Trend Fundamental News: • U.S. natural gas prices fell for the third consecutive session on Wednesday, as investors continued to lock in gains from a recent rally which took futures to four-month highs. • On the New York Mercantile Exchange, natural gas for delivery in December lost 8.5 cents, or 1.99%, to trade at $4.163 per million British thermal units during U.S. morning hours. Pivot Levels for the Day: S1 S2 S3 Pivot R1 R2 R3 Crude 4726 4696 4628 4764 4794 4832 4900 Natural Gas 209.8 230.0 224.5 235.5 215.3 241.0 246.5 Recommendation: Crude Buy Natural Gas Sell
- 7. 13th Nov’14 Aaj Ka Trend Sumeet Bagadia (Associate Director) sumeet.bagadia@choiceindia.com Ritesh Patel (Research Associate) ritesh.patel@choiceindia.com Deveya Gaglani (Research Advisor) deveya.gaglani@chocieindia.com For Private Circulation Only Website: www.choiceindia.com https://twitter.com/ChoiceBroking http://www.slideshare.net/choiceindiabroking https://www.youtube.com/user/ChoiceBroking https://plus.google.com/115293033595831069270/posts https://www.facebook.com/pages/Choice-Equity-Broking-Pvt-Ltd/352491718249644 https://www.linkedin.com/company/choice-international-limited?trk=parent_company_logo
- 8. 13th Nov’14 Aaj Ka Trend This is solely for information of clients of Choice Broking and does not construe to be an investment advice. It is also not intended as an offer or solicitation for the purchase and sale of any financial instruments. Any action taken by you on the basis of the information contained herein is your responsibility alone and Choice Broking its subsidiaries or its employees or associates will not be liable in any manner for the consequences of such action taken by you. We have exercised due diligence in checking the correctness and authenticity of the information contained in this recommendation, but Choice Broking or any of its subsidiaries or associates or employees shall not be in any way responsible for any loss or damage that may arise to any person from any inadvertent error in the information contained in this recommendation or any action taken on basis of this information. Technical analysis studies market psychology, price patterns and volume levels. It is used to forecast future price and market movements. Technical analysis is complementary to fundamental analysis and news sources. The recommendations issued herewith might be contrary to recommendations issued by Choice Broking in the company research undertaken as the recommendations stated in this report is derived purely from technical analysis. Choice Broking has based this document on information obtained from sources it believes to be reliable but which it has not independently verified; Choice Broking makes no guarantee, representation or warranty and accepts no responsibility or liability as to its accuracy or completeness. The opinions contained within the report are based upon publicly available information at the time of publication and are subject to change without notice. The information and any disclosures provided herein are in summary form and have been prepared for informational purposes. The recommendations and suggested price levels are intended purely for trading purposes. The recommendations are valid for the day of the report however trading trends and volumes might vary substantially on an intraday basis and the recommendations may be subject to change. The information and any disclosures provided herein may be considered confidential. Any use, distribution, modification, copying, forwarding or disclosure by any person is strictly prohibited. The information and any disclosures provided herein do not constitute a solicitation or offer to purchase or sell any security or other financial product or instrument. The current performance may be unaudited. Past performance does not guarantee future returns. There can be no assurance that investments will achieve any targeted rates of return, and there is no guarantee against the loss of your entire investment. POTENTIAL CONFLICT OF INTEREST DISCLOSURE (as on date of report) Disclosure of interest statement – • Analyst interest of the stock /Instrument(s): - No. • Firm interest of the stock / Instrument (s): - No. Disclaimer