1. 30th Sept’14 Aaj Ka Trend
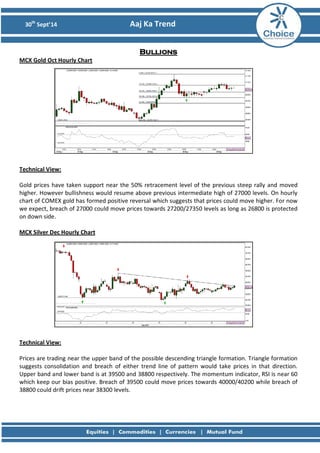
Bullions MCX Gold Oct Hourly Chart
Technical View: Gold prices have taken support near the 50% retracement level of the previous steep rally and moved higher. However bullishness would resume above previous intermediate high of 27000 levels. On hourly chart of COMEX gold has formed positive reversal which suggests that prices could move higher. For now we expect, breach of 27000 could move prices towards 27200/27350 levels as long as 26800 is protected on down side. MCX Silver Dec Hourly Chart
Technical View: Prices are trading near the upper band of the possible descending triangle formation. Triangle formation suggests consolidation and breach of either trend line of pattern would take prices in that direction. Upper band and lower band is at 39500 and 38800 respectively. The momentum indicator, RSI is near 60 which keep our bias positive. Breach of 39500 could move prices towards 40000/40200 while breach of 38800 could drift prices near 38300 levels.
2. 30th Sept’14 Aaj Ka Trend
Fundamental News:
• Gold prices pulled back from session highs on Monday but remained supported as declines in global equities markets fuelled safe haven demand for the precious metal.
• Market sentiment was hit by jitters over pro-democracy protesters in Hong Kong, while investors were also wary ahead of Friday’s U.S. nonfarm payrolls report after August’s report fell short of expectations.
• Gold has traditionally been seen as a safe haven investment during times of political instability.
Pivot Levels for the Day:
S1
S2
S3
Pivot
R1
R2
R3
Gold
26810
26707
26509
26905
27008
27103
27301
Silver
39101
38847
38405
39289
39543
39731
40173
Recommendation:
Gold
Buy above 27000
Silver
Buy above 37500
3. 30th Sept’14 Aaj Ka Trend
Base Metals MCX Copper Nov Hourly Chart
Technical Views: Prices have broken the higher band of the consolidation and moved higher near 422 levels. We now remain bullish on Copper prices as the momentum indicator, RSI has also moved into bullish zone which is above 60 levels. COMEX Copper prices have formed bullish engulfing candlestick on daily timeframe which would move prices towards higher levels. For now, copper prices can move towards 422/424 levels as long as 416 is protected on downside.
MCX Aluminum Sept Hourly Chart
MCX Lead Sept Hourly Chart
MCX Nickel Sept Hourly Chart
MCX Zinc Sept Hourly Chart
4. 30th Sept’14 Aaj Ka Trend
Fundamental News:
• Nickel prices continued their downward spiral during the kerb session on the London Metal Exchange on Monday September 29, in a thinly traded market.
• The three-month price closed at $16,675 per ton on Monday, down from $16,980 per ton on Friday. "Nickel continues to struggle, though decent two-way interest has built up around $16500," a commodities strategist said in a note. "LME stocks surged higher this morning, underlining the availability of refined metal. What was different is that the bulk of the inflows were of full plate cathodes rather than bagged briquettes,
Pivot Levels for the Day:
S1
S2
S3
Pivot
R1
R2
R3
Copper
415.4
411.0
403.2
442.0
423.2
426.5
434.2
Aluminum
118.0
116.7
114.7
118.7
120.0
120.7
122.7
Lead
127.0
124.8
121.3
128.4
130.6
131.9
135.5
Nickel
1016.6
1008.2
992.4
1024.0
1032.4
1039.8
1055.6
Zinc
139.3
137.7
135.1
140.2
141.9
142.8
145.3
Recommendation:
Copper
Buy
Aluminum
Buy
Lead
Buy
Nickel
Buy
Zinc
Buy
5. 30th Sept’14 Aaj Ka Trend
Energy MCX Crude Oct Hourly Chart:
Technical Views: Crude prices moved higher following ascending triangle formation on hourly chart. Outlook remains bullish as prices have given close above previous intermediate high of 5800 levels. The momentum indicator, RSI has remained in bullish zone which suggest dips can be considered as buying opportunity to test 5950/6000 levels as long as 5800 is protected on down side. MCX Natural Gas Sept Hourly Chart:
Technical Views: Natural gas prices have rallied as expected. Bias remains the same with no change in outlook. However after steep up move dips near 252/251 can be considered as buying opportunity to test higher levels. The momentum indicator, RSI is trading in the bullish zone which would add bullishness to the prices. For now we expect prices to test 260 levels.
6. 30th Sept’14 Aaj Ka Trend
Fundamental News:
• Crude oil futures held steady on Monday, although the strength of the U.S. dollar continued to weigh on demand for the commodity.
• On the New York Mercantile Exchange, crude oil for delivery in November traded at $93.51 a barrel during U.S. morning trade, down 0.03
• Oil prices rose on sentiments that an expanding U.S. economy will consume more fuel and energy
• Natural gas prices rose on Monday after updated weather-forecasting models pointed to falling temperatures across the U.S., which should drive demand for heating in the country's homes and businesses.
• Natural gas futures were likely to find support at $3.845 per million British thermal units, last Tuesday's low, and resistance at $4.100, the high from Sept. 17.
• Weather-forecasting models called for cooler temperatures in the Midwest and eastern U.S. later this week and extending into the middle of October, though some backed off intensity, which capped the commodity's gains..
Pivot Levels for the Day:
S1
S2
S3
Pivot
R1
R2
R3
Crude
5765
5681
5549
5813
5897
5945
6077
Natural Gas
213.5
225.7
215.9
235.5
223.3
245.3
255.1
Recommendation:
Crude
Buy
Natural Gas
Buy on dips
8. 30th Sept’14 Aaj Ka Trend
Disclaimer
This is solely for information of clients of Choice India and does not construe to be an investment advice. It is also not intended as an offer or solicitation for the purchase and sale of any financial instruments. Any action taken by you on the basis of the information contained herein is your responsibility alone and Choice India its subsidiaries or its employees or associates will not be liable in any manner for the consequences of such action taken by you. We have exercised due diligence in checking the correctness and authenticity of the information contained in this recommendation, but Choice India or any of its subsidiaries or associates or employees shall not be in any way responsible for any loss or damage that may arise to any person from any inadvertent error in the information contained in this recommendation or any action taken on basis of this information. Technical analysis studies market psychology, price patterns and volume levels. It is used to forecast future price and market movements. Technical analysis is complementary to fundamental analysis and news sources. The recommendations issued herewith might be contrary to recommendations issued by Choice India in the company research undertaken as the recommendations stated in this report is derived purely from technical analysis. Choice India has based this document on information obtained from sources it believes to be reliable but which it has not independently verified; Choice India makes no guarantee, representation or warranty and accepts no responsibility or liability as to its accuracy or completeness. The opinions contained within the report are based upon publicly available information at the time of publication and are subject to change without notice. The information and any disclosures provided herein are in summary form and have been prepared for informational purposes. The recommendations and suggested price levels are intended purely for trading purposes. The recommendations are valid for the day of the report however trading trends and volumes might vary substantially on an intraday basis and the recommendations may be subject to change. The information and any disclosures provided herein may be considered confidential. Any use, distribution, modification, copying, forwarding or disclosure by any person is strictly prohibited. The information and any disclosures provided herein do not constitute a solicitation or offer to purchase or sell any security or other financial product or instrument. The current performance may be unaudited. Past performance does not guarantee future returns. There can be no assurance that investments will achieve any targeted rates of return, and there is no guarantee against the loss of your entire investment. POTENTIAL CONFLICT OF INTEREST DISCLOSURE (as on date of report) Disclosure of interest statement – • Analyst interest of the stock /Instrument(s): - No. • Firm interest of the stock / Instrument (s): - No.