SlideShare a Scribd company logo
1 of 6
Download to read offline
24th Nov’14 Currency Highlights 
USDINR 
USDINR Technical View: 
 As mention in the previous “Currency Highlights” report, USDINR is now in a short term downtrend. 
 Price Pattern: USDINR price pattern has reverse for a short term downtrend, as the pair is making new lows from its high of 62.30 levels. This bearish price pattern will continue for the pair, till USDINR do not successfully trades and close above 62.00 levels with 61.60 levels as the target for this short term downtrend. 
 Moving Average: The below hourly chart clearly shows how prices have traded and closed below the 50 & 20 EMA’s. The averages are also on the verge to reverse and if the pair trades below them today, then the will be a negative crossover to give sell signal suggesting the pair short term downtrend to become intermediate downtrend. 
 MACD: The MACD indicator has given a sell signal as momentum has changed to negative. Also MACD has crossed the signal line confirming the bearishness to remain intact for the pair. 
 RSI: RSI indicator has not only reading below mid-range level 50 but also staying at the over-sold region clearly suggesting the momentum will remain weak till RSI do not starts to read and stay above the mid-range level 50. 
 ADX: ADX indicator is reading at lower levels and showing the weakness of trending movement. So once ADX read’s below the 20 levels then, pair will start to consolidate in a narrow range. 
Economic Indicators Date Time Data Prior Expected Impact 
24.11.14 
08:15 PM Flash Services PMI 57.1 
Actual > Expected=Good for USD
24th Nov’14 Currency Highlights 
EURINR 
EURINR Technical View: 
 EURINR acted as per our view and the pair is now back to its major downtrend. 
 Price Pattern: The short term uptrend of the pair reversed to its previous major downtrend. The price pattern is now very bearish for the pair, till there is no confirm reversal to upside. In the coming trading session, the pair will observe more weakness if USDINR trades below 61.60 levels as per inter-market correlation between both pairs. 
 Moving Average: The 50 & 20 EMA’S has given the sell signal with negative crossover and this sell signal will remain valid till prices do not reverse for the buy signal generated by the averages. 
 MACD: The indicator sell signal will strongly remain valid as it reading below the signal line. If MACD reverse to give buy signal then it can be strictly ignore as the major downtrend exists. 
 RSI: Weak momentum is active for the pair, as RSI is reading at the over-sold region. The RSI will continue to read it for negative momentum for the pair till price do not reverse for intermediate uptrend. 
 ADX: Trending phase is active for the pair is its reading well above the 20 levels. The pair will observe a higher price range till the trending phase remains intact for the pair. 
Economic Indicators Date Time Data Prior Expected Impact 
24.11.14 
24-28TH German Import Prices m/m 
0.3% 
Actual > Expected=Good for EUR 
24.11.14 
24-28TH Nationwide HPI m/m 
103.2 
Actual > Expected=Good for EUR 
24.11.14 
02:30 PM German Ifo Business Climate 
-6.8 
Actual > Expected=Good for EUR
24th Nov’14 Currency Highlights 
GBPINR 
GBPINR Technical View: 
 With the downtrend in USDINR& EURINR pair, GBPINR following both the pairs. 
 Price Pattern: GBPINR also resumes back to its major downtrend and the overall pattern looks bearish for the pair. The pair will observe weakness in the coming trading session as GBPUSD pair remains weak as its strong correlation exits with GBPINR. 
 Moving Average: As per our view GBPINR traded and closed below both the averages making the pair bearish and also there is a negative crossover of both the averages suggesting the major downtrend will exits for the pair till prices closes below both the averages. 
 MACD: MACD sell signal strongly remains valid going with the trend. So traders can wait for a new sell signal to be generated to remain with the trend and ignoring any buy signal. 
 RSI: The indicator is reading well below the mid-range level 50 and soon to read and stay at the over-sold region. RSI indicator clearly indicates bearishness will continue for the pair. 
 ADX: ADX indicator is indicating the trending phase to remain valid for the pair. The pair will make new lows in coming trading session with ADX reading at higher values. 
Economic Indicators Date Time Data Prior Expected Impact 
24.11.14 
24-28TH Nationwide HPI m/m 
0.5% 
Actual > Expected=Good for GBP
24th Nov’14 Currency Highlights 
JPYINR 
JPYINR Technical View: 
 The pair continues to remain in tis strong downtrend and will observe more weakness following the above currencies. 
 Price Pattern: The bearish price pattern continues to remain valid as the pair consolidates in a range. Our suggestion will be not to trade in the pair, till it does not show the sign of reversal and ending its current consolidation phase in a downtrend. 
 Moving Average: There will be no sign of reversal for the pair till it do not trades above both 50 & 20 EMA’s on hourly basis. 
 MACD: Since the major downtrend exits for the pair, it will be better to consider only the sell signal generated by the indicator. 
 RSI: RSI indicator has made many attempts but failed to read and stay above the mid-range level 50. This strong suggest the current negative momentum will exist in the pair till RSI do not successfully reads and stay above the mid-range level 50. 
 ADX: ADX is reading very close to the 20 levels. So this suggest that if ADX starts to read below this level then the pair can continue its consolidation movement for few day before showing a trending movement. 
Economic Indicators Date Time Data Prior Expected Impact 
24.11.14 
No Data For JPY Today
24th Nov’14 Currency Highlights 
Amit Pawar (Research Associate) amit.pawar@choiceindia.com 
Rohan Shinde (Research Associate) rohan.shinde@choiceindia.com 
Deveya Gaglani (Research Advisor) deveya.gaglani@chocieindia.com 
For Private Circulation Only Website: www.choiceindia.com 
https://twitter.com/ChoiceBroking https://plus.google.com/115293033595831069270/posts 
https://www.youtube.com/user/ChoiceBroking http://www.slideshare.net/choiceindiabroking 
https://www.facebook.com/choicebroking 
https://www.linkedin.com/company/choice-international-limited
24th Nov’14 Currency Highlights 
Disclaimer 
This is solely for information of clients of Choice Broking and does not construe to be an investment advice. It is also not intended as an offer or solicitation for the purchase and sale of any financial instruments. Any action taken by you on the basis of the information contained herein is your responsibility alone and Choice Broking its subsidiaries or its employees or associates will not be liable in any manner for the consequences of such action taken by you. We have exercised due diligence in checking the correctness and authenticity of the information contained in this recommendation, but Choice Broking or any of its subsidiaries or associates or employees shall not be in any way responsible for any loss or damage that may arise to any person from any inadvertent error in the information contained in this recommendation or any action taken on basis of this information. Technical analysis studies market psychology, price patterns and volume levels. It is used to forecast future price and market movements. Technical analysis is complementary to fundamental analysis and news sources. The recommendations issued here with might be contrary to recommendations issued by Choice Broking in the company research undertaken as the recommendations stated in this report is derived purely from technical analysis. Choice Broking has based this document on information obtained from sources it believes to be reliable but which it has not independently verified; Choice Broking makes no guarantee, representation or warranty and accepts no responsibility or liability as to its accuracy or completeness. The opinions contained within the report are based upon publicly available information at the time of publication and are subject to change without notice. The information and any disclosures provided herein are in summary form and have been prepared for informational purposes. The recommendations and suggested price levels are intended purely for trading purposes. The recommendations are valid for the day of the report however trading trends and volumes might vary substantially on an intraday basis and the recommendations may be subject to change. The information and any disclosures provided herein may be considered confidential. Any use, distribution, modification, copying, forwarding or disclosure by any person is strictly prohibited. The information and any disclosures provided herein do not constitute a solicitation or offer to purchase or sell any security or other financial product or instrument. The current performance may be unaudited. Past performance does not guarantee future returns. There can be no assurance that investments will achieve any targeted rates of return, and there is no guarantee against the loss of your entire investment. 
POTENTIAL CONFLICT OF INTEREST DISCLOSURE (as on date of report) Disclosure of interest statement – • Analyst interest of the stock /Instrument(s): - No. • Firm interest of the stock / Instrument (s): - No.

More Related Content

What's hot

Currency highlights 22.09.14
Currency highlights 22.09.14Currency highlights 22.09.14
Currency highlights 22.09.14
choice broking
 
Currency highlights 17.10.14
Currency highlights 17.10.14Currency highlights 17.10.14
Currency highlights 17.10.14
choice broking
 
Currency highlights 20.10.14
Currency highlights 20.10.14Currency highlights 20.10.14
Currency highlights 20.10.14
choice broking
 
Currency highlights 25.09.14
Currency highlights 25.09.14Currency highlights 25.09.14
Currency highlights 25.09.14
choice broking
 
Currency highlights 21.10.14
Currency highlights 21.10.14Currency highlights 21.10.14
Currency highlights 21.10.14
choice broking
 
Currency highlights 10.10.14
Currency highlights 10.10.14Currency highlights 10.10.14
Currency highlights 10.10.14
choice broking
 
Equity, Commodity Market Strategy of 1st July 2013 - iVentures Capital
Equity, Commodity Market Strategy of 1st July 2013 - iVentures CapitalEquity, Commodity Market Strategy of 1st July 2013 - iVentures Capital
Equity, Commodity Market Strategy of 1st July 2013 - iVentures Capital
iVentures Capital Pvt Ltd
 

What's hot (20)

Currency highlights 22.09.14
Currency highlights 22.09.14Currency highlights 22.09.14
Currency highlights 22.09.14
 
Currency highlights 17.10.14
Currency highlights 17.10.14Currency highlights 17.10.14
Currency highlights 17.10.14
 
Currency highlights 20.10.14
Currency highlights 20.10.14Currency highlights 20.10.14
Currency highlights 20.10.14
 
Currency highlights
Currency highlightsCurrency highlights
Currency highlights
 
Currency highlights
Currency highlightsCurrency highlights
Currency highlights
 
Currency highlights 25.09.14
Currency highlights 25.09.14Currency highlights 25.09.14
Currency highlights 25.09.14
 
Currency highlights 21.10.14
Currency highlights 21.10.14Currency highlights 21.10.14
Currency highlights 21.10.14
 
Currency highlights
Currency highlightsCurrency highlights
Currency highlights
 
Currency highlights
Currency highlightsCurrency highlights
Currency highlights
 
Currency highlights
Currency highlightsCurrency highlights
Currency highlights
 
Currency highlights 10.10.14
Currency highlights 10.10.14Currency highlights 10.10.14
Currency highlights 10.10.14
 
Currency highlights
Currency highlightsCurrency highlights
Currency highlights
 
February 22, 2015 with charts
February 22, 2015 with chartsFebruary 22, 2015 with charts
February 22, 2015 with charts
 
May 3, 2015 with charts
May 3, 2015 with chartsMay 3, 2015 with charts
May 3, 2015 with charts
 
Option Queen Newsletter July 20, 2014 with charts
Option Queen Newsletter July 20, 2014 with chartsOption Queen Newsletter July 20, 2014 with charts
Option Queen Newsletter July 20, 2014 with charts
 
April 12, 2015
April 12, 2015April 12, 2015
April 12, 2015
 
Equity, Commodity Market Strategy of 1st July 2013 - iVentures Capital
Equity, Commodity Market Strategy of 1st July 2013 - iVentures CapitalEquity, Commodity Market Strategy of 1st July 2013 - iVentures Capital
Equity, Commodity Market Strategy of 1st July 2013 - iVentures Capital
 
March 29, 2015 with charts
March 29, 2015 with chartsMarch 29, 2015 with charts
March 29, 2015 with charts
 
October 18, 2015 with charts
October 18, 2015 with chartsOctober 18, 2015 with charts
October 18, 2015 with charts
 
March 27, 2016.docx with charts
March 27, 2016.docx with chartsMarch 27, 2016.docx with charts
March 27, 2016.docx with charts
 

Viewers also liked

Equity bazaar 14.10.14
Equity bazaar 14.10.14Equity bazaar 14.10.14
Equity bazaar 14.10.14
choice broking
 
Equity bazaar 29.10.14
Equity bazaar 29.10.14Equity bazaar 29.10.14
Equity bazaar 29.10.14
choice broking
 
Currency highlights 07.11.14
Currency highlights 07.11.14Currency highlights 07.11.14
Currency highlights 07.11.14
choice broking
 
Equity bazaar 30.10.14
Equity bazaar 30.10.14Equity bazaar 30.10.14
Equity bazaar 30.10.14
choice broking
 
Equity bazaar 07.10.14
Equity bazaar 07.10.14Equity bazaar 07.10.14
Equity bazaar 07.10.14
choice broking
 
Currency highlights 29.09.14
Currency highlights 29.09.14Currency highlights 29.09.14
Currency highlights 29.09.14
choice broking
 
Equity bazaar 17.11.14
Equity bazaar 17.11.14Equity bazaar 17.11.14
Equity bazaar 17.11.14
choice broking
 
Currency highlights 31.10.14
Currency highlights 31.10.14Currency highlights 31.10.14
Currency highlights 31.10.14
choice broking
 
Currency highlights 18.11.14
Currency highlights 18.11.14Currency highlights 18.11.14
Currency highlights 18.11.14
choice broking
 
Equity bazaar 24.09.14
Equity bazaar 24.09.14Equity bazaar 24.09.14
Equity bazaar 24.09.14
choice broking
 

Viewers also liked (16)

Equity bazaar 14.10.14
Equity bazaar 14.10.14Equity bazaar 14.10.14
Equity bazaar 14.10.14
 
Equity bazaar 29.10.14
Equity bazaar 29.10.14Equity bazaar 29.10.14
Equity bazaar 29.10.14
 
Currency highlights 07.11.14
Currency highlights 07.11.14Currency highlights 07.11.14
Currency highlights 07.11.14
 
Aaj ka trend 17.11.14
Aaj ka trend 17.11.14Aaj ka trend 17.11.14
Aaj ka trend 17.11.14
 
Equity bazaar 30.10.14
Equity bazaar 30.10.14Equity bazaar 30.10.14
Equity bazaar 30.10.14
 
Aaj ka trend 07.10.14
Aaj ka trend 07.10.14Aaj ka trend 07.10.14
Aaj ka trend 07.10.14
 
Aaj ka trend 30.10.14
Aaj ka trend 30.10.14Aaj ka trend 30.10.14
Aaj ka trend 30.10.14
 
Equity bazaar 07.10.14
Equity bazaar 07.10.14Equity bazaar 07.10.14
Equity bazaar 07.10.14
 
Currency highlights 29.09.14
Currency highlights 29.09.14Currency highlights 29.09.14
Currency highlights 29.09.14
 
Equity bazaar 17.11.14
Equity bazaar 17.11.14Equity bazaar 17.11.14
Equity bazaar 17.11.14
 
Currency highlights 31.10.14
Currency highlights 31.10.14Currency highlights 31.10.14
Currency highlights 31.10.14
 
Currency highlights 18.11.14
Currency highlights 18.11.14Currency highlights 18.11.14
Currency highlights 18.11.14
 
Aaj ka trend 08.10.14
Aaj ka trend 08.10.14Aaj ka trend 08.10.14
Aaj ka trend 08.10.14
 
Aaj ka trend
Aaj ka trendAaj ka trend
Aaj ka trend
 
Aaj ka trend
Aaj ka trendAaj ka trend
Aaj ka trend
 
Equity bazaar 24.09.14
Equity bazaar 24.09.14Equity bazaar 24.09.14
Equity bazaar 24.09.14
 

Similar to Cur241120140912141 (13)

Currency highlights 08.10.14
Currency highlights 08.10.14Currency highlights 08.10.14
Currency highlights 08.10.14
 
Currency highlights 01.10.14
Currency highlights 01.10.14Currency highlights 01.10.14
Currency highlights 01.10.14
 
Currency highlights 07.10.14
Currency highlights 07.10.14Currency highlights 07.10.14
Currency highlights 07.10.14
 
Currency highlights 26.09.14
Currency highlights 26.09.14Currency highlights 26.09.14
Currency highlights 26.09.14
 
Currency Highlights 30.09.14
Currency Highlights 30.09.14Currency Highlights 30.09.14
Currency Highlights 30.09.14
 
Currency highlights
Currency highlightsCurrency highlights
Currency highlights
 
Currency highlights
Currency highlightsCurrency highlights
Currency highlights
 
Currency highlights
Currency highlightsCurrency highlights
Currency highlights
 
Currency highlights
Currency highlightsCurrency highlights
Currency highlights
 
Equity bazaar 07.11.14
Equity bazaar 07.11.14Equity bazaar 07.11.14
Equity bazaar 07.11.14
 
Techno buy dlinkindia
Techno buy dlinkindiaTechno buy dlinkindia
Techno buy dlinkindia
 
Equity bazaar 12.11.14
Equity bazaar 12.11.14Equity bazaar 12.11.14
Equity bazaar 12.11.14
 
Techno Sell: EURINR
Techno Sell: EURINRTechno Sell: EURINR
Techno Sell: EURINR
 

Cur241120140912141

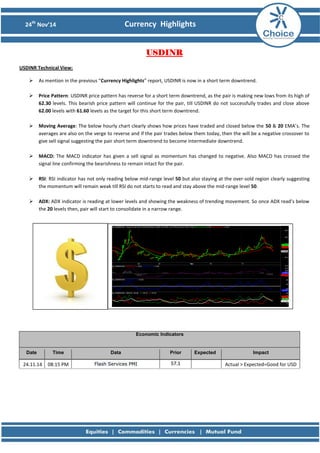
  • 1. 24th Nov’14 Currency Highlights USDINR USDINR Technical View:  As mention in the previous “Currency Highlights” report, USDINR is now in a short term downtrend.  Price Pattern: USDINR price pattern has reverse for a short term downtrend, as the pair is making new lows from its high of 62.30 levels. This bearish price pattern will continue for the pair, till USDINR do not successfully trades and close above 62.00 levels with 61.60 levels as the target for this short term downtrend.  Moving Average: The below hourly chart clearly shows how prices have traded and closed below the 50 & 20 EMA’s. The averages are also on the verge to reverse and if the pair trades below them today, then the will be a negative crossover to give sell signal suggesting the pair short term downtrend to become intermediate downtrend.  MACD: The MACD indicator has given a sell signal as momentum has changed to negative. Also MACD has crossed the signal line confirming the bearishness to remain intact for the pair.  RSI: RSI indicator has not only reading below mid-range level 50 but also staying at the over-sold region clearly suggesting the momentum will remain weak till RSI do not starts to read and stay above the mid-range level 50.  ADX: ADX indicator is reading at lower levels and showing the weakness of trending movement. So once ADX read’s below the 20 levels then, pair will start to consolidate in a narrow range. Economic Indicators Date Time Data Prior Expected Impact 24.11.14 08:15 PM Flash Services PMI 57.1 Actual > Expected=Good for USD
  • 2. 24th Nov’14 Currency Highlights EURINR EURINR Technical View:  EURINR acted as per our view and the pair is now back to its major downtrend.  Price Pattern: The short term uptrend of the pair reversed to its previous major downtrend. The price pattern is now very bearish for the pair, till there is no confirm reversal to upside. In the coming trading session, the pair will observe more weakness if USDINR trades below 61.60 levels as per inter-market correlation between both pairs.  Moving Average: The 50 & 20 EMA’S has given the sell signal with negative crossover and this sell signal will remain valid till prices do not reverse for the buy signal generated by the averages.  MACD: The indicator sell signal will strongly remain valid as it reading below the signal line. If MACD reverse to give buy signal then it can be strictly ignore as the major downtrend exists.  RSI: Weak momentum is active for the pair, as RSI is reading at the over-sold region. The RSI will continue to read it for negative momentum for the pair till price do not reverse for intermediate uptrend.  ADX: Trending phase is active for the pair is its reading well above the 20 levels. The pair will observe a higher price range till the trending phase remains intact for the pair. Economic Indicators Date Time Data Prior Expected Impact 24.11.14 24-28TH German Import Prices m/m 0.3% Actual > Expected=Good for EUR 24.11.14 24-28TH Nationwide HPI m/m 103.2 Actual > Expected=Good for EUR 24.11.14 02:30 PM German Ifo Business Climate -6.8 Actual > Expected=Good for EUR
  • 3. 24th Nov’14 Currency Highlights GBPINR GBPINR Technical View:  With the downtrend in USDINR& EURINR pair, GBPINR following both the pairs.  Price Pattern: GBPINR also resumes back to its major downtrend and the overall pattern looks bearish for the pair. The pair will observe weakness in the coming trading session as GBPUSD pair remains weak as its strong correlation exits with GBPINR.  Moving Average: As per our view GBPINR traded and closed below both the averages making the pair bearish and also there is a negative crossover of both the averages suggesting the major downtrend will exits for the pair till prices closes below both the averages.  MACD: MACD sell signal strongly remains valid going with the trend. So traders can wait for a new sell signal to be generated to remain with the trend and ignoring any buy signal.  RSI: The indicator is reading well below the mid-range level 50 and soon to read and stay at the over-sold region. RSI indicator clearly indicates bearishness will continue for the pair.  ADX: ADX indicator is indicating the trending phase to remain valid for the pair. The pair will make new lows in coming trading session with ADX reading at higher values. Economic Indicators Date Time Data Prior Expected Impact 24.11.14 24-28TH Nationwide HPI m/m 0.5% Actual > Expected=Good for GBP
  • 4. 24th Nov’14 Currency Highlights JPYINR JPYINR Technical View:  The pair continues to remain in tis strong downtrend and will observe more weakness following the above currencies.  Price Pattern: The bearish price pattern continues to remain valid as the pair consolidates in a range. Our suggestion will be not to trade in the pair, till it does not show the sign of reversal and ending its current consolidation phase in a downtrend.  Moving Average: There will be no sign of reversal for the pair till it do not trades above both 50 & 20 EMA’s on hourly basis.  MACD: Since the major downtrend exits for the pair, it will be better to consider only the sell signal generated by the indicator.  RSI: RSI indicator has made many attempts but failed to read and stay above the mid-range level 50. This strong suggest the current negative momentum will exist in the pair till RSI do not successfully reads and stay above the mid-range level 50.  ADX: ADX is reading very close to the 20 levels. So this suggest that if ADX starts to read below this level then the pair can continue its consolidation movement for few day before showing a trending movement. Economic Indicators Date Time Data Prior Expected Impact 24.11.14 No Data For JPY Today
  • 5. 24th Nov’14 Currency Highlights Amit Pawar (Research Associate) amit.pawar@choiceindia.com Rohan Shinde (Research Associate) rohan.shinde@choiceindia.com Deveya Gaglani (Research Advisor) deveya.gaglani@chocieindia.com For Private Circulation Only Website: www.choiceindia.com https://twitter.com/ChoiceBroking https://plus.google.com/115293033595831069270/posts https://www.youtube.com/user/ChoiceBroking http://www.slideshare.net/choiceindiabroking https://www.facebook.com/choicebroking https://www.linkedin.com/company/choice-international-limited
  • 6. 24th Nov’14 Currency Highlights Disclaimer This is solely for information of clients of Choice Broking and does not construe to be an investment advice. It is also not intended as an offer or solicitation for the purchase and sale of any financial instruments. Any action taken by you on the basis of the information contained herein is your responsibility alone and Choice Broking its subsidiaries or its employees or associates will not be liable in any manner for the consequences of such action taken by you. We have exercised due diligence in checking the correctness and authenticity of the information contained in this recommendation, but Choice Broking or any of its subsidiaries or associates or employees shall not be in any way responsible for any loss or damage that may arise to any person from any inadvertent error in the information contained in this recommendation or any action taken on basis of this information. Technical analysis studies market psychology, price patterns and volume levels. It is used to forecast future price and market movements. Technical analysis is complementary to fundamental analysis and news sources. The recommendations issued here with might be contrary to recommendations issued by Choice Broking in the company research undertaken as the recommendations stated in this report is derived purely from technical analysis. Choice Broking has based this document on information obtained from sources it believes to be reliable but which it has not independently verified; Choice Broking makes no guarantee, representation or warranty and accepts no responsibility or liability as to its accuracy or completeness. The opinions contained within the report are based upon publicly available information at the time of publication and are subject to change without notice. The information and any disclosures provided herein are in summary form and have been prepared for informational purposes. The recommendations and suggested price levels are intended purely for trading purposes. The recommendations are valid for the day of the report however trading trends and volumes might vary substantially on an intraday basis and the recommendations may be subject to change. The information and any disclosures provided herein may be considered confidential. Any use, distribution, modification, copying, forwarding or disclosure by any person is strictly prohibited. The information and any disclosures provided herein do not constitute a solicitation or offer to purchase or sell any security or other financial product or instrument. The current performance may be unaudited. Past performance does not guarantee future returns. There can be no assurance that investments will achieve any targeted rates of return, and there is no guarantee against the loss of your entire investment. POTENTIAL CONFLICT OF INTEREST DISCLOSURE (as on date of report) Disclosure of interest statement – • Analyst interest of the stock /Instrument(s): - No. • Firm interest of the stock / Instrument (s): - No.