1. 05th Nov’14 Aaj Ka Trend
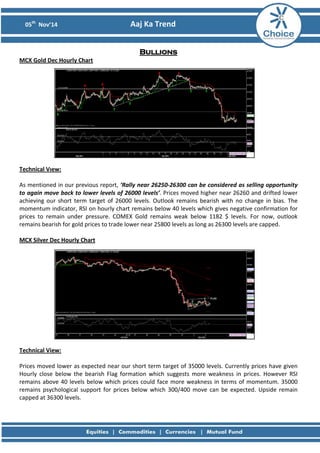
Bullions MCX Gold Dec Hourly Chart
Technical View: As mentioned in our previous report, ‘Rally near 26250-26300 can be considered as selling opportunity to again move back to lower levels of 26000 levels’. Prices moved higher near 26260 and drifted lower achieving our short term target of 26000 levels. Outlook remains bearish with no change in bias. The momentum indicator, RSI on hourly chart remains below 40 levels which gives negative confirmation for prices to remain under pressure. COMEX Gold remains weak below 1182 $ levels. For now, outlook remains bearish for gold prices to trade lower near 25800 levels as long as 26300 levels are capped. MCX Silver Dec Hourly Chart
Technical View: Prices moved lower as expected near our short term target of 35000 levels. Currently prices have given Hourly close below the bearish Flag formation which suggests more weakness in prices. However RSI remains above 40 levels below which prices could face more weakness in terms of momentum. 35000 remains psychological support for prices below which 300/400 move can be expected. Upside remain capped at 36300 levels.
2. 05th Nov’14 Aaj Ka Trend
Fundamental News:
• Gold trades near lowest since July 2010 on Fed rate outlook.
• Gold prices hovered near the lowest level in more than four years on Tuesday, as optimism over the strength of the U.S. economy and fuelled expectations that the Federal Reserve will begin to raise rates sooner than previously thought.
• On the Comex division of the New York Mercantile Exchange, gold futures for December delivery traded at $1.166.00 a troy ounce during European morning hours, down $3.80, or 0.32%
Pivot Levels for the Day:
S1
S2
S3
Pivot
R1
R2
R3
Gold
25853
25743
25466
26020
26130
26297
26574
Silver
35287
35078
34608
35548
35757
36018
36488
Recommendation:
Gold
Sell
Silver
Sell
3. 05th Nov’14 Aaj Ka Trend
Base Metals MCX Copper Nov Hourly Chart
Technical Views: Prices have broken its support of 414.50 levels and drifted lower, achieving our both the short term targets of 411 and 409 levels. The momentum indicator, RSI has also fallen below 40 levels which indicate lack of momentum in prices. COMEX Copper prices have broken its support of 3.040$ levels which would add bearishness in prices. For now, Prices can drift lower towards 408 below which 405 levels are expected upside remains capped near 413 levels.
MCX Aluminum Nov Daily Chart
MCX Lead Nov Daily Chart
MCX Nickel Nov Hourly Chart
MCX Zinc Nov Hourly Chart
4. 05th Nov’14 Aaj Ka Trend
Fundamental News:
• Copper futures fluctuate after EU cuts growth forecasts • Copper prices swung between small gains and losses on Tuesday, as investors assessed the need for further stimulus measures by the European Central Bank.
• On the Comex division of the New York Mercantile Exchange, copper for December delivery traded at $3.067 a pound during European morning hours, up 0.2 cents, or 0.08%
Pivot Levels for the Day:
S1
S2
S3
Pivot
R1
R2
R3
Copper
407.0
404.2
397.1
411.3
414.1
418.4
425.5
Aluminum
126.0
125.0
122.9
127.2
128.1
129.3
131.5
Lead
122.2
121.4
119.1
123.6
124.5
125.9
128.1
Nickel
926.1
914.7
883.3
946.1
957.5
977.5
1008.9
Zinc
137.3
135.9
132.1
139.8
141.2
143.6
147.5
Recommendation:
Copper
Sell
Aluminum
Buy
Lead
Sell
Nickel
Sell
Zinc
Sell
5. 05th Nov’14 Aaj Ka Trend
Energy MCX Crude Nov Hourly Chart:
Technical Views: Crude prices gapped lower almost near its lower circuit levels. NYMEX Crude prices made its intraday low of 75.91$ levels which was expected and mentioned in our report, ‘NYMEX Crude has an immediate support at 79.20$ below which 3$ fall could be expected.’ Outlook remains bearish as MCX crude prices are trading in bearish flag formation after steep fall from 4951 to 4691 levels. Hourly close below 4710 would confirm the bearish flag formation which can drift prices lower near 4630 levels. MCX Natural Gas Oct Hourly Chart:
Technical Views: As expected, prices moved higher achieving our both the short term targets 244/246 levels. It can be observed from the above chart that the prices are trading in higher top higher bottom levels while taking support of uptrend line. The momentum indicator, RSI is also above 60 levels which gives positive confirmation for prices to trade higher. For now, as long as uptrend line is protected, prices can head higher towards 260/262 levels.
6. 05th Nov’14 Aaj Ka Trend
Fundamental News:
• Natural gas futures rally to 1-month high on demand hopes
• U.S. natural gas prices rallied to hit a fresh one-month high on Tuesday, as investors bet that chilly weather across the U.S. will boost early-winter demand for the heating fuel.
• On the New York Mercantile Exchange, natural gas for delivery in December rose to a session high of $4.104 per million British thermal units, the most since October 1
• WTI, Brent oil plunge to multi-year lows after Saudi Arabia cuts prices.
• West Texas Intermediate and Brent oil futures lost more than 2% on Tuesday, after Saudi Arabia lowered prices to buyers in the U.S. and amid ongoing concerns over the health of the global economy.
Pivot Levels for the Day:
S1
S2
S3
Pivot
R1
R2
R3
Crude
4624
4528
4268
4788
4884
5048
5308
Natural Gas
214.4
226.5
217.5
235.5
223.4
244.5
253.5
Recommendation:
Crude
Sell
Natural Gas
Buy
8. 05th Nov’14 Aaj Ka Trend
This is solely for information of clients of Choice Broking and does not construe to be an investment advice. It is also not intended as an offer or solicitation for the purchase and sale of any financial instruments. Any action taken by you on the basis of the information contained herein is your responsibility alone and Choice Broking its subsidiaries or its employees or associates will not be liable in any manner for the consequences of such action taken by you. We have exercised due diligence in checking the correctness and authenticity of the information contained in this recommendation, but Choice Broking or any of its subsidiaries or associates or employees shall not be in any way responsible for any loss or damage that may arise to any person from any inadvertent error in the information contained in this recommendation or any action taken on basis of this information. Technical analysis studies market psychology, price patterns and volume levels. It is used to forecast future price and market movements. Technical analysis is complementary to fundamental analysis and news sources. The recommendations issued herewith might be contrary to recommendations issued by Choice Broking in the company research undertaken as the recommendations stated in this report is derived purely from technical analysis. Choice Broking has based this document on information obtained from sources it believes to be reliable but which it has not independently verified; Choice Broking makes no guarantee, representation or warranty and accepts no responsibility or liability as to its accuracy or completeness. The opinions contained within the report are based upon publicly available information at the time of publication and are subject to change without notice. The information and any disclosures provided herein are in summary form and have been prepared for informational purposes. The recommendations and suggested price levels are intended purely for trading purposes. The recommendations are valid for the day of the report however trading trends and volumes might vary substantially on an intraday basis and the recommendations may be subject to change. The information and any disclosures provided herein may be considered confidential. Any use, distribution, modification, copying, forwarding or disclosure by any person is strictly prohibited. The information and any disclosures provided herein do not constitute a solicitation or offer to purchase or sell any security or other financial product or instrument. The current performance may be unaudited. Past performance does not guarantee future returns. There can be no assurance that investments will achieve any targeted rates of return, and there is no guarantee against the loss of your entire investment. POTENTIAL CONFLICT OF INTEREST DISCLOSURE (as on date of report) Disclosure of interest statement – • Analyst interest of the stock /Instrument(s): - No. • Firm interest of the stock / Instrument (s): - No.
Disclaimer