1. 30th Oct’14 Equity Bazaar
Nifty
Nifty Technical View:
Nifty prices have given gap up opening; during trading secession, Nifty prices are trading in the sideways consolidation formation where upper range and lower range are 8073/8095 respectively.
Moving Average: On Hourly chart Nifty prices have traded above 50 SMA at (8004) levels and 100 SMA (7977) levels.
ADX: The ADX indicator is above 25 levels were as the direction of +DI is greater than –DI which suggest biased are positive.
RSI: RSI is above 70 levels which suggest upside is still left, and the Nifty can touch new high.
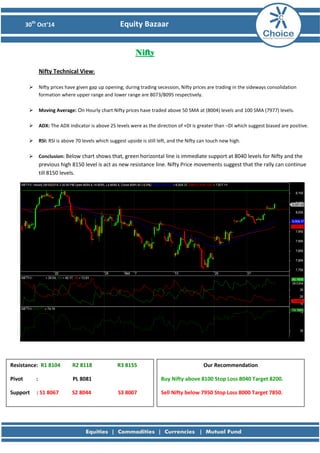
Conclusion: Below chart shows that, green horizontal line is immediate support at 8040 levels for Nifty and the previous high 8150 level is act as new resistance line. Nifty Price movements suggest that the rally can continue till 8150 levels.
Resistance: R1 8104 R2 8118 R3 8155
Pivot : PL 8081
Support : S1 8067 S2 8044 S3 8007
Our Recommendation
Buy Nifty above 8100 Stop Loss 8040 Target 8200.
Sell Nifty below 7950 Stop Loss 8000 Target 7850.
2. 30th Oct’14 Equity Bazaar
Bank Nifty
Bank Nifty Technical View:
Bank Nifty prices have given gap up opening but failed to sustain at higher levels and drifted lower.
Moving Average: On Hourly chart Bank Nifty have traded above 50 SMA (16472) & 100 SMA (16240) levels. 50 SMA (16472) levels could act as strong support for Bank Nifty.
MACD: On hourly charts MACD has formed negative divergence which would be confirmed when prices falls below 50 SMA (16472) levels.
RSI: RSI has slipped below 60 levels. Currently RSI is in 56 levels which suggest sideway trend.
Conclusion: Bank Nifty prices are moving in sideway trend therefore hike could be used as selling opportunities.
Resistance: R1 16759 R2 16869 R3 17064
Pivot : PL 16674
Support : S1 16564 S2 16479 S3 16284
Our Recommendation
Buy BNF above 16800 Stop Loss 16700 Target: 17000.
Sell BNF below 16300 Stop Loss 16400 Target: 15900.
3. 30th Oct’14 Equity Bazaar
Stock of the Day
Reliance Ind View:
After minor correction in Reliance Industries is ready to give downward trend line breakout.
Moving Average: On hourly chart prices are treading above 50 SMA (947) and 100 SMA (944) levels, 50 SMA (944) levels could act as immediate support.
MACD: On hourly charts MACD signal and MACD histograms has turn negative to positive positive which is positive sign for price.
RSI: RSI has sustained above 60 levels if sentiment will favorable for price then RSI will reach 70 levels.
Conclusion: In short term, if prices will sustain above yellow horizontal line (956) levels then rally could continue till 980 levels.
Resistance: R1 958 R2 965 R3 984
Pivot : PL 946
Support : S1 940 S2 927 S3 907
Our Recommendation
Buy RELIND above 956 Stop Loss 943 Target: 980
4. 30th Oct’14 Equity Bazaar
Derivative Analysis FIIS Data: FII’s are net Rs 785.61 Cr Buyers on 29th October 2014 and Dll’s are the net Rs 507.29 Cr Sellers on 29th October 2014. Option Data: 8100 CE has the highest OI with 64 lakhs and 8200 CE has the second highest OI with 54 lakhs and 8000 PE has the highest OI with 61 lakhs and 7900 PE has the second highest OI with 47 lakhs. Open Interest: The above options data shows that nifty has strong support at 7900 and has resistance at 8200. The change in level will take place once when NIFTY prices breaks 8000 mark. Intraday Option Strategy: (A) Buy Nifty 8100 calls and Sell Nifty 8200 puts if buy level is breached. (B) Sell Nifty 7900 calls and Buy Nifty 8000 puts if sell level is breached.
7. 30th Oct’14 Equity Bazaar
Disclaimer
This is solely for information of clients of Choice India and does not construe to be an investment advice. It is also not intended as an offer or solicitation for the purchase and sale of any financial instruments. Any action taken by you on the basis of the information contained herein is your responsibility alone and Choice India its subsidiaries or its employees or associates will not be liable in any manner for the consequences of such action taken by you. We have exercised due diligence in checking the correctness and authenticity of the information contained in this recommendation, but Choice India or any of its subsidiaries or associates or employees shall not be in any way responsible for any loss or damage that may arise to any person from any inadvertent error in the information contained in this recommendation or any action taken on basis of this information. Technical analysis studies market psychology, price patterns and volume levels. It is used to forecast future price and market movements. Technical analysis is complementary to fundamental analysis and news sources. The recommendations issued herewith might be contrary to recommendations issued by Choice India in the company research undertaken as the recommendations stated in this report is derived purely from technical analysis. Choice India has based this document on information obtained from sources it believes to be reliable but which it has not independently verified; Choice India makes no guarantee, representation or warranty and accepts no responsibility or liability as to its accuracy or completeness. The opinions contained within the report are based upon publicly available information at the time of publication and are subject to change without notice. The information and any disclosures provided herein are in summary form and have been prepared for informational purposes. The recommendations and suggested price levels are intended purely for trading purposes. The recommendations are valid for the day of the report however trading trends and volumes might vary substantially on an intraday basis and the recommendations may be subject to change. The information and any disclosures provided herein may be considered confidential. Any use, distribution, modification, copying, forwarding or disclosure by any person is strictly prohibited. The information and any disclosures provided herein do not constitute a solicitation or offer to purchase or sell any security or other financial product or instrument. The current performance may be unaudited. Past performance does not guarantee future returns. There can be no assurance that investments will achieve any targeted rates of return, and there is no guarantee against the loss of your entire investment.
POTENTIAL CONFLICT OF INTEREST DISCLOSURE (as on date of report) Disclosure of interest statement – • Analyst interest of the stock /Instrument(s): - No. • Firm interest of the stock / Instrument (s): - No.