
Recommended
More Related Content
What's hot
What's hot (20)
Similar to Aaj ka trend 31.05.16
Similar to Aaj ka trend 31.05.16 (20)
Recently uploaded
Recently uploaded (20)
Aaj ka trend 31.05.16
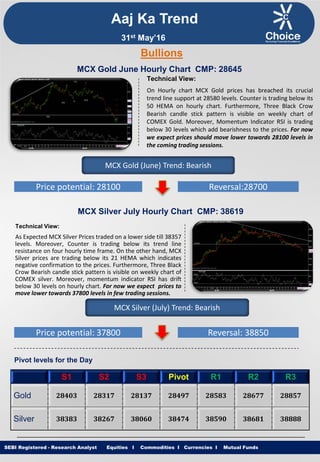
- 1. Equities I Commodities I Currencies I Mutual Funds Aaj Ka Trend Technical View: On Hourly chart MCX Gold prices has breached its crucial trend line support at 28580 levels. Counter is trading below its 50 HEMA on hourly chart. Furthermore, Three Black Crow Bearish candle stick pattern is visible on weekly chart of COMEX Gold. Moreover, Momentum Indicator RSI is trading below 30 levels which add bearishness to the prices. For now we expect prices should move lower towards 28100 levels in the coming trading sessions. SEBI Registered - Research Analyst Equities I Commodities I Currencies I Mutual Funds Bullions MCX Gold June Hourly Chart CMP: 28645 MCX Gold (June) Trend: Bearish Price potential: 28100 Reversal:28700 MCX Silver July Hourly Chart CMP: 38619 Technical View: As Expected MCX Silver Prices traded on a lower side till 38357 levels. Moreover, Counter is trading below its trend line resistance on four hourly time frame. On the other hand, MCX Silver prices are trading below its 21 HEMA which indicates negative confirmation to the prices. Furthermore, Three Black Crow Bearish candle stick pattern is visible on weekly chart of COMEX silver. Moreover, momentum indicator RSI has drift below 30 levels on hourly chart. For now we expect prices to move lower towards 37800 levels in few trading sessions. MCX Silver (July) Trend: Bearish Price potential: 37800 Reversal: 38850 Pivot levels for the Day S1 S2 S3 Pivot R1 R2 R3 Gold 28403 28317 28137 28497 28583 28677 28857 Silver 38383 38267 38060 38474 38590 38681 38888 31st May’16
- 2. Equities I Commodities I Currencies I Mutual Funds Technical View: On Hourly chart MCX Copper prices are trading in rising channel formation. However, MCX Copper prices are trading near its upward rising trend line support on hourly chart which indicates bulls to resume its uptrend. Furthermore, Counter is trading above its 100 HEMA on hourly time frame. On the other hand, momentum indicator RSI is trading near its support of 40 levels on hourly chart. For now we expect prices to move higher towards 322 levels in coming trading sessions. SEBI Registered - Research Analyst Equities I Commodities I Currencies I Mutual Funds MCX Copper June hourly Chart CMP: 312.50 MCX Copper (June) Trend: Bullish Price potential: 322 Reversal: 308 MCX Crude Oil June. Hourly Chart CMP: 3374 Technical View: On Hourly chart MCX Crude Oil prices are trading in rising channel formation. Moreover prices has formed higher top higher bottom formation on hourly basis. On the other hand counter is trading above its 100 HEMA on MCX Crude Oil hourly chart. Furthermore, COMEX Crude prices are trading above its trend line support. Moreover, MACD Indicator has witnessed positive crossover on hourly chart. For now we expect prices to move higher towards 3420 levels in coming trading sessions. MCX Crude Oil (June) Trend: Bullish Price potential: 3420 Reversal: 3280 Pivot levels for the Day S1 S2 S3 Pivot R1 R2 R3 Copper 312.4 311.8 310.2 313.4 314.0 315.0 316.6 Crude 3314 3299 3273 3325 3340 3351 3377 Base Metal Energy Aaj Ka Trend 31st May’16
- 3. Equities I Commodities I Currencies I Mutual FundsSEBI Registered - Research Analyst Equities I Commodities I Currencies I Mutual Funds Other Base Metals & Energy S1 S2 S3 Pivot R1 R2 R3 Trend Copper 312.4 311.8 310.2 313.4 314.0 315.0 316.6 Aluminum 103.6 103.4 103.1 103.8 103.9 104.1 104.5 Lead 113.4 113.1 112.5 113.7 114.0 114.3 114.9 Nickel 559.6 557.8 553.8 561.8 563.6 565.8 569.8 Zinc 127.3 126.9 125.9 127.8 128.2 128.8 129.7 Natural Gas 145.4 144.5 142.9 146.1 147.0 147.7 149.3 Fundamental News: Gold fell in Asia on Monday with markets in the U.S. and U.K. shut for holidays and investors focused on a possible Fed interest rate hike as early as next month. Gold futures fell sharply in European trade on Monday, dropping below the key $1,200-level for the first time since February as investors continued to factor in an increased chance of a near-term U.S. interest rate rise. Gold futures trimmed overnight losses in North American trade on Monday, after dropping below the key $1,200-level for the first time since February as investors continued to factor in an increased chance of a near- term U.S. interest rate rise. Oil prices were modestly lower in quiet European trade on Monday, as a broadly stronger U.S. dollar prompted market players to lock in gains from a recent rally which took prices above the key $50-level. Saudi Arabia, Kuwait, Iran and U.A.E. are also planning to increase supplies later this year. The recent recovery in oil prices has dampened expectations OPEC will curb supplies at Thursday's meeting. Oil futures were lower on Monday as the dollar strengthened, with trading expected to be light due to holidays in the U.K. and the U.S. Oil prices were slightly lower in North American trade on Monday, as market players focused on an improving global supply outlook. Oil prices edged lower toward $49 a barrel on Monday as Iraq raised its crude exports target ahead of an OPEC meeting while Canadian production was set to restart after huge wildfires. U.S. natural gas futures edged lower in holiday-thinned trade on Monday, after the latest U.S. weather model called for mild summer temperatures over the next two weeks, which should increase cooling demand during that time. Aaj Ka Trend 31st May’16
- 4. Equities I Commodities I Currencies I Mutual FundsSEBI Registered - Research Analyst Equities I Commodities I Currencies I Mutual Funds International Market Commodity Closing Price Gold 1211.05 Silver 16.04 Crude Oil 49.46 Brent Crude Oil 49.65 Natural Gas 2.17 COMEX/NYMEX/ICE ( Precious Metals & Energy) Currency & Commodity Index Currency (Spot) Current Price USD / INR 67.16 Dollar Index 95.72 EUR / USD 1.1147 CRB Index* 186.13 Closing as on 30.05.16 *Closing as on 30.05.16 LME (Base Metals) ( $ per tones) Commodity Closing Price Copper 4695 Aluminum 1556 Zinc 1899 Lead 1699 Nickel 8420 SHFE (Base Metals) (Yuan per tones) Commodity Closing Price Copper 35810 Aluminum 12340 Zinc 15075 Lead 12800 Closing as on 30.05.16 Closing as on 30.05.16 LME INVENTORY DATA Aaj Ka Trend 24-May-16 25-May-16 26-May-16 27-May-16 30-May-16 Aluminium -5550 -5375 -4425 -5900 0 Copper 2250 -2000 725 -2225 0 Lead 5575 5575 -275 -25 0 Nickel -384 -630 -978 1848 0 Zinc -100 -600 -50 -2025 0 31st May’16
- 5. Equities I Commodities I Currencies I Mutual Funds This is solely for information of clients of Choice Broking and does not construe to be an investment advice. It is also not intended as an offer or solicitation for the purchase and sale of any financial instruments. Any action taken by you on the basis of the information contained herein is your responsibility alone and Choice Broking its subsidiaries or its employees or associates will not be liable in any manner for the consequences of such action taken by you. We have exercised due diligence in checking the correctness and authenticity of the information contained in this recommendation, but Choice Broking or any of its subsidiaries or associates or employees shall not be in any way responsible for any loss or damage that may arise to any person from any inadvertent error in the information contained in this recommendation or any action taken on basis of this information. Technical analysis studies market psychology, price patterns and volume levels. It is used to forecast future price and market movements. Technical analysis is complementary to fundamental analysis and news sources. The recommendations issued herewith might be contrary to recommendations issued by Choice Broking in the company research undertaken as the recommendations stated in this report is derived purely from technical analysis. Choice Broking has based this document on information obtained from sources it believes to be reliable but which it has not independently verified; Choice Broking makes no guarantee, representation or warranty and accepts no responsibility or liability as to its accuracy or completeness. The opinions contained within the report are based upon publicly available information at the time of publication and are subject to change without notice. The information and any disclosures provided herein are in summary form and have been prepared for informational purposes. The recommendations and suggested price levels are intended purely for trading purposes. The recommendations are valid for the day of the report however trading trends and volumes might vary substantially on an intraday basis and the recommendations may be subject to change. The information and any disclosures provided herein may be considered confidential. Any use, distribution, modification, copying, forwarding or disclosure by any person is strictly prohibited. The information and any disclosures provided herein do not constitute a solicitation or offer to purchase or sell any security or other financial product or instrument. The current performance may be unaudited. Past performance does not guarantee future returns. There can be no assurance that investments will achieve any targeted rates of return, and there is no guarantee against the loss of your entire investment. POTENTIAL CONFLICT OF INTEREST DISCLOSURE (as on date of report) Disclosure of interest statement – • Analyst interest of the stock /Instrument(s): - No. • Firm interest of the stock / Instrument (s): - No. Disclaimer Contact Us Amit Pathania Research Associate amit.pathania@choiceindia.com Rohan Patil Research Associate rohan.patil@choiceindia.com www.choiceindia.comcustomercare@choiceindia.com SEBI Registered - Research Analyst Equities I Commodities I Currencies I Mutual Funds Aaj Ka Trend 31st May’16 Neeraj Yadav Research Advisor neeraj.yadav@choiceindia.com Anish Vyas Senior Research Associate anish.vyas@choiceindia.com Anish Vyas Digitally signed by Anish Vyas DN: cn=Anish Vyas, o=Choice Merchandise Broking Pvt. Ltd, ou=Sr. Research Associate, email=anish.vyas@choiceindia.com, c=IN Date: 2016.05.31 08:46:15 +05'30'