
Recommended
More Related Content
What's hot
What's hot (20)
Viewers also liked
Viewers also liked (16)
Similar to Aaj ka trend 30.12.16
Similar to Aaj ka trend 30.12.16 (20)
Recently uploaded
Recently uploaded (20)
Aaj ka trend 30.12.16
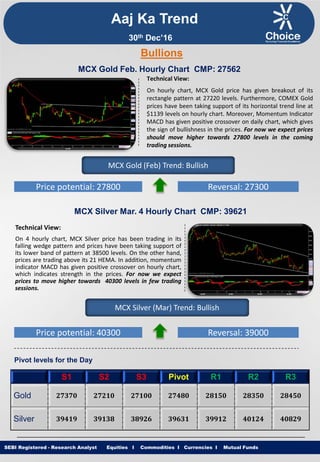
- 1. Equities I Commodities I Currencies I Mutual Funds Aaj Ka Trend Technical View: On hourly chart, MCX Gold price has given breakout of its rectangle pattern at 27220 levels. Furthermore, COMEX Gold prices have been taking support of its horizontal trend line at $1139 levels on hourly chart. Moreover, Momentum Indicator MACD has given positive crossover on daily chart, which gives the sign of bullishness in the prices. For now we expect prices should move higher towards 27800 levels in the coming trading sessions. SEBI Registered - Research Analyst Equities I Commodities I Currencies I Mutual Funds Bullions MCX Gold Feb. Hourly Chart CMP: 27562 MCX Gold (Feb) Trend: Bullish Price potential: 27800 Reversal: 27300 MCX Silver Mar. 4 Hourly Chart CMP: 39621 Technical View: On 4 hourly chart, MCX Silver price has been trading in its falling wedge pattern and prices have been taking support of its lower band of pattern at 38500 levels. On the other hand, prices are trading above its 21 HEMA. In addition, momentum indicator MACD has given positive crossover on hourly chart, which indicates strength in the prices. For now we expect prices to move higher towards 40300 levels in few trading sessions. MCX Silver (Mar) Trend: Bullish Price potential: 40300 Reversal: 39000 Pivot levels for the Day S1 S2 S3 Pivot R1 R2 R3 Gold 27370 27210 27100 27480 28150 28350 28450 Silver 39419 39138 38926 39631 39912 40124 40829 30th Dec’16
- 2. Equities I Commodities I Currencies I Mutual Funds Technical View: MCX Copper price has been trading in falling channel pattern and prices have been taking support of its lower band of channel pattern at 366 levels on hourly chart. In addition MCX Copper prices are trading above its 21 HEMA. Furthermore, momentum indicator RSI has remained above 60 levels on hourly time frame, which suggest further upside momentum can be seen. For now we expect prices to move higher towards 387 levels in coming trading sessions. SEBI Registered - Research Analyst Equities I Commodities I Currencies I Mutual Funds MCX Copper Feb. hourly Chart CMP: 374.40 MCX Copper (Feb) Trend: Bullish Price potential: 387 Reversal: 369 MCX Crude Oil Jan. Hourly Chart CMP: 3665 Technical View: MCX Crude Oil prices has given breakdown of its rising wedge pattern at 3670 levels on hourly chart. MCX Crude Oil is trading below its 21 HEMA on hourly chart. On the other hand, NYMEX WTI Crude oil price has shown breakdown of its rising trend line at $53.90 levels. Moreover, Momentum indicator RSI is trading below 50 levels on hourly chart which suggest the negative movement in the prices. For now we expect prices to move lower towards 3560 levels in coming trading sessions. MCX Crude Oil (Jan) Trend: Bearish Price potential: 3560 Reversal: 3710 Pivot levels for the Day S1 S2 S3 Pivot R1 R2 R3 Copper 372.4 369.9 365.8 376.5 379.0 383.1 393.7 Crude 3636 3620 3590 3666 3682 3712 3788 Base Metal Energy Aaj Ka Trend 30th Dec’16
- 3. Equities I Commodities I Currencies I Mutual FundsSEBI Registered - Research Analyst Equities I Commodities I Currencies I Mutual Funds Other Base Metals & Energy S1 S2 S3 Pivot R1 R2 R3 Trend Copper 372.4 369.9 365.8 376.5 379.0 383.1 393.7 Aluminum 114.8 114.0 112.8 116.0 116.8 118.0 121.3 Lead 130.0 127.5 123.0 134.5 137.0 141.5 153.0 Nickel 677.8 671.1 663.8 685.1 691.8 699.1 720.4 Zinc 168.6 166.6 163.1 172.1 174.0 177.5 186.5 Natural Gas 253.7 250.4 245.2 258.9 262.2 267.4 281.1 Fundamental News: Gold futures aimed for a fourth-straight advance Thursday, trading at two-week highs and trimming a roughly 2% December decline, as the dollar index pulled back from 14-year highs and stocks scuffled. Precious metals have launched a tepid advance in this holiday-shortened week after gold ended with a seventh straight weekly decline before the Christmas weekend. That was gold’s longest weekly losing streak in more than 12 years. “Even before he takes office, the data and anecdotal evidence suggests that the U.S. economy has been given an initial boost from the forthcoming Trump presidency,” said Nigel Green, CEO of deVere Group investment advisory firm. “Considering the likelihood of a stimulus package when he takes office, and given the already near full employment rate, inflation could go higher than the Fed’s goal of 2%.” Even with a negative performance likely for all of December, gold and silver are poised for their most robust annual gains since 2012 thanks to an early-year surge when global economic uncertainty pared the interest-rate outlook. Gold is headed for a roughly 6% advance and silver is up 14% for 2016. The number of Americans who applied for unemployment benefits in the week before Christmas fell by 10,000 to 265,000, returning initial claims to the extremely low levels that have been the norm since last summer. Continuing jobless claims rose by 63,000 to 2.1 million in the week ended Dec.17. These claims, reported with a one-week delay, reflect the number of people already collecting unemployment checks. For the bears, the U.S. Energy Information Administration said in its weekly report that crude oil inventories rose by 0.614 million barrels in the week ended December 23, compared to forecasts for a draw of 2.060 million barrels. Aaj Ka Trend 30th Dec’16
- 4. Equities I Commodities I Currencies I Mutual FundsSEBI Registered - Research Analyst Equities I Commodities I Currencies I Mutual Funds International Market Commodity Closing Price Gold 1159.45 Silver 16.21 Crude Oil 53.85 Brent Crude Oil 56.84 Natural Gas 3.793 COMEX/NYMEX/ICE ( Precious Metals & Energy) Currency & Commodity Index Currency (Spot) Current Price USD / INR 68.10 Dollar Index 102.36 EUR / USD 1.0523 CRB Index* 192.89 Closing as on 29.12.16 *Closing as on 29.12.16 LME (Base Metals) ( $ per tones) Commodity Closing Price Copper 5487 Aluminum 1679 Zinc 2522 Lead 1970 Nickel 10120 SHFE (Base Metals) (Yuan per tones) Commodity Closing Price Copper 45420 Aluminum 12840 Zinc 20855 Lead 17775 Closing as on 29.12.16 Closing as on 29.12.16 LME INVENTORY DATA Aaj Ka Trend 23-Dec-16 26-Dec-16 27-Dec-16 28-Dec-16 29-Dec-16 Aluminium 10450 0 0 26775 6875 Copper -1275 0 0 -3475 -2751 Lead 50 0 0 -200 -51 Nickel -144 0 0 -162 -125 Zinc -200 0 0 -350 -476 30th Dec’16
- 5. Equities I Commodities I Currencies I Mutual Funds This is solely for information of clients of Choice Broking and does not construe to be an investment advice. It is also not intended as an offer or solicitation for the purchase and sale of any financial instruments. Any action taken by you on the basis of the information contained herein is your responsibility alone and Choice Broking its subsidiaries or its employees or associates will not be liable in any manner for the consequences of such action taken by you. We have exercised due diligence in checking the correctness and authenticity of the information contained in this recommendation, but Choice Broking or any of its subsidiaries or associates or employees shall not be in any way responsible for any loss or damage that may arise to any person from any inadvertent error in the information contained in this recommendation or any action taken on basis of this information. Technical analysis studies market psychology, price patterns and volume levels. It is used to forecast future price and market movements. Technical analysis is complementary to fundamental analysis and news sources. The recommendations issued herewith might be contrary to recommendations issued by Choice Broking in the company research undertaken as the recommendations stated in this report is derived purely from technical analysis. Choice Broking has based this document on information obtained from sources it believes to be reliable but which it has not independently verified; Choice Broking makes no guarantee, representation or warranty and accepts no responsibility or liability as to its accuracy or completeness. The opinions contained within the report are based upon publicly available information at the time of publication and are subject to change without notice. The information and any disclosures provided herein are in summary form and have been prepared for informational purposes. The recommendations and suggested price levels are intended purely for trading purposes. The recommendations are valid for the day of the report however trading trends and volumes might vary substantially on an intraday basis and the recommendations may be subject to change. The information and any disclosures provided herein may be considered confidential. Any use, distribution, modification, copying, forwarding or disclosure by any person is strictly prohibited. The information and any disclosures provided herein do not constitute a solicitation or offer to purchase or sell any security or other financial product or instrument. The current performance may be unaudited. Past performance does not guarantee future returns. There can be no assurance that investments will achieve any targeted rates of return, and there is no guarantee against the loss of your entire investment. POTENTIAL CONFLICT OF INTEREST DISCLOSURE (as on date of report) Disclosure of interest statement – • Analyst interest of the stock /Instrument(s): - No. • Firm interest of the stock / Instrument (s): - No. Disclaimer Contact Us Amit Pathania Research Associate amit.pathania@choiceindia.com www.choicebroking.incustomercare@choiceindia.com SEBI Registered - Research Analyst Equities I Commodities I Currencies I Mutual Funds Aaj Ka Trend 30th Dec’16 Neeraj Yadav Research Advisor neeraj.yadav@choiceindia.com Anish Vyas Senior Research Associate anish.vyas@choiceindia.com Anish Vyas Digitally signed by Anish Vyas DN: cn=Anish Vyas, o=Choice Merchandise Broking Pvt. Ltd, ou=Sr. Research Associate, email=anish.vyas@choiceindia.com, c=IN Date: 2016.12.30 09:03:13 +05'30'