1. 27th Nov’14 Aaj Ka Trend
Bullions
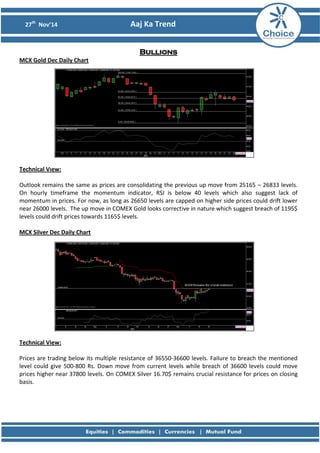
MCX Gold Dec Daily Chart
Technical View:
Outlook remains the same as prices are consolidating the previous up move from 25165 – 26833 levels. On hourly timeframe the momentum indicator, RSI is below 40 levels which also suggest lack of momentum in prices. For now, as long as 26650 levels are capped on higher side prices could drift lower near 26000 levels. The up move in COMEX Gold looks corrective in nature which suggest breach of 1195$ levels could drift prices towards 1165$ levels.
MCX Silver Dec Daily Chart
Technical View:
Prices are trading below its multiple resistance of 36550-36600 levels. Failure to breach the mentioned level could give 500-800 Rs. Down move from current levels while breach of 36600 levels could move prices higher near 37800 levels. On COMEX Silver 16.70$ remains crucial resistance for prices on closing basis.
2. 27th Nov’14 Aaj Ka Trend
Fundamental News: Gold gains as dollar slides on disappointing consumer confidence report. Gold prices posted cautious gains in U.S. trading on Tuesday after a soft report on U.S. consumer confidence weakened the dollar, though a robust economic growth report capped the precious metal's gains. Gold and the dollar tend to trade inversely with one another. On the Comex division of the New York Mercantile Exchange, gold futures for February delivery were up 0.14% at $1,198.30, up from a session low of $1,190.60 and off a high of $1,203.00.
Pivot Levels for the Day:
S1
S2
S3
Pivot
R1
R2
R3 Gold 26298 26233 26109 26357 26422 26481 26605
Silver
36463
36333
36103
36563
36693
36793
37023
Recommendation:
Gold
Neutral to negative Silver Neutral
3. 27th Nov’14 Aaj Ka Trend
Base Metals
MCX Copper Nov Hourly Chart
Technical Views:
Initially prices moved higher as expected and drifted lower below previous session low. The momentum indicator, RSI remained below 40 levels which suggest lack of momentum in prices. We now remain cautious for further selling in prices as prices have taken support near its previous support of 403 levels. Breach of the mentioned support could create panic for further down side towards 396 levels.
MCX Aluminum Nov Hourly Chart
MCX Lead Nov Hourly Chart
MCX Nickel Nov Daily Chart
MCX Zinc Nov Hourly Chart
4. 27th Nov’14 Aaj Ka Trend
Fundamental News:
Copper futures down after weak consumer confidence data
Copper Future declined sharply after the consumer confidence data. On the Comex division of the New York Mercantile Exchange, copper for March delivery picked up 1.1 cents, or 0.36% to trade at $3.017 a pound during European morning hours.
On the Comex division of the New York Mercantile Exchange, copper for March delivery declined 0.4 cents, or 0.12% to trade at $3.026 a pound during European morning hours.
Pivot Levels for the Day:
S1
S2
S3
Pivot
R1
R2
R3 Copper 402.5 399.4 394.2 404.6 407.7 409.8 415.0
Aluminum
128.6
127.9
126.5
129.4
130.1
130.8
132.3 Lead 126.3 125.2 123.4 126.9 128.0 128.7 130.4
Nickel
999.8
993.0
977.9
1008.1
1014.9
1023.2
1038.3 Zinc 139.6 138.9 137.7 140.1 140.8 141.3 142.5
Recommendation:
Copper
Sell on Rallies
Aluminum
Sell
Lead
Neutral
Nickel
Neutral
Zinc
Neutral
5. 27th Nov’14 Aaj Ka Trend
Energy
MCX Crude Dec 15 minutes Chart:
Technical Views:
Prices moved further lower below 4600 levels which indicates weakness in crude prices. The momentum indicator, RSI has formed negative reversal on hourly timeframe near at 40 levels which would add bearishness to the prices. For now, break below 4550 levels could move prices towards 4500/4450 levels. while rallies can be used as selling opportunity.
MCX Natural Gas Dec Hourly Chart:
Technical Views:
As mentioned, prices moved higher testing the upper band of the consolidation and formed hanging man followed by bearish engulfing candlestick formation on hourly timeframe which gives negative confirmation for prices to move lower. For now as long as 281 levels are capped on higher side prices can test 270 levels.
6. 27th Nov’14 Aaj Ka Trend
Fundamental News:
Oil futures fluctuate with U.S. economy, OPEC meeting in focus
Oil prices swung between small gains and losses on Tuesday, as investors digested a mixed bag of U.S. economic data ahead of a much-anticipated meeting of the Organization of the Petroleum Exporting Countries later this week. On the New York Mercantile Exchange, crude oil for delivery in January dipped 3 cents, or 0.04%, to trade at $75.75 a barrel during U.S. morning hours. Natural gas rebounds as market prices in mild temperatures. Natural gas futures rose on Tuesday after investors viewed futures as oversold in wake of forecasts calling for mild temperatures across much of the U.S.
Pivot Levels for the Day:
S1
S2
S3
Pivot
R1
R2
R3 Crude 4546 4513 4439 4587 4620 4661 4735
Natural Gas
271
267
259
276
280
285
293
Recommendation:
Crude
Sell
Natural Gas
Sell
8. 27th Nov’14 Aaj Ka Trend
This is solely for information of clients of Choice Broking and does not construe to be an investment advice. It is also not intended as an offer or solicitation for the purchase and sale of any financial instruments. Any action taken by you on the basis of the information contained herein is your responsibility alone and Choice Broking its subsidiaries or its employees or associates will not be liable in any manner for the consequences of such action taken by you. We have exercised due diligence in checking the correctness and authenticity of the information contained in this recommendation, but Choice Broking or any of its subsidiaries or associates or employees shall not be in any way responsible for any loss or damage that may arise to any person from any inadvertent error in the information contained in this recommendation or any action taken on basis of this information. Technical analysis studies market psychology, price patterns and volume levels. It is used to forecast future price and market movements. Technical analysis is complementary to fundamental analysis and news sources. The recommendations issued herewith might be contrary to recommendations issued by Choice Broking in the company research undertaken as the recommendations stated in this report is derived purely from technical analysis. Choice Broking has based this document on information obtained from sources it believes to be reliable but which it has not independently verified; Choice Broking makes no guarantee, representation or warranty and accepts no responsibility or liability as to its accuracy or completeness. The opinions contained within the report are based upon publicly available information at the time of publication and are subject to change without notice. The information and any disclosures provided herein are in summary form and have been prepared for informational purposes. The recommendations and suggested price levels are intended purely for trading purposes. The recommendations are valid for the day of the report however trading trends and volumes might vary substantially on an intraday basis and the recommendations may be subject to change. The information and any disclosures provided herein may be considered confidential. Any use, distribution, modification, copying, forwarding or disclosure by any person is strictly prohibited. The information and any disclosures provided herein do not constitute a solicitation or offer to purchase or sell any security or other financial product or instrument. The current performance may be unaudited. Past performance does not guarantee future returns. There can be no assurance that investments will achieve any targeted rates of return, and there is no guarantee against the loss of your entire investment.
POTENTIAL CONFLICT OF INTEREST DISCLOSURE (as on date of report) Disclosure of interest statement – • Analyst interest of the stock /Instrument(s): - No. • Firm interest of the stock / Instrument (s): - No.
Disclaimer