SlideShare a Scribd company logo
1 of 8
Download to read offline
08th Dec’14 Aaj Ka Trend 
Bullions MCX Gold Feb Daily Chart 
Technical View: Gold prices moved lower and closed near day’s low which suggests signs of weakness. We continue to mention that as long as the downtrend line is intact, prices could remain under pressure while breach of the mentioned trend line could head higher and move prices towards higher levels. The momentum indicator, RSI has also remained below 60 levels on daily timeframe. On COMEX Gold break below 1185$ would keep prices under pressure. For the day 26100 remains to be the support and 26700 remains to be the resistance for MCX gold prices. MCX Silver Mar Hourly Chart 
Technical View: Above chart shows that prices are trading near the lower band of the consolidation formation. The momentum indicator, RSI is also near 40 levels which signals prices could take support near the same and start moving towards higher levels to test upper band near 37400 levels. Prices are also trading above the super trend indicator’s support which would give positive confirmation for prices. On COMEX Silver 16.20$ happens to be the crucial support for prices to move towards 16.55$ levels.
08th Dec’14 Aaj Ka Trend 
Fundamental News: 
• Gold drops on robust U.S. November jobs report. • Gold futures dropped on Friday after official data revealing a healthy uptick in U.S. hiring bolstered demand for the dollar, which trades inversely with the yellow metal. 
• On the Comex division of the New York Mercantile Exchange, gold futures for February delivery were down 1.35% at $1,191.40, up from a session low of $1,186.80 and off a high of $1,207.70 
• The February contract settled down 0.08% at $1,207.70 on Thursday. 
Pivot Levelsfor the Day: 
S1 
S2 
S3 
Pivot 
R1 
R2 
R3 
Gold 
26133 
25914 
25560 
26268 
26487 
26622 
26976 
Silver 
36002 
35561 
34921 
36201 
36642 
36841 
37481 
Recommendation: 
Gold 
Neutral 
Silver 
Buy
08th Dec’14 Aaj Ka Trend 
Base Metals MCX Copper Feb Hourly Chart 
Technical Views: As mentioned, ‘For now we expect once prices breaches 404.50 levels, it can easily test 407/410 levels while downside remains protected at 400 levels on closing basis’ prices moved above 404.50 levels and have tested our first short term target of 407 levels. In the above hourly chart it can be observed that prices are trading above 403.5 levels which happen to be the support for prices. The momentum indicator, RSI has formed positive reversal which adds bullishness to prices. For now, as long as 400 levels are protected on down side, prices can test 407/409 levels. 
MCX Aluminum Dec Hourly Chart 
MCX Lead Dec Hourly Chart 
MCX Nickel Dec Daily Chart 
MCX Zinc Dec Hourly Chart
08th Dec’14 Aaj Ka Trend 
Fundamental News: 
• Copper Falls as U.S. Job Gains Spur Bets on Interest-Rate Rise. Copper fell for the third time in four days after U.S. payrolls rose more than forecast, bolstering the case for the Federal Reserve to raise interest rates that may slow economic growth and curb metal demand. 
• Employers added 321,000 jobs in November, the highest since January 2012 and above the most optimistic projection in a Bloomberg survey of economists, government data showed today. Treasury yields rose as traders bet improvement in hiring will help assure Fed policy makers that the economy is strong enough to withstand an increase in borrowing costs next year. The U.S. is the largest consumer of copper after China. 
Pivot Levels for the Day: 
S1 
S2 
S3 
Pivot 
R1 
R2 
R3 
Copper 
401.5 
399.7 
395.1 
404.3 
406.1 
408.9 
413.5 
Aluminum 
121.8 
121.2 
119.5 
122.8 
123.4 
124.5 
126.1 
Lead 
125.6 
124.9 
123.5 
126.4 
127.0 
127.8 
129.3 
Nickel 
1028.8 
1018.4 
989.2 
1047.6 
1058.0 
1076.8 
1106.0 
Zinc 
137.9 
137.2 
135.5 
138.8 
139.6 
140.5 
142.1 
Recommendation: 
Copper 
Buy 
Aluminum 
Sell 
Lead 
Neutral 
Nickel 
Neutral 
Zinc 
Buy above 139
08th Dec’14 Aaj Ka Trend 
Energy MCX Crude Dec Hourly Chart: 
Technical Views: From the above chart it can be observed that prices have taken support near 78.6% retracement level of the previous intermediate up move. The momentum indicator, RSI has move above 40 levels which signals prices could move in sideways or positive trend. The up move from 63.77$ - 69.55$ looks impulsive and the counter rally from 69.55$ - 65.15$ could be corrective in nature. For now we expect prices can head towards 68.20$ and in MCX prices can head towards 4230 levels as long as 4050 levels are protected on downside. MCX Natural Gas Dec Hourly Chart: 
Technical Views: Natural gas prices moved higher almost near upper circuit levels which signals early move of strength in natural gas prices. The momentum indicator, RSI has also moved near 60 levels which indicate momentum in prices. Prices could retest the lower band of the consolidation at 245 as long as 226 levels are protected on down side.
08th Dec’14 Aaj Ka Trend 
Fundamental News: 
• Crude shrugs off U.S. data and falls on Saudi price cut. 
• Crude futures shrugged off an upbeat U.S. jobs report and slid on Friday on news that Saudi Arabia trimmed the price of oil it exports to the U.S. and Asia. 
• In the New York Mercantile Exchange, West Texas Intermediate crude futures for delivery in January traded down 1.73% at $65.66 a barrel during U.S. trading, up from a session low of $65.19 a barrel and off a high of $66.86 a barrel. 
• Natural gas gains as markets price in mild temperatures. 
• Natural gas futures rose on Friday after investors priced in losses stemming from mild U.S. temperatures and snapped up nicely-priced positions in the commodity. 
• Longer-range forecasts suggesting a return of colder weather supported the commodity as well. 
Pivot Levels for the Day: 
S1 
S2 
S3 
Pivot 
R1 
R2 
R3 
Crude 
4065 
4009 
3906 
4112 
4168 
4215 
4318 
Natural Gas 
230 
223 
210 
235 
242 
248 
260 
Recommendation: 
Crude 
Buy 
Natural Gas 
Buy
08th Dec’14 Aaj Ka Trend 
SumeetBagadia (Associate Director) sumeet.bagadia@choiceindia.com 
Ritesh Patel (Research Associate) ritesh.patel@choiceindia.com 
DeveyaGaglani (Research Advisor) deveya.gaglani@chocieindia.com 
For Private Circulation Only Website: www.choiceindia.com 
https://twitter.com/ChoiceBroking 
http://www.slideshare.net/choiceindiabroking 
https://www.youtube.com/user/ChoiceBroking 
https://plus.google.com/115293033595831069270/posts 
https://www.facebook.com/pages/Choice-Equity-Broking-Pvt-Ltd/352491718249644 
https://www.linkedin.com/company/choice-international-limited?trk=parent_company_logo
08th Dec’14 Aaj Ka Trend 
This is solely for information of clients of Choice Broking and does not construe to be an investment advice. It is also not intended as an offer or solicitation for the purchase and sale of any financial instruments. Any action taken by you on the basis of the information contained herein is your responsibility alone and Choice Broking its subsidiaries or its employees or associates will not be liable in any manner for the consequences of such action taken by you. We have exercised due diligence in checking the correctness and authenticity of the information contained in this recommendation, but Choice Broking or any of its subsidiaries or associates or employees shall not be in any way responsible for any loss or damage that may arise to any person from any inadvertent error in the information contained in this recommendation or any action taken on basis of this information. Technical analysis studies market psychology, price patterns and volume levels. It is used to forecast future price and market movements. Technical analysis is complementary to fundamental analysis and news sources. The recommendations issued herewith might be contrary to recommendations issued by Choice Broking in the company research undertaken as the recommendations stated in this report is derived purely from technical analysis. Choice Broking has based this document on information obtained from sources it believes to be reliable but which it has not independently verified; Choice Broking makes no guarantee, representation or warranty and accepts no responsibility or liability as to its accuracy or completeness. The opinions contained within the report are based upon publicly available information at the time of publication and are subject to change without notice. The information and any disclosures provided herein are in summary form and have been prepared for informational purposes. The recommendations and suggested price levels are intended purely for trading purposes. The recommendations are valid for the day of the report however trading trends and volumes might vary substantially on an intraday basis and the recommendations may be subject to change. The information and any disclosures provided herein may be considered confidential. Any use, distribution, modification, copying, forwarding or disclosure by any person is strictly prohibited. The information and any disclosures provided herein do not constitute a solicitation or offer to purchase or sell any security or other financial product or instrument. The current performance may be unaudited. Past performance does not guarantee future returns. There can be no assurance that investments will achieve any targeted rates of return, and there is no guarantee against the loss of your entire investment. POTENTIAL CONFLICT OF INTEREST DISCLOSURE (as on date of report) Disclosure of interest statement – • Analyst interest of the stock /Instrument(s): - No. • Firm interest of the stock / Instrument (s): - No. 
Disclaimer

More Related Content

What's hot

What's hot (19)

Aaj ka trend 07.11.14
Aaj ka trend 07.11.14Aaj ka trend 07.11.14
Aaj ka trend 07.11.14
 
Aaj ka trend 05.11.14
Aaj ka trend 05.11.14Aaj ka trend 05.11.14
Aaj ka trend 05.11.14
 
Aaj ka trend 09.10.14
Aaj ka trend 09.10.14Aaj ka trend 09.10.14
Aaj ka trend 09.10.14
 
Aaj ka trend 20.11.14
Aaj ka trend 20.11.14Aaj ka trend 20.11.14
Aaj ka trend 20.11.14
 
Aaj ka trend 25.11.14
Aaj ka trend 25.11.14Aaj ka trend 25.11.14
Aaj ka trend 25.11.14
 
Aaj ka trend 24.11.14
Aaj ka trend 24.11.14Aaj ka trend 24.11.14
Aaj ka trend 24.11.14
 
Aaj ka trend
Aaj ka trendAaj ka trend
Aaj ka trend
 
Aaj ka trend
Aaj ka trendAaj ka trend
Aaj ka trend
 
Aaj ka trend 30.10.14
Aaj ka trend 30.10.14Aaj ka trend 30.10.14
Aaj ka trend 30.10.14
 
Aaj ka trend 10.03.17
Aaj ka trend 10.03.17Aaj ka trend 10.03.17
Aaj ka trend 10.03.17
 
Aaj ka trend 04.07.16
Aaj ka trend 04.07.16Aaj ka trend 04.07.16
Aaj ka trend 04.07.16
 
Aaj ka trend 30.09.14
Aaj ka trend 30.09.14Aaj ka trend 30.09.14
Aaj ka trend 30.09.14
 
Aaj ka trend 29.09.14
Aaj ka trend 29.09.14Aaj ka trend 29.09.14
Aaj ka trend 29.09.14
 
Aaj ka trend 21.12.16
Aaj ka trend 21.12.16Aaj ka trend 21.12.16
Aaj ka trend 21.12.16
 
Aaj ka trend 21.11.16
Aaj ka trend 21.11.16Aaj ka trend 21.11.16
Aaj ka trend 21.11.16
 
Aaj ka trend 02.01.17
Aaj ka trend 02.01.17Aaj ka trend 02.01.17
Aaj ka trend 02.01.17
 
Aaj ka trend 27.10.14
Aaj ka trend 27.10.14Aaj ka trend 27.10.14
Aaj ka trend 27.10.14
 
Aaj ka trend 27.09.16
Aaj ka trend 27.09.16Aaj ka trend 27.09.16
Aaj ka trend 27.09.16
 
Aaj ka trend 29.11.16
Aaj ka trend 29.11.16Aaj ka trend 29.11.16
Aaj ka trend 29.11.16
 

Viewers also liked

Viewers also liked (15)

Equity bazaar 3.11.14
Equity bazaar 3.11.14Equity bazaar 3.11.14
Equity bazaar 3.11.14
 
Equity bazaar
Equity bazaarEquity bazaar
Equity bazaar
 
Aaj ka trend 16.10.14
Aaj ka trend 16.10.14Aaj ka trend 16.10.14
Aaj ka trend 16.10.14
 
Aaj ka trend 20.10.14
Aaj ka trend 20.10.14Aaj ka trend 20.10.14
Aaj ka trend 20.10.14
 
Aaj ka trend
Aaj ka trendAaj ka trend
Aaj ka trend
 
Currency highlights 25.09.14
Currency highlights 25.09.14Currency highlights 25.09.14
Currency highlights 25.09.14
 
Currency highlights 01.10.14
Currency highlights 01.10.14Currency highlights 01.10.14
Currency highlights 01.10.14
 
Currencies call tracker oct'14
Currencies call tracker oct'14Currencies call tracker oct'14
Currencies call tracker oct'14
 
Currency highlights 17.11.14
Currency highlights 17.11.14Currency highlights 17.11.14
Currency highlights 17.11.14
 
Equity bazaar 13.11.14
Equity bazaar 13.11.14Equity bazaar 13.11.14
Equity bazaar 13.11.14
 
Currency highlights 10.10.14
Currency highlights 10.10.14Currency highlights 10.10.14
Currency highlights 10.10.14
 
Aaj ka trend 11.11.14
Aaj ka trend 11.11.14Aaj ka trend 11.11.14
Aaj ka trend 11.11.14
 
Equity bazaar 30.09.14
Equity bazaar 30.09.14Equity bazaar 30.09.14
Equity bazaar 30.09.14
 
Equity bazaar
Equity bazaarEquity bazaar
Equity bazaar
 
Currency highlights
Currency highlightsCurrency highlights
Currency highlights
 

Similar to MCX Trend Analysis Dec 8

Similar to MCX Trend Analysis Dec 8 (16)

Aaj ka trend 31.10.14
Aaj ka trend 31.10.14Aaj ka trend 31.10.14
Aaj ka trend 31.10.14
 
Aaj ka trend 12.11.14
Aaj ka trend 12.11.14Aaj ka trend 12.11.14
Aaj ka trend 12.11.14
 
Aaj ka trend 28.10.14
Aaj ka trend 28.10.14Aaj ka trend 28.10.14
Aaj ka trend 28.10.14
 
Aaj ka trend 21.10.14
Aaj ka trend 21.10.14Aaj ka trend 21.10.14
Aaj ka trend 21.10.14
 
Aaj ka trend 13.11.14
Aaj ka trend 13.11.14Aaj ka trend 13.11.14
Aaj ka trend 13.11.14
 
Aaj ka trend 10.11.14
Aaj ka trend 10.11.14Aaj ka trend 10.11.14
Aaj ka trend 10.11.14
 
Aaj ka trend 08.10.14
Aaj ka trend 08.10.14Aaj ka trend 08.10.14
Aaj ka trend 08.10.14
 
Aaj ka trend 21.11.14
Aaj ka trend 21.11.14Aaj ka trend 21.11.14
Aaj ka trend 21.11.14
 
Aaj ka trend 17.10.14
Aaj ka trend 17.10.14Aaj ka trend 17.10.14
Aaj ka trend 17.10.14
 
Aaj ka trend
Aaj ka trendAaj ka trend
Aaj ka trend
 
Aaj ka trend 26.09.14
Aaj ka trend 26.09.14Aaj ka trend 26.09.14
Aaj ka trend 26.09.14
 
Aaj ka trend
Aaj ka trendAaj ka trend
Aaj ka trend
 
Aaj ka trend 01.10.14
Aaj ka trend 01.10.14Aaj ka trend 01.10.14
Aaj ka trend 01.10.14
 
Aaj ka trend 01.10.14
Aaj ka trend 01.10.14Aaj ka trend 01.10.14
Aaj ka trend 01.10.14
 
Aaj ka trend 19.11.14
Aaj ka trend 19.11.14Aaj ka trend 19.11.14
Aaj ka trend 19.11.14
 
Aaj ka trend 19.11.14
Aaj ka trend 19.11.14Aaj ka trend 19.11.14
Aaj ka trend 19.11.14
 

MCX Trend Analysis Dec 8

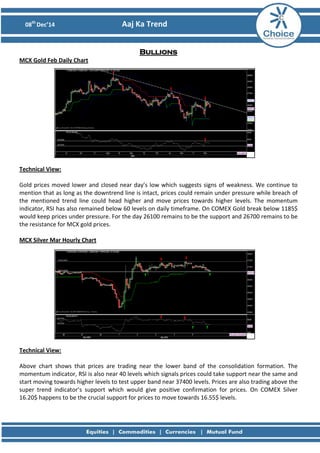
  • 1. 08th Dec’14 Aaj Ka Trend Bullions MCX Gold Feb Daily Chart Technical View: Gold prices moved lower and closed near day’s low which suggests signs of weakness. We continue to mention that as long as the downtrend line is intact, prices could remain under pressure while breach of the mentioned trend line could head higher and move prices towards higher levels. The momentum indicator, RSI has also remained below 60 levels on daily timeframe. On COMEX Gold break below 1185$ would keep prices under pressure. For the day 26100 remains to be the support and 26700 remains to be the resistance for MCX gold prices. MCX Silver Mar Hourly Chart Technical View: Above chart shows that prices are trading near the lower band of the consolidation formation. The momentum indicator, RSI is also near 40 levels which signals prices could take support near the same and start moving towards higher levels to test upper band near 37400 levels. Prices are also trading above the super trend indicator’s support which would give positive confirmation for prices. On COMEX Silver 16.20$ happens to be the crucial support for prices to move towards 16.55$ levels.
  • 2. 08th Dec’14 Aaj Ka Trend Fundamental News: • Gold drops on robust U.S. November jobs report. • Gold futures dropped on Friday after official data revealing a healthy uptick in U.S. hiring bolstered demand for the dollar, which trades inversely with the yellow metal. • On the Comex division of the New York Mercantile Exchange, gold futures for February delivery were down 1.35% at $1,191.40, up from a session low of $1,186.80 and off a high of $1,207.70 • The February contract settled down 0.08% at $1,207.70 on Thursday. Pivot Levelsfor the Day: S1 S2 S3 Pivot R1 R2 R3 Gold 26133 25914 25560 26268 26487 26622 26976 Silver 36002 35561 34921 36201 36642 36841 37481 Recommendation: Gold Neutral Silver Buy
  • 3. 08th Dec’14 Aaj Ka Trend Base Metals MCX Copper Feb Hourly Chart Technical Views: As mentioned, ‘For now we expect once prices breaches 404.50 levels, it can easily test 407/410 levels while downside remains protected at 400 levels on closing basis’ prices moved above 404.50 levels and have tested our first short term target of 407 levels. In the above hourly chart it can be observed that prices are trading above 403.5 levels which happen to be the support for prices. The momentum indicator, RSI has formed positive reversal which adds bullishness to prices. For now, as long as 400 levels are protected on down side, prices can test 407/409 levels. MCX Aluminum Dec Hourly Chart MCX Lead Dec Hourly Chart MCX Nickel Dec Daily Chart MCX Zinc Dec Hourly Chart
  • 4. 08th Dec’14 Aaj Ka Trend Fundamental News: • Copper Falls as U.S. Job Gains Spur Bets on Interest-Rate Rise. Copper fell for the third time in four days after U.S. payrolls rose more than forecast, bolstering the case for the Federal Reserve to raise interest rates that may slow economic growth and curb metal demand. • Employers added 321,000 jobs in November, the highest since January 2012 and above the most optimistic projection in a Bloomberg survey of economists, government data showed today. Treasury yields rose as traders bet improvement in hiring will help assure Fed policy makers that the economy is strong enough to withstand an increase in borrowing costs next year. The U.S. is the largest consumer of copper after China. Pivot Levels for the Day: S1 S2 S3 Pivot R1 R2 R3 Copper 401.5 399.7 395.1 404.3 406.1 408.9 413.5 Aluminum 121.8 121.2 119.5 122.8 123.4 124.5 126.1 Lead 125.6 124.9 123.5 126.4 127.0 127.8 129.3 Nickel 1028.8 1018.4 989.2 1047.6 1058.0 1076.8 1106.0 Zinc 137.9 137.2 135.5 138.8 139.6 140.5 142.1 Recommendation: Copper Buy Aluminum Sell Lead Neutral Nickel Neutral Zinc Buy above 139
  • 5. 08th Dec’14 Aaj Ka Trend Energy MCX Crude Dec Hourly Chart: Technical Views: From the above chart it can be observed that prices have taken support near 78.6% retracement level of the previous intermediate up move. The momentum indicator, RSI has move above 40 levels which signals prices could move in sideways or positive trend. The up move from 63.77$ - 69.55$ looks impulsive and the counter rally from 69.55$ - 65.15$ could be corrective in nature. For now we expect prices can head towards 68.20$ and in MCX prices can head towards 4230 levels as long as 4050 levels are protected on downside. MCX Natural Gas Dec Hourly Chart: Technical Views: Natural gas prices moved higher almost near upper circuit levels which signals early move of strength in natural gas prices. The momentum indicator, RSI has also moved near 60 levels which indicate momentum in prices. Prices could retest the lower band of the consolidation at 245 as long as 226 levels are protected on down side.
  • 6. 08th Dec’14 Aaj Ka Trend Fundamental News: • Crude shrugs off U.S. data and falls on Saudi price cut. • Crude futures shrugged off an upbeat U.S. jobs report and slid on Friday on news that Saudi Arabia trimmed the price of oil it exports to the U.S. and Asia. • In the New York Mercantile Exchange, West Texas Intermediate crude futures for delivery in January traded down 1.73% at $65.66 a barrel during U.S. trading, up from a session low of $65.19 a barrel and off a high of $66.86 a barrel. • Natural gas gains as markets price in mild temperatures. • Natural gas futures rose on Friday after investors priced in losses stemming from mild U.S. temperatures and snapped up nicely-priced positions in the commodity. • Longer-range forecasts suggesting a return of colder weather supported the commodity as well. Pivot Levels for the Day: S1 S2 S3 Pivot R1 R2 R3 Crude 4065 4009 3906 4112 4168 4215 4318 Natural Gas 230 223 210 235 242 248 260 Recommendation: Crude Buy Natural Gas Buy
  • 7. 08th Dec’14 Aaj Ka Trend SumeetBagadia (Associate Director) sumeet.bagadia@choiceindia.com Ritesh Patel (Research Associate) ritesh.patel@choiceindia.com DeveyaGaglani (Research Advisor) deveya.gaglani@chocieindia.com For Private Circulation Only Website: www.choiceindia.com https://twitter.com/ChoiceBroking http://www.slideshare.net/choiceindiabroking https://www.youtube.com/user/ChoiceBroking https://plus.google.com/115293033595831069270/posts https://www.facebook.com/pages/Choice-Equity-Broking-Pvt-Ltd/352491718249644 https://www.linkedin.com/company/choice-international-limited?trk=parent_company_logo
  • 8. 08th Dec’14 Aaj Ka Trend This is solely for information of clients of Choice Broking and does not construe to be an investment advice. It is also not intended as an offer or solicitation for the purchase and sale of any financial instruments. Any action taken by you on the basis of the information contained herein is your responsibility alone and Choice Broking its subsidiaries or its employees or associates will not be liable in any manner for the consequences of such action taken by you. We have exercised due diligence in checking the correctness and authenticity of the information contained in this recommendation, but Choice Broking or any of its subsidiaries or associates or employees shall not be in any way responsible for any loss or damage that may arise to any person from any inadvertent error in the information contained in this recommendation or any action taken on basis of this information. Technical analysis studies market psychology, price patterns and volume levels. It is used to forecast future price and market movements. Technical analysis is complementary to fundamental analysis and news sources. The recommendations issued herewith might be contrary to recommendations issued by Choice Broking in the company research undertaken as the recommendations stated in this report is derived purely from technical analysis. Choice Broking has based this document on information obtained from sources it believes to be reliable but which it has not independently verified; Choice Broking makes no guarantee, representation or warranty and accepts no responsibility or liability as to its accuracy or completeness. The opinions contained within the report are based upon publicly available information at the time of publication and are subject to change without notice. The information and any disclosures provided herein are in summary form and have been prepared for informational purposes. The recommendations and suggested price levels are intended purely for trading purposes. The recommendations are valid for the day of the report however trading trends and volumes might vary substantially on an intraday basis and the recommendations may be subject to change. The information and any disclosures provided herein may be considered confidential. Any use, distribution, modification, copying, forwarding or disclosure by any person is strictly prohibited. The information and any disclosures provided herein do not constitute a solicitation or offer to purchase or sell any security or other financial product or instrument. The current performance may be unaudited. Past performance does not guarantee future returns. There can be no assurance that investments will achieve any targeted rates of return, and there is no guarantee against the loss of your entire investment. POTENTIAL CONFLICT OF INTEREST DISCLOSURE (as on date of report) Disclosure of interest statement – • Analyst interest of the stock /Instrument(s): - No. • Firm interest of the stock / Instrument (s): - No. Disclaimer