1. 17th
Nov’14 Aaj Ka Trend
Bullions
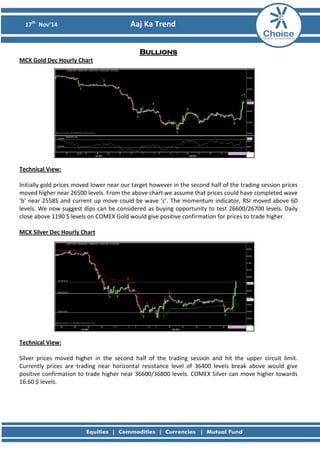
MCX Gold Dec Hourly Chart
Technical View:
Initially gold prices moved lower near our target however in the second half of the trading session prices
moved higher near 26500 levels. From the above chart we assume that prices could have completed wave
‘b’ near 25585 and current up move could be wave ‘c’. The momentum indicator, RSI moved above 60
levels. We now suggest dips can be considered as buying opportunity to test 26600/26700 levels. Daily
close above 1190 $ levels on COMEX Gold would give positive confirmation for prices to trade higher.
MCX Silver Dec Hourly Chart
Technical View:
Silver prices moved higher in the second half of the trading session and hit the upper circuit limit.
Currently prices are trading near horizontal resistance level of 36400 levels break above would give
positive confirmation to trade higher near 36600/36800 levels. COMEX Silver can move higher towards
16.60 $ levels.
2. 17th
Nov’14 Aaj Ka Trend
Fundamental News:
• Gold futures rose in Friday afternoon trading after investors locked in dollar gains from upbeat
U.S. data and sold the greenback for profits..
• On the Comex division of the New York Mercantile Exchange, gold futures for December delivery
were up 2.41% at $1,189.50, up from a session low of $1,146.10 and off a high of $1,192.80.
• Upbeat data boosted the dollar earlier but good news out of Europe convinced investors let the
dollar cool its rally, which boosted gold prices
Pivot Levels for the Day:
S1 S2 S3 Pivot R1 R2 R3
Gold 25857 25248 24302 26194 26803 27140 28086
Silver 34558 33084 30756 35412 36886 37740 40068
Recommendation:
Gold Buy on Dips
Silver Buy on Dips
3. 17th
Nov’14 Aaj Ka Trend
Base Metals
MCX Copper Nov Hourly Chart
Technical Views:
Prices moved higher near its crucial resistance level of 415 levels. The above chart suggests that prices
have given close above the 415 levels which could head prices towards 419 levels. COMEX Copper has
formed bullish engulfing candlestick pattern on daily timeframe which would add bullishness to the
prices.
MCX Aluminum Nov Hourly Chart
MCX Lead Nov Hourly Chart
MCX Nickel Nov Hourly Chart
MCX Zinc Nov Hourly Chart
4. 17th
Nov’14 Aaj Ka Trend
Fundamental News:
• Comex copper prices inched up 0.8 cents, or 0.26%, despite ongoing concerns over the health of
the global economy.
• Copper is sensitive to the economic growth outlook because of its widespread uses across
industries.
• According to the CFTC, net copper shorts totaled 1,664 contracts as of last week, compared to net
shorts of 5,961 contracts in the preceding week.
Pivot Levels for the Day:
S1 S2 S3 Pivot R1 R2 R3
Copper 409.8 403.9 395.0 412.9 418.7 421.8 430.8
Aluminum 124.9 124.0 122.3 125.7 126.6 127.4 129.1
Lead 124.5 123.0 120.7 125.4 126.9 127.7 130.1
Nickel 949.3 936.0 914.7 957.3 970.6 978.6 999.9
Zinc 138.2 137.1 135.2 138.9 140.1 140.8 142.6
Recommendation:
Copper Buy
Aluminum Sell
Lead Buy
Nickel Buy
Zinc
Buy
5. 17th
Nov’14 Aaj Ka Trend
Energy
MCX Crude Nov Hourly Chart:
Technical Views:
Prices moved lower achieving our target of 4580 levels. In the second half of the trading session prices
however recovered from its day low. Prices are now trading below the resistance level of 4720 levels
however rallies near mentioned level can be considered as selling opportunity to drift lower near
4650/4600 levels.
MCX Natural Gas Oct Hourly Chart:
Technical Views:
Prices drifted lower as expected achieving our target. We now remain cautious for finding weakness in
natural gas prices as prices are trading near 61.8% retracement level of the previous up move from 217-
279 levels. However on daily timeframe prices have formed hammer which could be trend reversal signal.
6. 17th
Nov’14 Aaj Ka Trend
Fundamental News:
• U.S. natural gas futures rose for the first time in five sessions on Friday, as a round of short-
covering and bargain-buying supported prices.
• On the New York Mercantile Exchange, natural gas for delivery in December picked up 4.3 cents,
or 1.08%, to settle at $4.020 per million British thermal units by close of trade.
• Despite Friday's upbeat performance, Nymex natural gas prices plunged 39.2 cents, or 8.88%, on
the week, as weather forecasting models pointed to milder temperatures across the U.S. later this
month.
• The U.S. Energy Information Administration said in its weekly report released Friday that natural
gas storage in the U.S. rose by 40 billion cubic feet, above expectations for an increase of 39
billion.
• Crude futures shot up from four-year lows on Friday amid market talk that OPEC countries may
consider cutting output to bolster prices at its upcoming meeting.
Pivot Levels for the Day:
S1 S2 S3 Pivot R1 R2 R3
Crude 4567 4471 4323 4619 4715 4767 4915
Natural
Gas
220.0 227.9 220.3 235.5 227.6 243.1 250.7
Recommendation:
Crude
Sell
Natural Gas
Neutral
8. 17th
Nov’14 Aaj Ka Trend
This is solely for information of clients of Choice Broking and does not construe to be an
investment advice. It is also not intended as an offer or solicitation for the purchase and sale of any
financial instruments. Any action taken by you on the basis of the information contained herein is
your responsibility alone and Choice Broking its subsidiaries or its employees or associates will not
be liable in any manner for the consequences of such action taken by you. We have exercised due
diligence in checking the correctness and authenticity of the information contained in this
recommendation, but Choice Broking or any of its subsidiaries or associates or employees shall not
be in any way responsible for any loss or damage that may arise to any person from any
inadvertent error in the information contained in this recommendation or any action taken on
basis of this information. Technical analysis studies market psychology, price patterns and volume
levels. It is used to forecast future price and market movements. Technical analysis is
complementary to fundamental analysis and news sources. The recommendations issued herewith
might be contrary to recommendations issued by Choice Broking in the company research
undertaken as the recommendations stated in this report is derived purely from technical analysis.
Choice Broking has based this document on information obtained from sources it believes to be
reliable but which it has not independently verified; Choice Broking makes no guarantee,
representation or warranty and accepts no responsibility or liability as to its accuracy or
completeness. The opinions contained within the report are based upon publicly available
information at the time of publication and are subject to change without notice. The information
and any disclosures provided herein are in summary form and have been prepared for
informational purposes. The recommendations and suggested price levels are intended purely for
trading purposes. The recommendations are valid for the day of the report however trading trends
and volumes might vary substantially on an intraday basis and the recommendations may be
subject to change. The information and any disclosures provided herein may be considered
confidential. Any use, distribution, modification, copying, forwarding or disclosure by any person is
strictly prohibited. The information and any disclosures provided herein do not constitute a
solicitation or offer to purchase or sell any security or other financial product or instrument. The
current performance may be unaudited. Past performance does not guarantee future returns.
There can be no assurance that investments will achieve any targeted rates of return, and there is
no guarantee against the loss of your entire investment.
POTENTIAL CONFLICT OF INTEREST DISCLOSURE (as on date of report) Disclosure of interest
statement – • Analyst interest of the stock /Instrument(s): - No. • Firm interest of the stock /
Instrument (s): - No.
Disclaimer