1. 08th Oct’14 Aaj Ka Trend
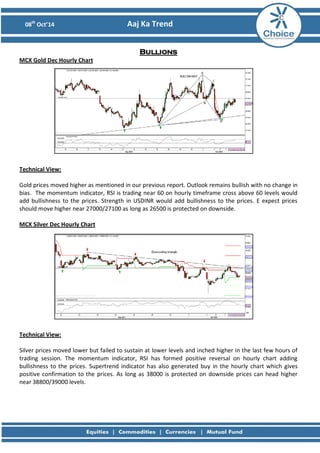
Bullions MCX Gold Dec Hourly Chart
Technical View: Gold prices moved higher as mentioned in our previous report. Outlook remains bullish with no change in bias. The momentum indicator, RSI is trading near 60 on hourly timeframe cross above 60 levels would add bullishness to the prices. Strength in USDINR would add bullishness to the prices. E expect prices should move higher near 27000/27100 as long as 26500 is protected on downside. MCX Silver Dec Hourly Chart
Technical View: Silver prices moved lower but failed to sustain at lower levels and inched higher in the last few hours of trading session. The momentum indicator, RSI has formed positive reversal on hourly chart adding bullishness to the prices. Supertrend indicator has also generated buy in the hourly chart which gives positive confirmation to the prices. As long as 38000 is protected on downside prices can head higher near 38800/39000 levels.
2. 08th Oct’14 Aaj Ka Trend
Fundamental News:
• Gold holds in narrow range ahead of Fed speakers.
• Gold futures swung between small gains and losses during U.S. morning hours on Tuesday, as traders looked ahead to speeches from a number of Federal Reserve officials later in the day for further indications on the future course of U.S. monetary policy.
• A day earlier, gold fell to a session low of $1,183.30, a level not seen since December 31, before turning higher to settle at $1,207.30, up $14.40, or 1.21%.
. Pivot Levels for the Day:
S1
S2
S3
Pivot
R1
R2
R3
Gold
26688
26567
26371
26763
26884
26959
27155
Silver
37947
37532
36518
38546
38961
39560
40574
Recommendation:
Gold
Buy
Silver
Buy
3. 08th Oct’14 Aaj Ka Trend
Base Metals MCX Copper Nov Daily Chart
Technical Views: Prices traded in the range where 413-416.5 happens to be the rage. 416 happens to be the crucial resistance for the copper prices breach of mentioned levels could head prices towards 420 levels with 411 remains the crucial support for the prices. COMEX Copper has formed doji candlestick suggesting no clear view on either side. However 3.063$ happens to the resistance. Breach of mentioned level could head higher.
MCX Aluminum Oct Hourly Chart
MCX Lead Oct Hourly Chart
MCX Nickel Oct Hourly Chart
MCX Zinc Oct Hourly Chart
4. 08th Oct’14 Aaj Ka Trend
Fundamental News:
• Copper futures decline after German industrial output data.
• Copper futures edged lower during European morning trade on Tuesday, as weak German industrial production data added to fears over the outlook for the euro zone economy.
• In the euro zone, data showed that industrial output in Germany dropped by 4.0% in August. It was the largest decline since early 2009 and was much worse than forecasts for a fall of 1.5%.
Pivot Levels for the Day:
S1
S2
S3
Pivot
R1
R2
R3
Copper
413.3
411.4
407.7
415.0
417.0
418.7
422.3
Aluminum
117.8
116.3
114.1
118.6
120.0
120.8
123.1
Lead
127.9
127.2
125.2
129.2
129.9
131.2
133.2
Nickel
1028.2
1012.8
989.3
1036.3
1051.7
1059.8
1083.3
Zinc
141.8
140.7
138.7
142.8
143.9
144.8
146.9
Recommendation:
Copper
Buy above 416
Aluminum
Buy
Lead
Sell
Nickel
Buy
Zinc
Buy
5. 08th Oct’14 Aaj Ka Trend
Energy MCX Crude Oct Hourly Chart:
Technical Views: As mentioned in our previous report, “Rallies near 5560-5600 can be used as selling opportunity to test lower levels” prices moved higher initially near 5573 and drifted lower made the low of 5572 levels. Outlook remains bearish till further trend reversal confirmation. The momentum indicator, RSI remains in the bear Zone adding weakness to the prices. We expect prices could test 5400 levels as long as 5560 levels are capped on higher side. MCX Natural Gas Oct Hourly Chart:
Technical Views: Natural gas prices moved lower below the previous gap support levels but failed to sustain at the lower levels and inched higher in the second half of the trading session. However bias has changed to negative as prices has taken resistance near the supertrend level and he momentum indicator, RSI has also formed negative reversal on hourly chart. We expect prices could drift lower near 238/235 levels as long as 248 levels are capped on higher side.
6. 08th Oct’14 Aaj Ka Trend
Fundamental News:
• U.S. gas trades near 2-week low with weather, supplies in focus.
• U.S. natural gas futures traded near a two-week low during U.S. morning trade on Tuesday, as investors monitored near-term weather forecasts to gauge the strength of demand for the fuel.
• Crude oil extends losses after IMF slashes global growth outlook.
• Crude oil futures extended losses during U.S. morning hours on Tuesday, after the International Monetary Fund cut its forecast for global economic growth this year.
• The IMF downgraded its global growth forecast for both this year and next, due to stagnation in Europe and a weaker-than-forecast recovery in Japan.
Pivot Levels for the Day:
S1
S2
S3
Pivot
R1
R2
R3
Crude
5447
5409
5308
5510
5548
5611
5712
Natural Gas
254.1
243.5
237.7
249.3
259.9
255.1
260.9
Recommendation:
Crude
Sell
Natural Gas
Sell
8. 08th Oct’14 Aaj Ka Trend
Disclaimer
This is solely for information of clients of Choice India and does not construe to be an investment advice. It is also not intended as an offer or solicitation for the purchase and sale of any financial instruments. Any action taken by you on the basis of the information contained herein is your responsibility alone and Choice India its subsidiaries or its employees or associates will not be liable in any manner for the consequences of such action taken by you. We have exercised due diligence in checking the correctness and authenticity of the information contained in this recommendation, but Choice India or any of its subsidiaries or associates or employees shall not be in any way responsible for any loss or damage that may arise to any person from any inadvertent error in the information contained in this recommendation or any action taken on basis of this information. Technical analysis studies market psychology, price patterns and volume levels. It is used to forecast future price and market movements. Technical analysis is complementary to fundamental analysis and news sources. The recommendations issued herewith might be contrary to recommendations issued by Choice India in the company research undertaken as the recommendations stated in this report is derived purely from technical analysis. Choice India has based this document on information obtained from sources it believes to be reliable but which it has not independently verified; Choice India makes no guarantee, representation or warranty and accepts no responsibility or liability as to its accuracy or completeness. The opinions contained within the report are based upon publicly available information at the time of publication and are subject to change without notice. The information and any disclosures provided herein are in summary form and have been prepared for informational purposes. The recommendations and suggested price levels are intended purely for trading purposes. The recommendations are valid for the day of the report however trading trends and volumes might vary substantially on an intraday basis and the recommendations may be subject to change. The information and any disclosures provided herein may be considered confidential. Any use, distribution, modification, copying, forwarding or disclosure by any person is strictly prohibited. The information and any disclosures provided herein do not constitute a solicitation or offer to purchase or sell any security or other financial product or instrument. The current performance may be unaudited. Past performance does not guarantee future returns. There can be no assurance that investments will achieve any targeted rates of return, and there is no guarantee against the loss of your entire investment. POTENTIAL CONFLICT OF INTEREST DISCLOSURE (as on date of report) Disclosure of interest statement – • Analyst interest of the stock /Instrument(s): - No. • Firm interest of the stock / Instrument (s): - No.