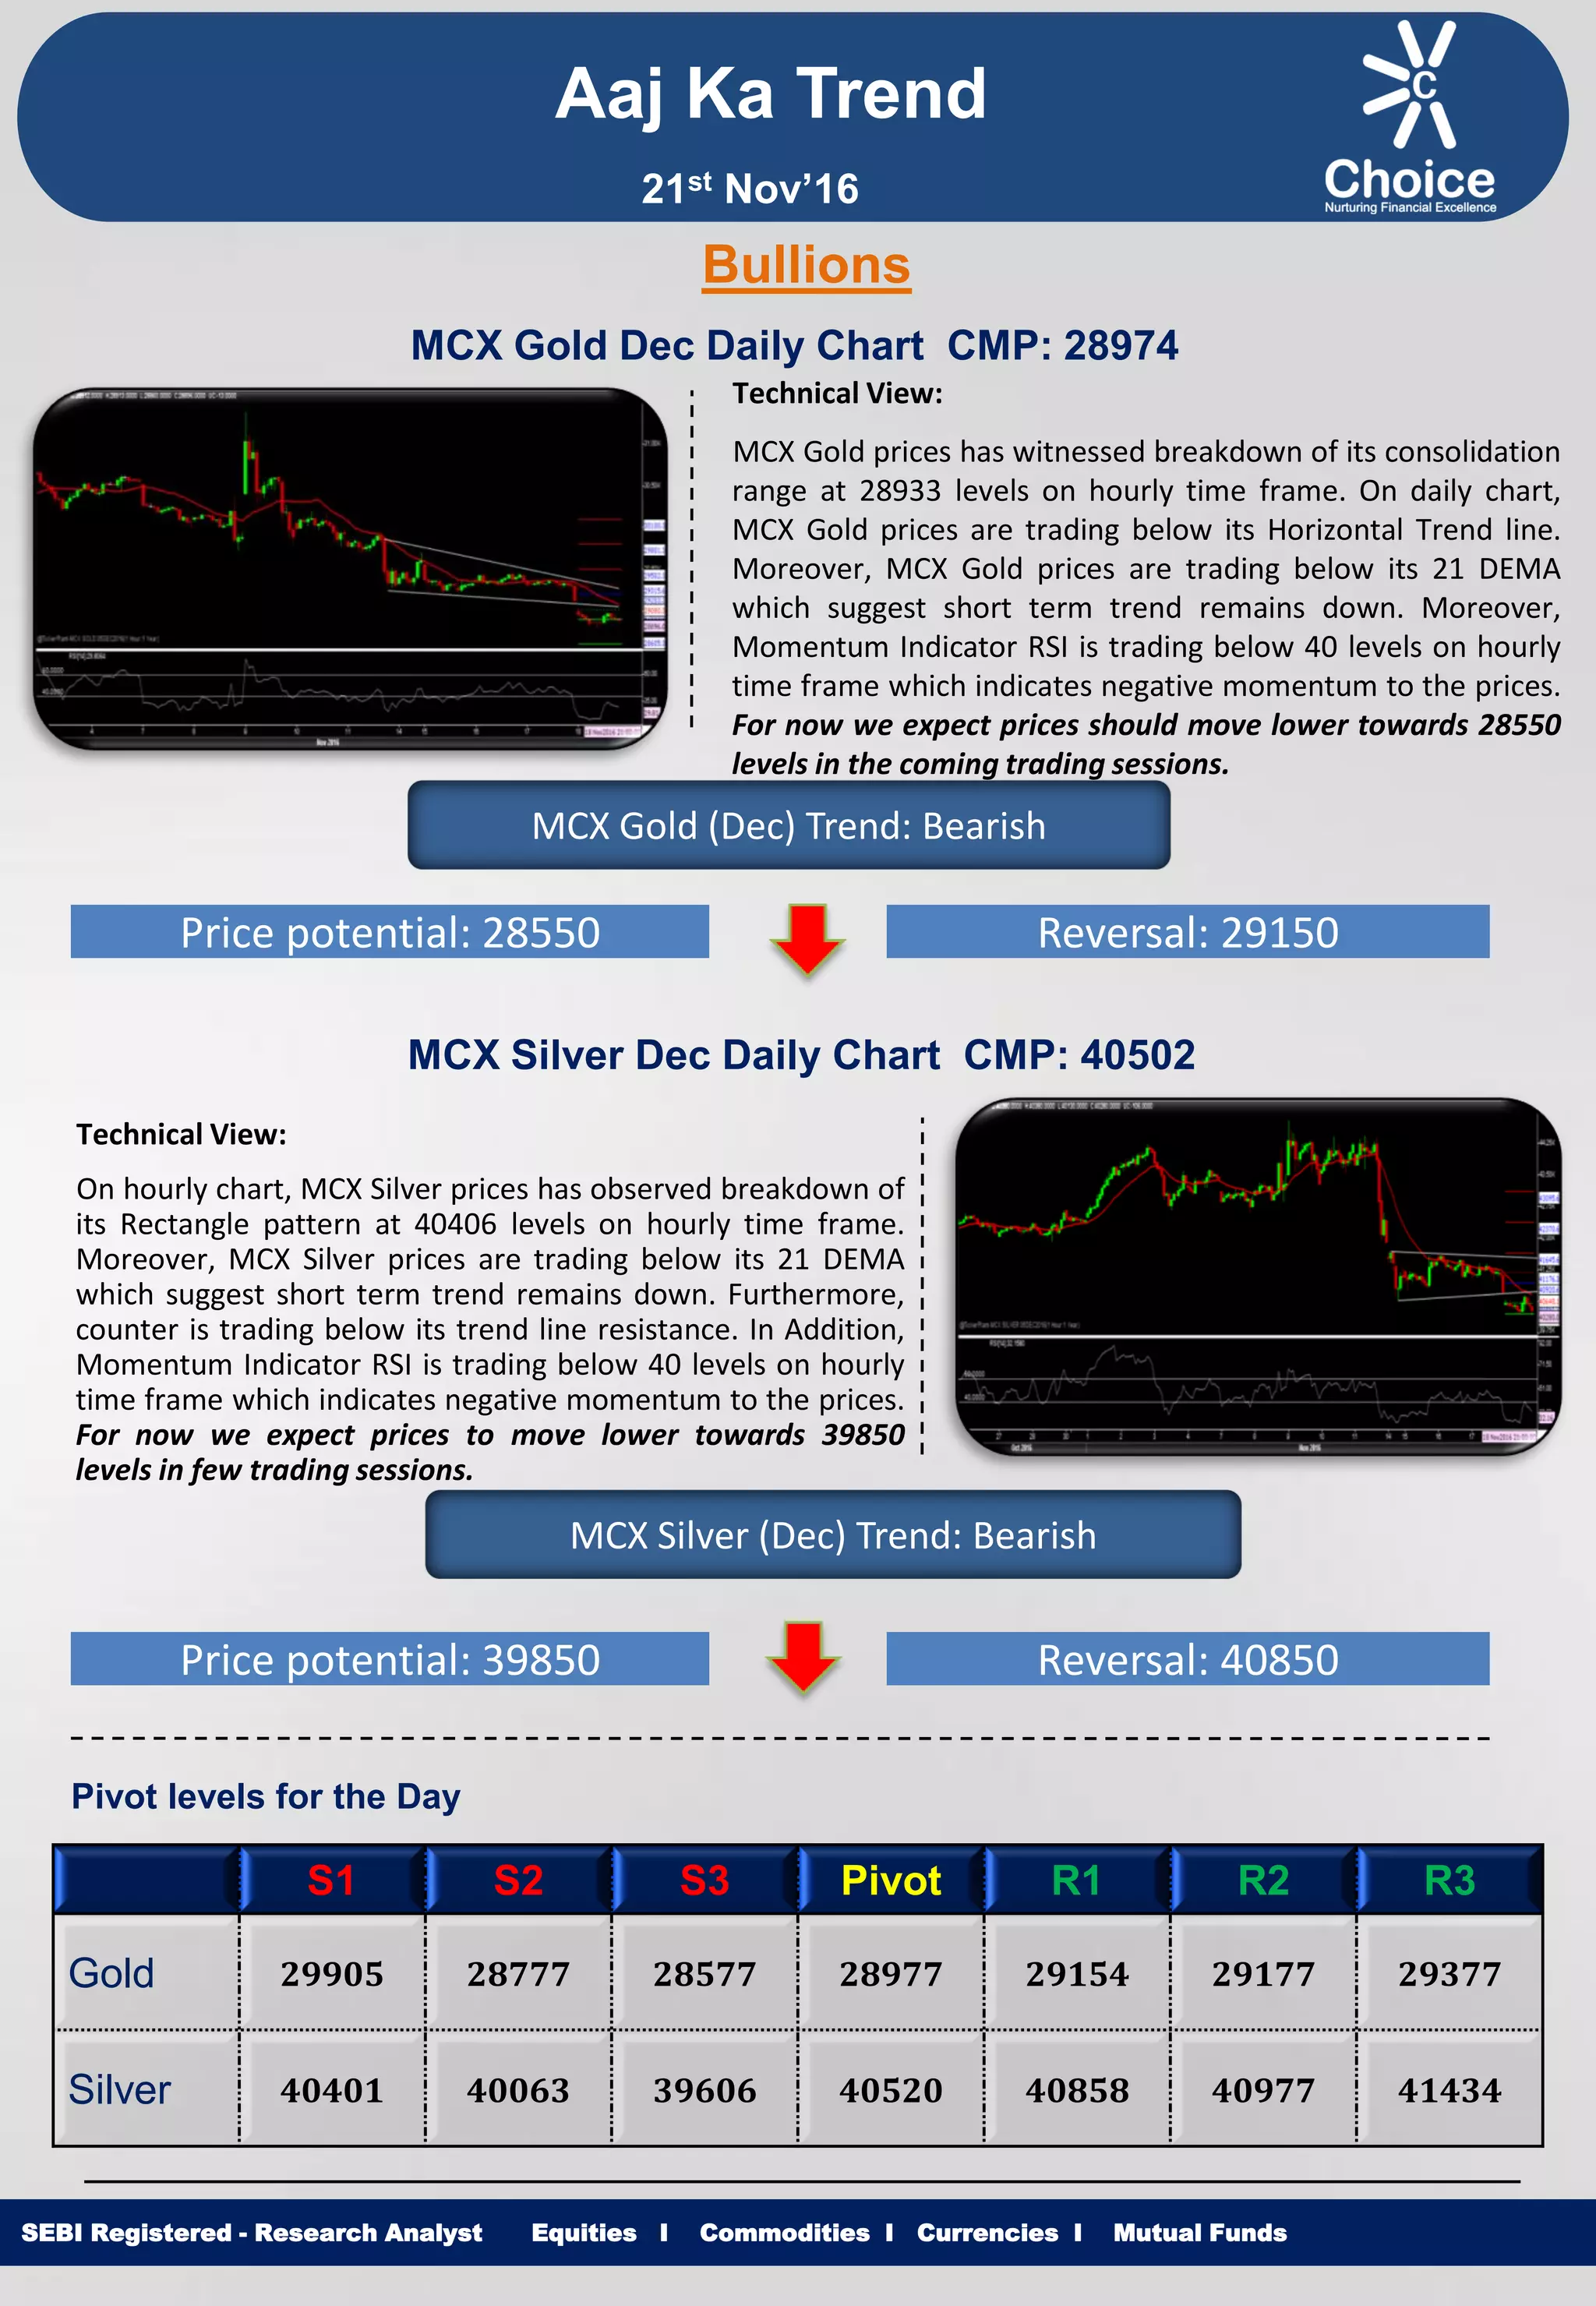
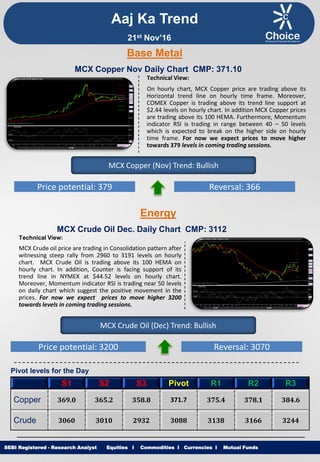
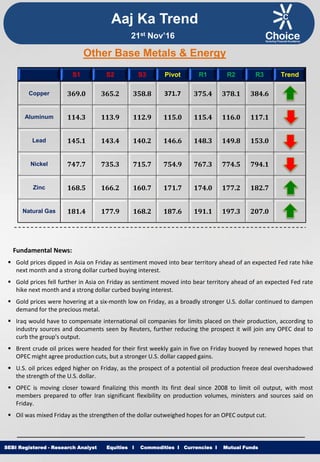
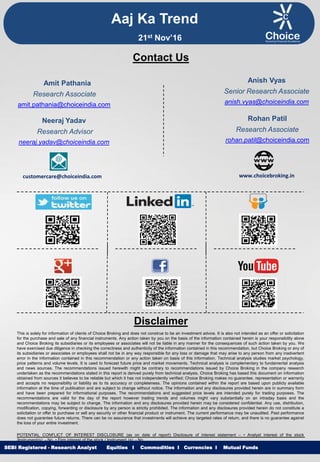
Equities I Commodities I Currencies I Mutual Funds
Aaj Ka Trend
Technical View:
MCX Gold prices has witnessed breakdown of its consolidation
range at 28933 levels on hourly time frame. On daily chart,
MCX Gold prices are trading below its Horizontal Trend line.
Moreover, MCX Gold prices are trading below its 21 DEMA
which suggest short term trend remains down. Moreover,
Momentum Indicator RSI is trading below 40 levels on hourly
time frame which indicates negative momentum to the prices.
For now we expect prices should move lower towards 28550
levels in the coming trading sessions.
SEBI Registered - Research Analyst Equities I Commodities I Currencies I Mutual Funds
Bullions
MCX Gold Dec Daily Chart CMP: 28974
MCX Gold (Dec) Trend: Bearish
Price potential: 28550 Reversal: 29150
MCX Silver Dec Daily Chart CMP: 40502
Technical View:
On hourly chart, MCX Silver prices has observed breakdown of
its Rectangle pattern at 40406 levels on hourly time frame.
Moreover, MCX Silver prices are trading below its 21 DEMA
which suggest short term trend remains down. Furthermore,
counter is trading below its trend line resistance. In Addition,
Momentum Indicator RSI is trading below 40 levels on hourly
time frame which indicates negative momentum to the prices.
For now we expect prices to move lower towards 39850
levels in few trading sessions.
MCX Silver (Dec) Trend: Bearish
Price potential: 39850 Reversal: 40850
Pivot levels for the Day
S1 S2 S3 Pivot R1 R2 R3
Gold 29905 28777 28577 28977 29154 29177 29377
Silver 40401 40063 39606 40520 40858 40977 41434
21st Nov’16
Equities I Commodities I Currencies I Mutual Funds
Technical View:
On hourly chart, MCX Copper price are trading above its
Horizontal trend line on hourly time frame. Moreover,
COMEX Copper is trading above its trend line support at
$2.44 levels on hourly chart. In addition MCX Copper prices
are trading above its 100 HEMA. Furthermore, Momentum
indicator RSI is trading in range between 40 – 50 levels
which is expected to break on the higher side on hourly
time frame. For now we expect prices to move higher
towards 379 levels in coming trading sessions.
SEBI Registered - Research Analyst Equities I Commodities I Currencies I Mutual Funds
MCX Copper Nov Daily Chart CMP: 371.10
MCX Copper (Nov) Trend: Bullish
Price potential: 379 Reversal: 366
MCX Crude Oil Dec. Daily Chart CMP: 3112
Technical View:
MCX Crude oil price are trading in Consolidation pattern after
witnessing steep rally from 2960 to 3191 levels on hourly
chart. MCX Crude Oil is trading above its 100 HEMA on
hourly chart. In addition, Counter is facing support of its
trend line in NYMEX at $44.52 levels on hourly chart.
Moreover, Momentum indicator RSI is trading near 50 levels
on daily chart which suggest the positive movement in the
prices. For now we expect prices to move higher 3200
towards levels in coming trading sessions.
MCX Crude Oil (Dec) Trend: Bullish
Price potential: 3200 Reversal: 3070
Pivot levels for the Day
S1 S2 S3 Pivot R1 R2 R3
Copper 369.0 365.2 358.8 371.7 375.4 378.1 384.6
Crude 3060 3010 2932 3088 3138 3166 3244
Base Metal
Energy
Aaj Ka Trend
21st Nov’16
Equities I Commodities I Currencies I Mutual FundsSEBI Registered - Research Analyst Equities I Commodities I Currencies I Mutual Funds
Other Base Metals & Energy
S1 S2 S3 Pivot R1 R2 R3 Trend
Copper 369.0 365.2 358.8 371.7 375.4 378.1 384.6
Aluminum 114.3 113.9 112.9 115.0 115.4 116.0 117.1
Lead 145.1 143.4 140.2 146.6 148.3 149.8 153.0
Nickel 747.7 735.3 715.7 754.9 767.3 774.5 794.1
Zinc 168.5 166.2 160.7 171.7 174.0 177.2 182.7
Natural Gas 181.4 177.9 168.2 187.6 191.1 197.3 207.0
Fundamental News:
 Gold prices dipped in Asia on Friday as sentiment moved into bear territory ahead of an expected Fed rate hike
next month and a strong dollar curbed buying interest.
 Gold prices fell further in Asia on Friday as sentiment moved into bear territory ahead of an expected Fed rate
hike next month and a strong dollar curbed buying interest.
 Gold prices were hovering at a six-month low on Friday, as a broadly stronger U.S. dollar continued to dampen
demand for the precious metal.
 Iraq would have to compensate international oil companies for limits placed on their production, according to
industry sources and documents seen by Reuters, further reducing the prospect it will join any OPEC deal to
curb the group's output.
 Brent crude oil prices were headed for their first weekly gain in five on Friday buoyed by renewed hopes that
OPEC might agree production cuts, but a stronger U.S. dollar capped gains.
 U.S. oil prices edged higher on Friday, as the prospect of a potential oil production freeze deal overshadowed
the strength of the U.S. dollar.
 OPEC is moving closer toward finalizing this month its first deal since 2008 to limit oil output, with most
members prepared to offer Iran significant flexibility on production volumes, ministers and sources said on
Friday.
 Oil was mixed Friday as the strengthen of the dollar outweighed hopes for an OPEC output cut.
Aaj Ka Trend
21st Nov’16
Equities I Commodities I Currencies I Mutual FundsSEBI Registered - Research Analyst Equities I Commodities I Currencies I Mutual Funds
International Market
Commodity Closing Price
Gold 1207.90
Silver 16.55
Crude Oil 45.59
Brent Crude Oil 46.81
Natural Gas 2.845
COMEX/NYMEX/ICE ( Precious Metals & Energy) Currency & Commodity Index
Currency (Spot) Current Price
USD / INR 68.16
Dollar Index 101.41
EUR / USD 1.058
CRB Index* 183.13
Closing as on 18.11.16 *Closing as on 18.11.16
LME (Base Metals) ( $ per tones)
Commodity Closing Price
Copper 5423
Aluminum 1694
Zinc 2540
Lead 2140
Nickel 10845
SHFE (Base Metals) (Yuan per tones)
Commodity Closing Price
Copper 43800
Aluminum 13560
Zinc 20780
Lead 17820
Closing as on 18.11.16 Closing as on 18.11.16
LME INVENTORY DATA
Aaj Ka Trend
14-Nov-16 15-Nov-16 16-Nov-16 17-Nov-16 18-Nov-16
Aluminium -6300 -6400 61525 3401 -5900
Copper -4100 -4700 -4100 2275 -4175
Lead -150 -150 600 -25 775
Nickel 0 1092 -144 48 0
Zinc -800 -301 -100 -375 -325
21st Nov’16
Equities I Commodities I Currencies I Mutual Funds
This is solely for information of clients of Choice Broking and does not construe to be an investment advice. It is also not intended as an offer or solicitation
for the purchase and sale of any financial instruments. Any action taken by you on the basis of the information contained herein is your responsibility alone
and Choice Broking its subsidiaries or its employees or associates will not be liable in any manner for the consequences of such action taken by you. We
have exercised due diligence in checking the correctness and authenticity of the information contained in this recommendation, but Choice Broking or any of
its subsidiaries or associates or employees shall not be in any way responsible for any loss or damage that may arise to any person from any inadvertent
error in the information contained in this recommendation or any action taken on basis of this information. Technical analysis studies market psychology,
price patterns and volume levels. It is used to forecast future price and market movements. Technical analysis is complementary to fundamental analysis
and news sources. The recommendations issued herewith might be contrary to recommendations issued by Choice Broking in the company research
undertaken as the recommendations stated in this report is derived purely from technical analysis. Choice Broking has based this document on information
obtained from sources it believes to be reliable but which it has not independently verified; Choice Broking makes no guarantee, representation or warranty
and accepts no responsibility or liability as to its accuracy or completeness. The opinions contained within the report are based upon publicly available
information at the time of publication and are subject to change without notice. The information and any disclosures provided herein are in summary form
and have been prepared for informational purposes. The recommendations and suggested price levels are intended purely for trading purposes. The
recommendations are valid for the day of the report however trading trends and volumes might vary substantially on an intraday basis and the
recommendations may be subject to change. The information and any disclosures provided herein may be considered confidential. Any use, distribution,
modification, copying, forwarding or disclosure by any person is strictly prohibited. The information and any disclosures provided herein do not constitute a
solicitation or offer to purchase or sell any security or other financial product or instrument. The current performance may be unaudited. Past performance
does not guarantee future returns. There can be no assurance that investments will achieve any targeted rates of return, and there is no guarantee against
the loss of your entire investment.
POTENTIAL CONFLICT OF INTEREST DISCLOSURE (as on date of report) Disclosure of interest statement – • Analyst interest of the stock
/Instrument(s): - No. • Firm interest of the stock / Instrument (s): - No.
Disclaimer
Contact Us
Amit Pathania
Research Associate
amit.pathania@choiceindia.com
Rohan Patil
Research Associate
rohan.patil@choiceindia.com
www.choicebroking.incustomercare@choiceindia.com
SEBI Registered - Research Analyst Equities I Commodities I Currencies I Mutual Funds
Aaj Ka Trend
21st Nov’16
Neeraj Yadav
Research Advisor
neeraj.yadav@choiceindia.com
Anish Vyas
Senior Research Associate
anish.vyas@choiceindia.com
Amit Pathania
Digitally signed by Amit Pathania
DN: cn=Amit Pathania, o=Choice Equity Broking Pvt. ltd,
ou=Research Department,
email=amit.pathania@choiceindia.com, c=IN
Date: 2016.11.19 12:39:46 +05'30'

Aaj ka trend 21.11.16

  • 1.
    Equities I CommoditiesI Currencies I Mutual Funds Aaj Ka Trend Technical View: MCX Gold prices has witnessed breakdown of its consolidation range at 28933 levels on hourly time frame. On daily chart, MCX Gold prices are trading below its Horizontal Trend line. Moreover, MCX Gold prices are trading below its 21 DEMA which suggest short term trend remains down. Moreover, Momentum Indicator RSI is trading below 40 levels on hourly time frame which indicates negative momentum to the prices. For now we expect prices should move lower towards 28550 levels in the coming trading sessions. SEBI Registered - Research Analyst Equities I Commodities I Currencies I Mutual Funds Bullions MCX Gold Dec Daily Chart CMP: 28974 MCX Gold (Dec) Trend: Bearish Price potential: 28550 Reversal: 29150 MCX Silver Dec Daily Chart CMP: 40502 Technical View: On hourly chart, MCX Silver prices has observed breakdown of its Rectangle pattern at 40406 levels on hourly time frame. Moreover, MCX Silver prices are trading below its 21 DEMA which suggest short term trend remains down. Furthermore, counter is trading below its trend line resistance. In Addition, Momentum Indicator RSI is trading below 40 levels on hourly time frame which indicates negative momentum to the prices. For now we expect prices to move lower towards 39850 levels in few trading sessions. MCX Silver (Dec) Trend: Bearish Price potential: 39850 Reversal: 40850 Pivot levels for the Day S1 S2 S3 Pivot R1 R2 R3 Gold 29905 28777 28577 28977 29154 29177 29377 Silver 40401 40063 39606 40520 40858 40977 41434 21st Nov’16
  • 2.
    Equities I CommoditiesI Currencies I Mutual Funds Technical View: On hourly chart, MCX Copper price are trading above its Horizontal trend line on hourly time frame. Moreover, COMEX Copper is trading above its trend line support at $2.44 levels on hourly chart. In addition MCX Copper prices are trading above its 100 HEMA. Furthermore, Momentum indicator RSI is trading in range between 40 – 50 levels which is expected to break on the higher side on hourly time frame. For now we expect prices to move higher towards 379 levels in coming trading sessions. SEBI Registered - Research Analyst Equities I Commodities I Currencies I Mutual Funds MCX Copper Nov Daily Chart CMP: 371.10 MCX Copper (Nov) Trend: Bullish Price potential: 379 Reversal: 366 MCX Crude Oil Dec. Daily Chart CMP: 3112 Technical View: MCX Crude oil price are trading in Consolidation pattern after witnessing steep rally from 2960 to 3191 levels on hourly chart. MCX Crude Oil is trading above its 100 HEMA on hourly chart. In addition, Counter is facing support of its trend line in NYMEX at $44.52 levels on hourly chart. Moreover, Momentum indicator RSI is trading near 50 levels on daily chart which suggest the positive movement in the prices. For now we expect prices to move higher 3200 towards levels in coming trading sessions. MCX Crude Oil (Dec) Trend: Bullish Price potential: 3200 Reversal: 3070 Pivot levels for the Day S1 S2 S3 Pivot R1 R2 R3 Copper 369.0 365.2 358.8 371.7 375.4 378.1 384.6 Crude 3060 3010 2932 3088 3138 3166 3244 Base Metal Energy Aaj Ka Trend 21st Nov’16
  • 3.
    Equities I CommoditiesI Currencies I Mutual FundsSEBI Registered - Research Analyst Equities I Commodities I Currencies I Mutual Funds Other Base Metals & Energy S1 S2 S3 Pivot R1 R2 R3 Trend Copper 369.0 365.2 358.8 371.7 375.4 378.1 384.6 Aluminum 114.3 113.9 112.9 115.0 115.4 116.0 117.1 Lead 145.1 143.4 140.2 146.6 148.3 149.8 153.0 Nickel 747.7 735.3 715.7 754.9 767.3 774.5 794.1 Zinc 168.5 166.2 160.7 171.7 174.0 177.2 182.7 Natural Gas 181.4 177.9 168.2 187.6 191.1 197.3 207.0 Fundamental News:  Gold prices dipped in Asia on Friday as sentiment moved into bear territory ahead of an expected Fed rate hike next month and a strong dollar curbed buying interest.  Gold prices fell further in Asia on Friday as sentiment moved into bear territory ahead of an expected Fed rate hike next month and a strong dollar curbed buying interest.  Gold prices were hovering at a six-month low on Friday, as a broadly stronger U.S. dollar continued to dampen demand for the precious metal.  Iraq would have to compensate international oil companies for limits placed on their production, according to industry sources and documents seen by Reuters, further reducing the prospect it will join any OPEC deal to curb the group's output.  Brent crude oil prices were headed for their first weekly gain in five on Friday buoyed by renewed hopes that OPEC might agree production cuts, but a stronger U.S. dollar capped gains.  U.S. oil prices edged higher on Friday, as the prospect of a potential oil production freeze deal overshadowed the strength of the U.S. dollar.  OPEC is moving closer toward finalizing this month its first deal since 2008 to limit oil output, with most members prepared to offer Iran significant flexibility on production volumes, ministers and sources said on Friday.  Oil was mixed Friday as the strengthen of the dollar outweighed hopes for an OPEC output cut. Aaj Ka Trend 21st Nov’16
  • 4.
    Equities I CommoditiesI Currencies I Mutual FundsSEBI Registered - Research Analyst Equities I Commodities I Currencies I Mutual Funds International Market Commodity Closing Price Gold 1207.90 Silver 16.55 Crude Oil 45.59 Brent Crude Oil 46.81 Natural Gas 2.845 COMEX/NYMEX/ICE ( Precious Metals & Energy) Currency & Commodity Index Currency (Spot) Current Price USD / INR 68.16 Dollar Index 101.41 EUR / USD 1.058 CRB Index* 183.13 Closing as on 18.11.16 *Closing as on 18.11.16 LME (Base Metals) ( $ per tones) Commodity Closing Price Copper 5423 Aluminum 1694 Zinc 2540 Lead 2140 Nickel 10845 SHFE (Base Metals) (Yuan per tones) Commodity Closing Price Copper 43800 Aluminum 13560 Zinc 20780 Lead 17820 Closing as on 18.11.16 Closing as on 18.11.16 LME INVENTORY DATA Aaj Ka Trend 14-Nov-16 15-Nov-16 16-Nov-16 17-Nov-16 18-Nov-16 Aluminium -6300 -6400 61525 3401 -5900 Copper -4100 -4700 -4100 2275 -4175 Lead -150 -150 600 -25 775 Nickel 0 1092 -144 48 0 Zinc -800 -301 -100 -375 -325 21st Nov’16
  • 5.
    Equities I CommoditiesI Currencies I Mutual Funds This is solely for information of clients of Choice Broking and does not construe to be an investment advice. It is also not intended as an offer or solicitation for the purchase and sale of any financial instruments. Any action taken by you on the basis of the information contained herein is your responsibility alone and Choice Broking its subsidiaries or its employees or associates will not be liable in any manner for the consequences of such action taken by you. We have exercised due diligence in checking the correctness and authenticity of the information contained in this recommendation, but Choice Broking or any of its subsidiaries or associates or employees shall not be in any way responsible for any loss or damage that may arise to any person from any inadvertent error in the information contained in this recommendation or any action taken on basis of this information. Technical analysis studies market psychology, price patterns and volume levels. It is used to forecast future price and market movements. Technical analysis is complementary to fundamental analysis and news sources. The recommendations issued herewith might be contrary to recommendations issued by Choice Broking in the company research undertaken as the recommendations stated in this report is derived purely from technical analysis. Choice Broking has based this document on information obtained from sources it believes to be reliable but which it has not independently verified; Choice Broking makes no guarantee, representation or warranty and accepts no responsibility or liability as to its accuracy or completeness. The opinions contained within the report are based upon publicly available information at the time of publication and are subject to change without notice. The information and any disclosures provided herein are in summary form and have been prepared for informational purposes. The recommendations and suggested price levels are intended purely for trading purposes. The recommendations are valid for the day of the report however trading trends and volumes might vary substantially on an intraday basis and the recommendations may be subject to change. The information and any disclosures provided herein may be considered confidential. Any use, distribution, modification, copying, forwarding or disclosure by any person is strictly prohibited. The information and any disclosures provided herein do not constitute a solicitation or offer to purchase or sell any security or other financial product or instrument. The current performance may be unaudited. Past performance does not guarantee future returns. There can be no assurance that investments will achieve any targeted rates of return, and there is no guarantee against the loss of your entire investment. POTENTIAL CONFLICT OF INTEREST DISCLOSURE (as on date of report) Disclosure of interest statement – • Analyst interest of the stock /Instrument(s): - No. • Firm interest of the stock / Instrument (s): - No. Disclaimer Contact Us Amit Pathania Research Associate amit.pathania@choiceindia.com Rohan Patil Research Associate rohan.patil@choiceindia.com www.choicebroking.incustomercare@choiceindia.com SEBI Registered - Research Analyst Equities I Commodities I Currencies I Mutual Funds Aaj Ka Trend 21st Nov’16 Neeraj Yadav Research Advisor neeraj.yadav@choiceindia.com Anish Vyas Senior Research Associate anish.vyas@choiceindia.com Amit Pathania Digitally signed by Amit Pathania DN: cn=Amit Pathania, o=Choice Equity Broking Pvt. ltd, ou=Research Department, email=amit.pathania@choiceindia.com, c=IN Date: 2016.11.19 12:39:46 +05'30'