1. 10th Nov’14 Aaj Ka Trend
Bullions MCX Gold Dec Hourly Chart
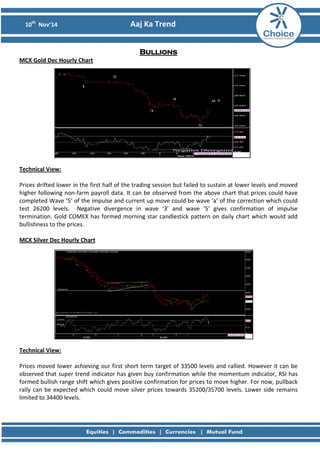
Technical View: Prices drifted lower in the first half of the trading session but failed to sustain at lower levels and moved higher following non-farm payroll data. It can be observed from the above chart that prices could have completed Wave ‘5’ of the impulse and current up move could be wave ‘a’ of the correction which could test 26200 levels. Negative divergence in wave ‘3’ and wave ‘5’ gives confirmation of impulse termination. Gold COMEX has formed morning star candlestick pattern on daily chart which would add bullishness to the prices. MCX Silver Dec Hourly Chart
Technical View: Prices moved lower achieving our first short term target of 33500 levels and rallied. However it can be observed that super trend indicator has given buy confirmation while the momentum indicator, RSI has formed bullish range shift which gives positive confirmation for prices to move higher. For now, pullback rally can be expected which could move silver prices towards 35200/35700 levels. Lower side remains limited to 34400 levels.
2. 10th Nov’14 Aaj Ka Trend
Fundamental News:
• Gold Prices shoots up after US Payroll data. USA payroll data came at 214k vs 254k.
• The payroll data indicates that the market is little bit gloomy.
Pivot Levels for the Day:
S1
S2
S3
Pivot
R1
R2
R3
Gold
25410
24887
24088
25686
26209
26485
27284
Silver
33811
32825
31174
34476
35462
36127
37778
Recommendation:
Gold
Buy
Silver
Buy
3. 10th Nov’14 Aaj Ka Trend
Base Metals MCX Copper Nov Hourly Chart
Technical Views: Prices moved higher as expected holding our mentioned support level of 407 and near our target of 419 levels. RSI has retested the 60 levels and inched higher. From the above chart it can be observed that prices have given hourly close above the downtrend line which gives positive confirmation for prices to move higher. We continue to say that as long as 407 levels are protected on down side prices can head towards 419 levels. COMEX Copper has also given downtrend line break out on hourly timeframe above 3.032$ levels.
MCX Aluminum Nov Hourly Chart
MCX Lead Nov Hourly Chart
MCX Nickel Nov Hourly Chart
MCX Zinc Nov Hourly Chart
4. 10th Nov’14 Aaj Ka Trend
Fundamental News:
• Copper prices inches up after Draghi comment and Positive USA Unemployment data.
• Unemployment figure came down to 278K vs 288K last week
Pivot Levels for the Day:
S1
S2
S3
Pivot
R1
R2
R3
Copper
410.1
407.2
401.5
413.0
415.9
418.7
424.5
Aluminum
126.2
125.5
123.3
127.6
128.4
129.8
131.9
Lead
123.6
122.4
120.3
124.6
125.8
126.7
128.9
Nickel
934.5
926.1
903.0
949.2
957.6
972.3
995.4
Zinc
136.8
136.0
134.1
137.8
138.6
139.7
141.5
Recommendation:
Copper
Buy
Aluminum
Sell
Lead
Buy
Nickel
Neutral
Zinc
Sell
5. 10th Nov’14 Aaj Ka Trend
Energy MCX Crude Nov Hourly Chart:
Technical Views: Crude prices gave a gap down opening moved lower almost achieving our short term target of 4750 levels but failed to sustain at lower levels and moved higher. We now change our bias to positive as it can be observed that prices have given close above the previous intermediate high of 4850 levels For now, 4910/4950 levels can be expected with immediate support of 4820 levels. RSI has also moved above 60 which suggest momentum in prices. MCX Natural Gas Oct Hourly Chart:
Technical Views: Prices moved higher achieving both the short term targets. From the above chart it can be observed that prices have traded in higher top higher bottom formation while taking support of the uptrend line. The momentum indicator, RSI has remained above 60 levels. We now expect prices to move higher near 280 while breach of the mentioned trend line would negate this bullishness.
6. 10th Nov’14 Aaj Ka Trend
Fundamental News:
• Crude oil futures rose on Friday, after the release of U.S. nonfarm payrolls.
• On the New York Mercantile Exchange, U.S. crude oil for delivery in December traded at $78.15 a barrel during European early afternoon trade, up 0.21$ or 0.28%.
• Investing.com - Natural gas futures moved higher on Thursday after updated weather-forecasting models call for blasts of cold air to sweep across the U.S. this November, which offset news that U.S. stockpiles rose more last week than markets were expecting.
• On the New York Mercantile Exchange, natural gas futures for delivery in December were up 3.02% at $4.321 per million British thermal units during U.S. trading. The commodity hit a session low of $4.127, and a high of $4.325.
Pivot Levels for the Day:
S1
S2
S3
Pivot
R1
R2
R3
Crude
4795
4729
4618
4840
4906
4951
5062
Natural Gas
194.6
223.5
211.5
235.5
206.6
247.5
259.5
Recommendation:
Crude
Buy
Natural Gas
Buy
8. 10th Nov’14 Aaj Ka Trend
This is solely for information of clients of Choice Broking and does not construe to be an investment advice. It is also not intended as an offer or solicitation for the purchase and sale of any financial instruments. Any action taken by you on the basis of the information contained herein is your responsibility alone and Choice Broking its subsidiaries or its employees or associates will not be liable in any manner for the consequences of such action taken by you. We have exercised due diligence in checking the correctness and authenticity of the information contained in this recommendation, but Choice Broking or any of its subsidiaries or associates or employees shall not be in any way responsible for any loss or damage that may arise to any person from any inadvertent error in the information contained in this recommendation or any action taken on basis of this information. Technical analysis studies market psychology, price patterns and volume levels. It is used to forecast future price and market movements. Technical analysis is complementary to fundamental analysis and news sources. The recommendations issued herewith might be contrary to recommendations issued by Choice Broking in the company research undertaken as the recommendations stated in this report is derived purely from technical analysis. Choice Broking has based this document on information obtained from sources it believes to be reliable but which it has not independently verified; Choice Broking makes no guarantee, representation or warranty and accepts no responsibility or liability as to its accuracy or completeness. The opinions contained within the report are based upon publicly available information at the time of publication and are subject to change without notice. The information and any disclosures provided herein are in summary form and have been prepared for informational purposes. The recommendations and suggested price levels are intended purely for trading purposes. The recommendations are valid for the day of the report however trading trends and volumes might vary substantially on an intraday basis and the recommendations may be subject to change. The information and any disclosures provided herein may be considered confidential. Any use, distribution, modification, copying, forwarding or disclosure by any person is strictly prohibited. The information and any disclosures provided herein do not constitute a solicitation or offer to purchase or sell any security or other financial product or instrument. The current performance may be unaudited. Past performance does not guarantee future returns. There can be no assurance that investments will achieve any targeted rates of return, and there is no guarantee against the loss of your entire investment. POTENTIAL CONFLICT OF INTEREST DISCLOSURE (as on date of report) Disclosure of interest statement – • Analyst interest of the stock /Instrument(s): - No. • Firm interest of the stock / Instrument (s): - No.
Disclaimer